Bitcoin Leads, Altcoins Follow — But 2026 Won’t Mirror 2016: Here’s What’s Really Different This Time
Jakarta, Pintu News – The cryptocurrency market is now being viewed through a cyclical lens, with investors debating whether past market patterns still provide reliable signals. A comparison between 2016 and 2026 shows similar tensions.
Several timing patterns and technical behaviors reappear with striking similarities, suggesting similar cyclical patterns in the crypto market. At the same time, however, market sentiment has changed significantly in the last ten years due to regulatory advancements and increased adoption.
Bitcoin Halving Synchronization between 2016 and 2026
The strongest and most measurable link between 2016 and 2026 lies in the Bitcoin halving cycle. In July 2016, Bitcoin was trading at around $651 when its second halving occurred. The market then peaked at around $19,700 in December 2017, about 526 days after the halving, marking a gain of almost 2,900%.
Read also: Bitcoin Richest People List: Who will own the most BTC by 2026?
A similar scenario occurred after the fourth halving in April 2024. At that time, Bitcoin was around $63,000 and peaked near $126,200 in October 2025, approximately 534 days later. While the timing of the rise was very similar to the previous cycle, the rise was much lower-about 100% of the price at halving, or about 38% overall.
The similarity in the timing of the peak-around 520 to 530 days after the halving-is interesting to observe. However, the decline in the magnitude of gains is also striking. The post-halving rise is now much lower as the Bitcoin market matures, with capitalization growing from around $10 billion in 2016 to around $1.8 trillion by 2026.
The difference between these two cycles shows that while the market still follows a similar timing pattern (most likely influenced by programmed changes in Bitcoin supply), the magnitude of the price movement is likely to decrease.
Greater institutional involvement has added liquidity and stability, reducing the extreme speculative spikes that have occurred in the past.
Altcoin Season Shows Similar Pattern
One of the most interesting correlations appears in the timing patterns of altcoin cycles. In the fourth quarter of 2016, the ratio of altcoins to Bitcoin (ALT/BTC) bottomed out, marking the bottom of a period of altcoin underperformance.
Entering the first and second quarter of 2017, the altcoin season exploded tremendously: Ethereum jumped 17,400% from $8 to $1,400, XRP rose 64,000% from $0.006 to $3.84, and even small projects increased dozens of times in a matter of days.
Ten years later, in the fourth quarter of 2025, ALT/BTC formed another bottom, mirroring the 2016 pattern with almost perfect accuracy. In early January 2026, the Altcoin Season Index reached 55, the highest in three months, indicating the early phase of the altseason.
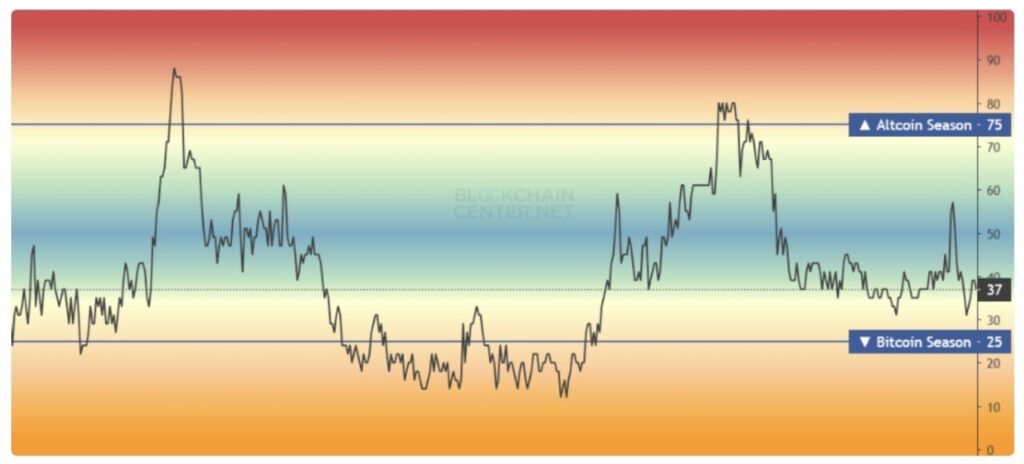
Based on historical patterns from the 2016-2017 and 2020-2021 cycles, the altseason usually starts within 3-4 months after this bottom point-which means the second to third quarter of 2026 could potentially be a time of strong performance for altcoins.
This correlation is important because it reflects overall market behavior, not just the Bitcoin halving cycle. When Bitcoin’s dominance reaches its peak and investors start shifting funds to other cryptocurrencies, the same pattern tends to repeat itself in various market cycles. All that differs is the magnitude of the gains.
The current altcoin rally is likely to be more moderate, as most projects are now operating in a more regulated and transparent environment – in contrast to the almost unregulated market of 2017.
Bitcoin’s Dominance Shows Reverse Correlation and Deviation
Bitcoin dominance-that is, the percentage of the crypto market capitalization represented by Bitcoin-reveals important deviations between 2016 and 2026. In 2016, Bitcoin dominance averaged 82.6%, when the market was still recovering from the Mt. Gox collapse and the master narrative of Bitcoin as “digital gold” was still very strong.
However, when the altcoin season peaked at the end of 2017, this dominance plummeted to 32%, reflecting a drop of more than 50 percentage points in Bitcoin’s market share.
In contrast, 2026 opens with Bitcoin’s dominance in the 59%-61% range, a level that has been steadily increasing since 2023 after previously hitting a low of around 40%.
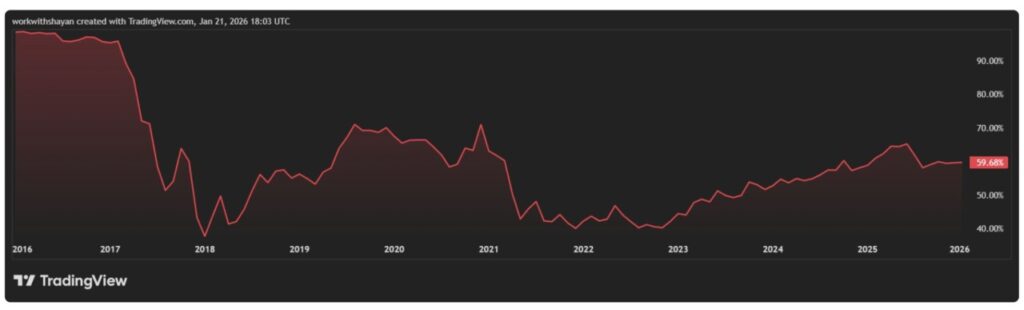
Instead of following the 2016 pattern of a sharp decline ahead of altseason, Bitcoin’s dominance in 2026 is increasing. This suggests that institutional capital is likely to consolidate on Bitcoin as the primary strategic reserve, rather than on altcoin hype.
Read also: Steak ‘n Shake Launches Bitcoin (BTC) Bonus for Employees!
Historical analysis shows that during the 2016 and 2020 halving cycles, Bitcoin’s dominance eventually dropped to around 40% before recovering. The key question for 2026 is whether these support levels will hold, or if Bitcoin’s dominance will continue to increase-something that would be a departure from the notion that 2026 will repeat the pattern of 2016.
Post-Halving Yield Decline from 2016 to 2026
The most striking thing is how drastically the post-halving profits drop over time. The following numbers show it clearly:
- Halving 2012: 9.483% yield in the following 13 months
- Halving 2016: 2.931% yield in the following 17 months
- Halving 2020: 702% yield in the next 11 months
- Halving 2024: 38% yield (until January 2026)
This data shows a sharp decline from one cycle to the next. With each new cycle, the gains made are only a fraction of the previous cycle.
As Bitcoin’s market value grows and institutional capital comes in, price volatility becomes lower and more manageable.
The conclusion is very clear: even if the market in 2026 follows a similar timeline to 2016-starting with an altcoin rally and followed by a decline-the magnitude of gains will most likely be much more limited.
A more mature market and lower leverage levels make explosive price spikes like in the early cycles increasingly unlikely.
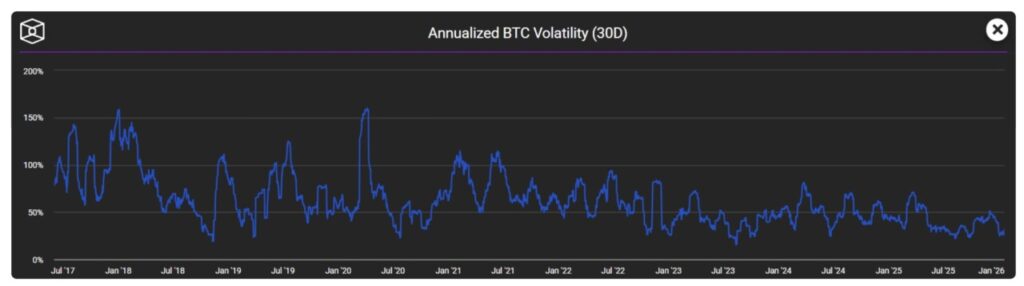
Expansion of Bitcoin’s Base Volatility and Capital Base
Another notable difference is seen in Bitcoin’s volatility. In 2016, Bitcoin’s average 30-day volatility was recorded at 2.49% – low enough to compare to the 4.13% volatility during the ICO boom in 2017.
However, in 2025, although Bitcoin reached a record high of close to $126,000 before undergoing a correction, its daily volatility dropped to just 2.24%-the lowest in Bitcoin’s history.
This paradox shows that Bitcoin’s volatility “floor” has risen sharply in the past decade. In 2016, Bitcoin’s volatility floor was $366. Today, it stands at $76,329-a 208-fold increase-reflecting the depth of institutional capital now backing the asset.
Read also: XRP Retail Sentiment Shifts from Greed to Extreme Fear – A Bullish Sign?
The arrival of the spot Bitcoin ETF, which was approved in January 2024, helped reduce volatility by 55% compared to the period before the ETF, by providing stable institutional buyers.
This change in market structure means that while 2026 follows a cyclical time pattern like 2016, the movements are likely to be noticeably calmer. Institutional investors now play a much bigger role in keeping prices stable and limiting sharp declines.
As a result, market behavior is changing: the emotional exuberance driven by retail investors in 2016 is being largely replaced by strategy-based investment decisions from big players.
Market Sentiment in 2026 Tends Toward Allocation
Perhaps the most fundamental correlation lies in the maturity of the market itself. In 2016, the crypto market was driven entirely by retail speculation. There was almost no institutional participation, the regulatory framework was almost non-existent, and the total market capitalization was only around $10 billion.
By 2026, more than 200 publicly traded companies held Bitcoin, the government had a strategic reserve of 307,000 BTC, and institutional holdings now account for around 10-14% of the total Bitcoin supply.
This change in structure explains why 2026 could follow the same cycle time pattern as 2016, but exhibit very different market behavior. Institutional money now plays a large role, linking crypto prices more closely to macroeconomic factors such as interest rates, the value of the dollar, and bond yields-factors that were barely taken into account in 2016, when speculation was the main driver of prices.
Today, inflows and outflows to Bitcoin ETFs can reach over $1 billion in a single day, making macro conditions the main driver of price action. Patterns like this simply didn’t exist a decade ago.
Halving Cycle in a More Mature Market
A key question in the comparison between 2016 and 2026 is whether Bitcoin’s four-year halving cycle is still the main driver of the market. Existing evidence suggests two sides.
Proponents argue that old patterns still emerge, such as bull market peaks that usually occur around 500 days after the halving, altcoin rotations at the end of the year, as well as bear markets that remain for a year or more.
Skeptics, however, argue that these patterns are not as important as they once were. Matt Hougan, for instance, argues that the advent of ETFs, regulatory clarity, and easy access for institutions have softened the sharp up-and-down cycles that used to characterize the crypto market.
The data supports this view to some extent. Although the time pattern around halving is still consistent, the magnitude of profits has shrunk dramatically compared to 2016.
The end result is a market that still echoes the old patterns, but no longer responds in the same way. Institutional participation now plays a decisive role, triggering dynamics that were almost non-existent a decade ago.
Follow us on Google News to stay up to date with the latest in crypto and blockchain technology. Check Bitcoin price, usdt to idr and tokenized nvidia stock price via Pintu Market.
Enjoy an easy and secure crypto trading experience by downloading the Pintu crypto app via Play Store or App Store now. Also, experience web trading with advanced trading tools such as pro charting, various order types, and portfolio tracker only at Pintu Pro.
*Disclaimer
This content aims to enrich readers’ information. Pintu collects this information from various relevant sources and is not influenced by outside parties. Note that an asset’s past performance does not determine its projected future performance. Crypto trading activities are subject to high risk and volatility, always do your own research and use cold hard cash before investing. All activities of buying and selling Bitcoin and other crypto asset investments are the responsibility of the reader.
Reference:
- Coinpedia. Bitcoin Leads and Altcoins Follow, But 2026 Isn’t 2016: Here’s What You Need to Know. Accessed on January 23, 2026


