Ethereum Slides to $2,100 as Network Activity Nears a Critical Level

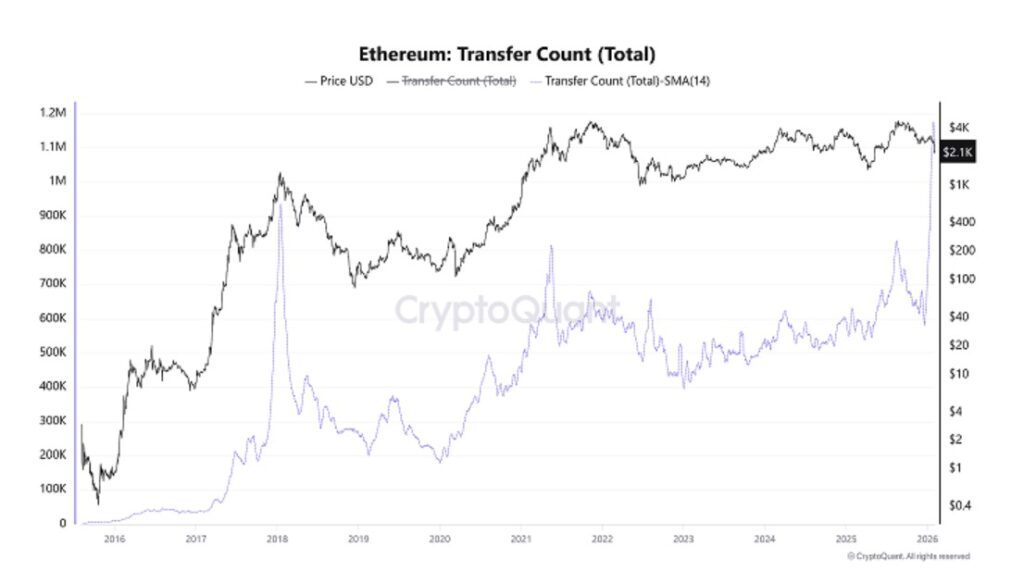
Jakarta, Pintu News – Ethereum price is currently under pressure as sensitive signals emerge from on-chain data. At the end of January, the total number of Ethereum transfers – averaged using a 14-day Simple Moving Average (SMA) – jumped sharply to 1.17 million.
The figure was previously associated with a major turning point in the market. This sudden spike has reignited concerns about potential risks in the short term. So, how will Ethereum price move today?
Ethereum Price Drops 4.31% in 24 Hours
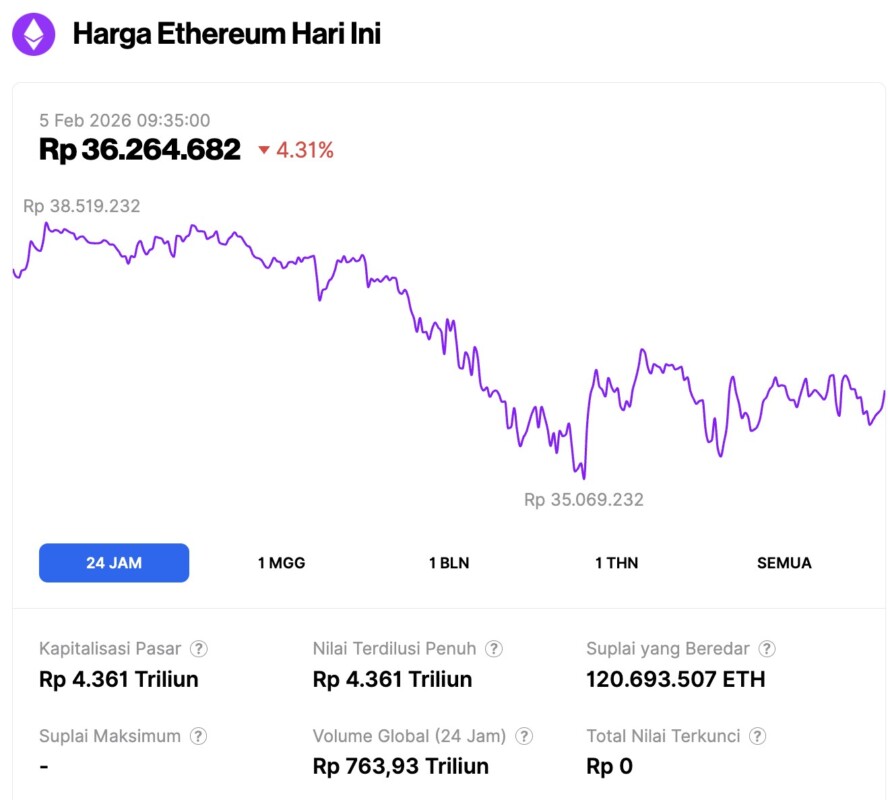
On February 5, 2026, Ethereum was trading at approximately $2,149, or around IDR 36,264,682—marking a 4.31% drop over the past 24 hours. During this time, ETH hit a low of IDR 35,069,232 and reached a high of IDR 38,519,232.
At the time of writing, Ethereum’s market capitalization is estimated at around IDR 4,361 trillion, while its 24-hour trading volume has declined by 7% to IDR 763.93 trillion.
Read also: Bitcoin Plunges to $72,000 as Analysts Point to Patterns from Previous Bull Runs
Ethereum Network Activity Reaches Critical Threshold
The latest Ethereum price chart shows developments amid a sharp spike in network activity. Based on on-chain data, the number of transfers increased rapidly to reach levels that have rarely lasted long in previous market cycles.
While increased activity can be a sign of widespread adoption, the speed and magnitude of this surge puts it in a more cautionary category.
Historically, sudden spikes like this often appear in times of stress. Meanwhile, price movements on higher time frames begin to weaken, suggesting that this activity may not be entirely driven by organic growth. Instead, it could reflect a shift in market positioning as participants adjust their exposure.
Historical Patterns from 2018 and 2021 Reappear
Digging deeper, Ethereum’s historical data corroborates these concerns. In January 2018, a spike in the number of transfers occurred a few days before Ethereum reached its cyclical peak. At that time, price momentum weakened and the market entered a prolonged bearish phase.
A similar pattern occurred on May 19, 2021. Transfer activity spiked sharply as price volatility increased, coinciding with a broad market crash.
In both cases, the surge in network activity reflected distribution and forced flows, rather than healthy accumulation. While history does not always repeat itself exactly, these structural similarities keep the risks high.
On-Chain Signals Lead to Distribution and Volatility
From an analytical point of view, parabolic spikes in transfer amounts often occur when the market is in an extreme emotional state. Typically, this phase is characterized by massive asset movements between wallets and exchanges. This behavior reflects profit realization, collateral rebalancing, or transfers due to liquidation.
At the same time, volatility tends to peak around events like these. In the Ethereum ecosystem, spikes in transaction volume have historically occurred when confidence begins to waver on either side of the market.
Therefore, increased activity does not mean that the direction of movement is certain-it signals instability.
Read also: Ethereum Under Pressure: Vitalik Buterin Moves 5,493 ETH, Trend Research Releases 20 Thousand ETH
MVRV Bands Highlight Lower Valuation Zones
Adding to the sense of caution, Ethereum’s MVRV pricing bands indicator is showing a shift towards historically important territory. Ethereum price in USD is likely to form a strong bottom only after dropping below the MVRV level of 0.80-which is currently slightly below $2,000.
In previous cycles, Ethereum price usually spent a long time in a consolidation phase around this low valuation zone before finally entering a recovery phase. From a structural point of view, Ethereum price predictions are still heavily influenced by whether this zone will be tested or successfully defended.
Meanwhile, the dynamics of the cost basis (average purchase price) continue to increase slowly, which does lift the long-term lower bound, but has not completely eliminated downside risks.
Ethereum Price Weighs Between Risk and Revaluation
However, market movements rarely run in a straight line. While the current signal indicates increased risk, it also reflects the market conditions undergoing transition.
As excessive speculation wanes, the Ethereum price will probably continue to seek equilibrium within historically relevant valuation ranges. Whether market activity stabilizes or intensifies will be the deciding factor in the direction of the near-term movement ahead.
Follow us on Google News to stay up to date with the latest in crypto and blockchain technology. Check Bitcoin price, usdt to idr and tokenized nvidia stock price through Pintu Market.
Enjoy an easy and secure crypto trading experience by downloading the Pintu crypto app via Play Store or App Store now. Also, experience web trading with advanced trading tools such as pro charting, various order types, and portfolio tracker only at Pintu Pro.
*Disclaimer
This content aims to enrich readers’ information. Pintu collects this information from various relevant sources and is not influenced by outside parties. Note that an asset’s past performance does not determine its projected future performance. Crypto trading activities are subject to high risk and volatility, always do your own research and use cold hard cash before investing. All activities of buying and selling Bitcoin and other crypto asset investments are the responsibility of the reader.
Reference:
- Coinpedia. Ethereum Price Faces Historical Stress Test as Transfer Counts Spike. Accessed on February 5, 2026


