XRP vs Solana: Which Altcoin will Rebound First After Crypto Bear Market?
Jakarta, Pintu News – The crypto market is currently in a phase of high-risk capitulation, and the impact is now evident even on large coins with the highest liquidity.
After the recent massive price crash and the wave of deleveraging that followed, Solana and XRP have taken a hit. Interestingly, both altcoins are now trading at a steep discount, down around 43% and 45% respectively from their price peaks in early 2026.
At first glance, both seem equally devastated. However, on closer inspection, their recovery paths look very different. In this analysis, CCN discusses the current price positions of XRP and Solana, and assesses whether they still have a chance to bounce back after this brutal decline.
Solana price plummets
By the end of the week, SOL prices had fallen through the crucial $100 level. After missing an important support area for the first time in nine months, SOL finally found buyers just below $96.
Read also: Vitalik Buterin Goes All-Out to Support Zcash with Big Steps in the Privacy Realm
However, such a response is not yet a definitive bottom. However, it does indicate a market reaction-exactly what one would expect from an asset that usually leads the way, both on the way up and on the way out of a fear phase.
What’s more interesting is the divergence that formed below the price movement. While the SOL is printing lower lows, the Chaikin Money Flow indicator is slowly moving up. This signals that the big players appear to be absorbing supply, rather than panic selling.
XRP vs SOL: Current Position of Both
The real test for Solana is much tougher than XRP. As long as the price remains below the $100 area, any upside only risks being considered a temporary bounce (simply a trading opportunity), rather than the start of a strong new trend.
Historically, when SOL manages to stabilize and break out and confirm key levels, the movement is usually very fast. However, in this case, it seems that the Solana price is not showing any signs of an important breakout.
| Metrics | Solana (SOL) | XRP (Ripple) |
|---|---|---|
| Current Price | $82,70 | $1,42 |
| YTD Decline | -43,2% | -44,9% |
| Fear & Greed Index | 5 (Extreme Fear) | 14 (Extreme Fear) |
| Recovery Sentiment | Potential V-Shape pattern | Consolidation |
| Nearby Resistance | $120 | $1,80 |
SOL Price Analysis
Solana’s daily chart is currently forming a head and shoulders top pattern. This structure developed over the past few months. The left shoulder formed during the price increase in mid-2025, followed by a strong push that formed a head in the area around $250, where the price then declined.
After that, a right shoulder formed below the head, stuck in the range of 0.5-0.618 Fibonacci zone ($160-$180). This signaled that the bullish setup was starting to weaken. The neckline of the pattern aligns with the 0.236 Fibonacci retracement area around $112, which was previously a crucial support through the end of 2025. As soon as Solana broke below this zone, selling pressure increased sharply.
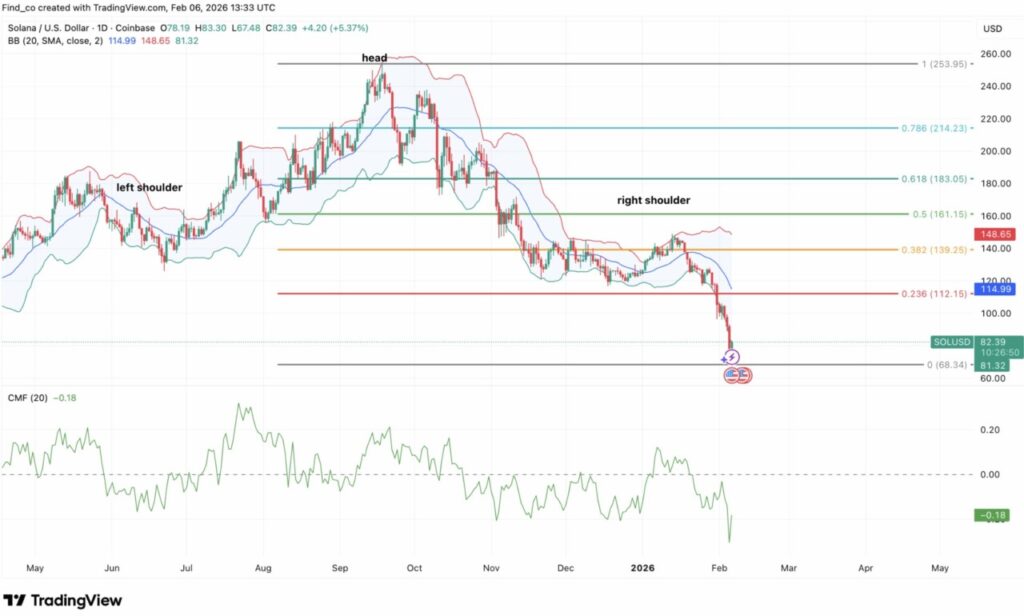
The momentum indicator also reinforces this bearish structure. At the time of writing, Solana’s price is moving well below the center line of the Bollinger Band, while the lower band is widening – suggesting volatility is increasing towards the downside.
The Chaikin Money Flow (CMF) indicator is still in the negative area, which suggests capital outflows still dominate. This means the price drop is driven by real selling pressure, not just a mild correction.
In a broader perspective, the current bounce from the $80 area looks more like a corrective rally rather than an impulsive up-move that marks a major trend change. For this bearish setup to be invalidated, Solana needs to reclaim the broken neckline around $115 and hold above that level with strong volume support.
Until that happens, rallies are more likely to be used to sell on the upside, as the market is still in the process of clearing excess leverage and previous speculative positions.
XRP in Bearish Zone
In contrast to Solana, XRP looks less explosive and more “orderly” in its movements-and at the moment, it looks even more stuck. The price is hovering around $1.50, which is a 14-month low, while the chart structure still doesn’t show a clear direction.
Read also: Crypto Market Turns Green as 5 Altcoins Soar Up to 42% on February 9, 20262026
Instead of a sharp bounce, XRP is moving sideways in a rather flat pattern, which suggests a stabilization phase rather than a strong accumulation phase.
On the lower timeframe, a bearish pennant pattern was formed which is still pressuring the price downwards. As long as the market has not been able to reclaim the area around $1.58, the risk of a further decline towards the $1.20 range is still open.
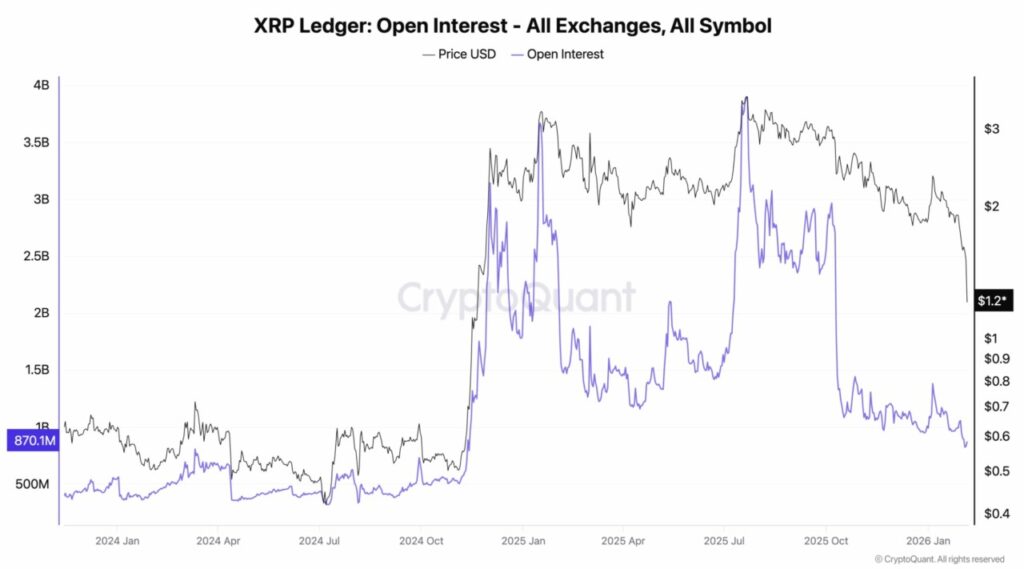
What sets XRP apart is its derivatives market position. Futures open interest has dropped to around $831.88 billion, indicating that many leveraged long positions have been liquidated.
This reduces the risk of a sudden wave of liquidation. But on the other hand, it also reduces the “fuel” for short squeezes or sharp rises triggered by unhealthy positions.
Without much leverage and without the urgency factor, XRP’s price recovery could potentially be slower and institutionally-driven, rather than a quick reactive spike.
XRP Price Analysis
XRP’s daily chart still shows a clearly established descending channel pattern guiding the price movement since the mid-2025 peak.
Every time the price tries to go up, the rally is held back by the upper trendline. Meanwhile, a series of lower lows continue to form at the lower boundary of the channel, confirming a larger bearish structure.
In terms of Fibonacci, the price position of XRP – compared to Solana – is still below some important retracement levels that previously served as support. The 0.236 level around $1.75 has already been broken downwards. Currently, the price is still struggling to reclaim the area despite the intraday surge.
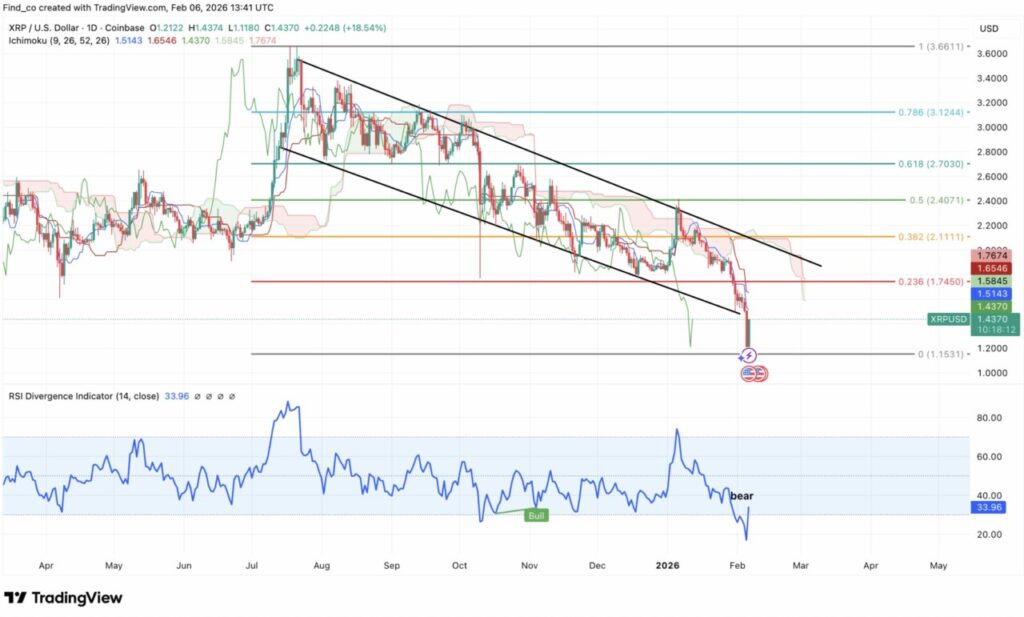
Above it, the 0.382 ($2.11) and 0.5 ($2.40) levels coincide with the resistance area of the channel, forming a strong confluence zone that sellers are likely to utilize to push the price back down, unless there is a truly significant momentum boost.
The Ichimoku Cloud is also signaling additional caution: prices are still moving below the downward-sloping cloud.
Although the short-term line (Tenkan/Kijun) may try to curve up after the bounce, the presence of the cloud as resistance above the price hints that the current rise is more potentially just a corrective pullback, not the start of a new uptrend.
In addition, the RSI indicator is still weak, moving around the 30s even after the rebound. This indicates that XRP is still in bearish territory.
Indeed, the recent bullish divergence helped trigger the price bounce. However, the failure of the RSI to bounce back and stay above the 50 level shows that the momentum is not really in favor of the buyers.
Historically, strong trend reversals usually occur when the RSI moves from oversold conditions towards neutral to bullish ranges on a sustained basis. In short, XRP’s current price movement is more accurately referred to as a relief rally within a major downtrend.
To confirm a noticeable trend change, the price needs to break and hold above the descending channel, reclaim the 0.382 Fibonacci zone, as well as turn the Ichimoku Cloud from a resistance into a support area.
Conclusion
Both assets fall victim to the same macro shocks, but the way each responds reflects its fundamental character.
Solana tends to bounce first, and then “rethink” the situation. XRP instead moves slowly sideways, as if waiting for certainty and confirmation first.
In the capitulation phase, differences like this are quite important. One usually moves more quickly and aggressively at the beginning, while the other tends to move later, but more measuredly.
For now, neither XRP nor Solana have shown strong evidence that the market has actually formed a convincing bear market bottom. Under the current conditions, the risk of further declines is still quite real before a truly sustainable recovery phase can finally emerge.
Follow us on Google News to stay up to date with the latest in crypto and blockchain technology. Check Bitcoin price, usdt to idr and tokenized nvidia stock price through Pintu Market.
Enjoy an easy and secure crypto trading experience by downloading the Pintu crypto app via Play Store or App Store now. Also, experience web trading with advanced trading tools such as pro charting, various order types, and portfolio tracker only at Pintu Pro.
*Disclaimer
This content aims to enrich readers’ information. Pintu collects this information from various relevant sources and is not influenced by outside parties. Note that an asset’s past performance does not determine its projected future performance. Crypto trading activities are subject to high risk and volatility, always do your own research and use cold hard cash before investing. All activities of buying and selling Bitcoin and other crypto asset investments are the responsibility of the reader.
Reference:
- CCN. XRP or Solana (SOL): Which Altcoin Is Likely to Recover First After the Crypto Bear Market? Accessed on February 9, 2026