Ethereum Price Holds at $1,900 as ETF Outflows Mount – Is ETH on the Brink?

Jakarta, Pintu News – Ethereum price today moved around $1,945 after previously testing the $1,900 support level due to a 10% correction in the past week. This slight increase comes amid fund outflows from the spot Ethereum ETF that reached $129 million on February 11, making it one of the largest daily outflows since the product was launched.
Ethereum Price Drops 0.89% in 24 Hours
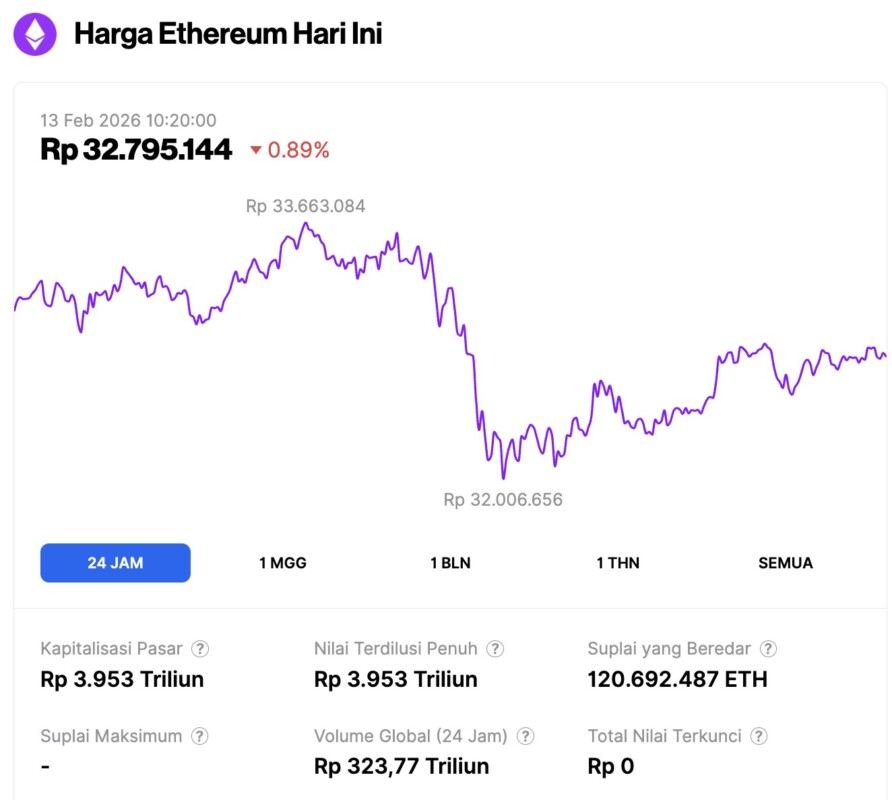
On February 13, 2026, Ethereum was trading at around $1,945, or roughly IDR 32,795,144, marking a 0.89% decline over the past 24 hours. During that period, ETH fell to a low of IDR 32,006,656 and reached a high of IDR 33,663,084.
As of writing, Ethereum’s market capitalization stands at around IDR 3,953 trillion, while its daily trading volume has fallen 17% to about IDR 323.77 trillion over the last 24 hours.
Read also: Bitcoin Price Drops to $67,000 Today: Analysts Forecast a BTC Crash?
ETF Outflows Increase, Fidelity Leads Sales
Based on SoSoValue data, spot Ethereum ETFs recorded net outflows of US$129.18 million in yesterday’s trading, with Fidelity’s FETH ETF being the most aggressive in selling, at around US$67.99 million. Total net assets now stand at around US$11.27 billion, equivalent to about 4.78% of Ethereum’s market capitalization.
Cumulatively, Ethereum ETF net inflows are still positive at US$11.75 billion. But the spike in outflows in recent days indicates that institutional players are likely to reduce exposure, rather than capitalize on price weakness for accumulation. When fund flows in the spot market and ETFs both turn negative, prices are usually depressed, which explains the breakout of the US$2,000 level in terms of price.
This outflow contrasts with previous optimism regarding institutional adoption. BlackRock’s ETHA product and Grayscale’s ETH product did record smaller outflows, but the overall trend shows a dispersed (sell) distribution across different issuers.
As long as there has not been a reversal of ETF fund flows to re-enter, the price of Ethereum is still vulnerable to further decline.
Price Corrected Below All Major EMAs
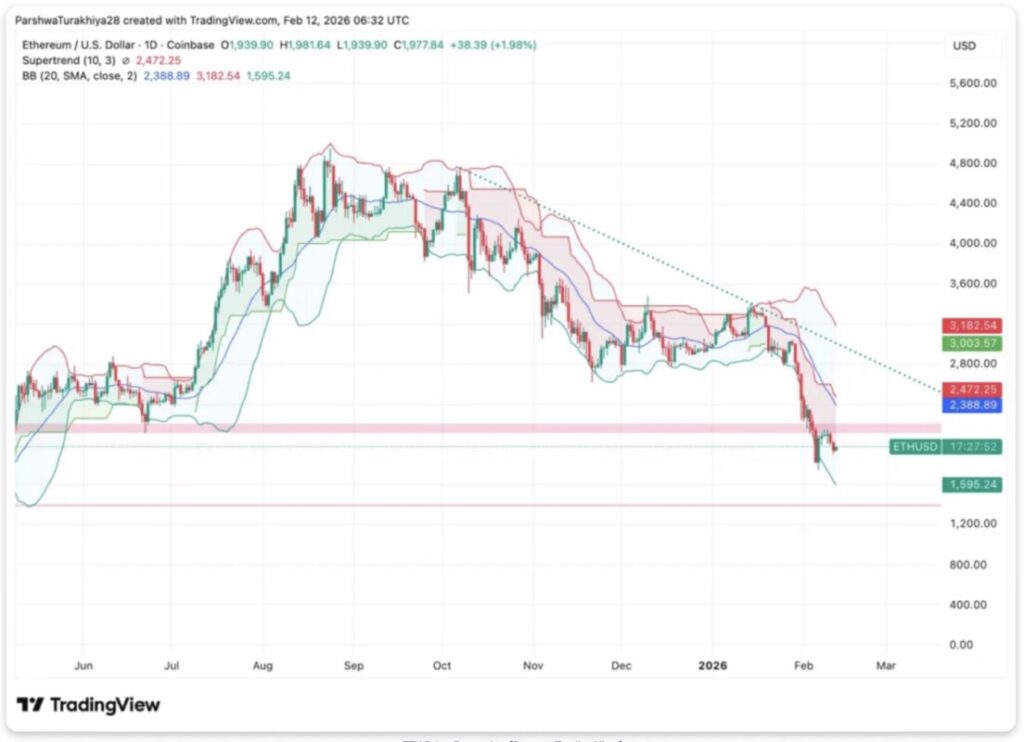
On the daily chart (12/2), Ethereum price is now moving below all major moving averages. The 20-day EMA is around $2,388, the 50-day EMA is around $3,182, and the 100-day EMA is around $3,003. The Bollinger Bands indicator shows the middle band at $1,595, and the price is currently testing that area after falling sharply from the December high above $4,000.
The technical structures seen include:
- The Supertrend indicator shows a bearish signal around $2,472, confirming the downward trend.
- The price broke below the $2,000 psychological level.
- The descending trendline from the August price peak continues to hold back any rallies.
- The $1,900 area acts as the closest support zone.
Ethereum lost the 20-day EMA support since late January and has so far failed to break back above it in several attempts. The price movement pattern also changed from consolidation to breakdown, putting the market in a corrective phase.
A daily close above $2,388 would be an early signal that selling pressure is starting to weaken as the 20-day EMA was recaptured, but the current momentum is still to the downside.
The $1,900 level is a crucial psychological support. If this area is broken, selling pressure has the potential to drag the price towards the next demand zone around $1,750, which is the area where previous buyers came back in during past corrections.
Read also: Bitcoin Plunges 50%, Here’s a List of Grayscale’s Favorite Crypto to Rebound: ETH, SOL, LINK & More
Symmetrical Triangle Pattern Indicates Pressure in the Apex Area
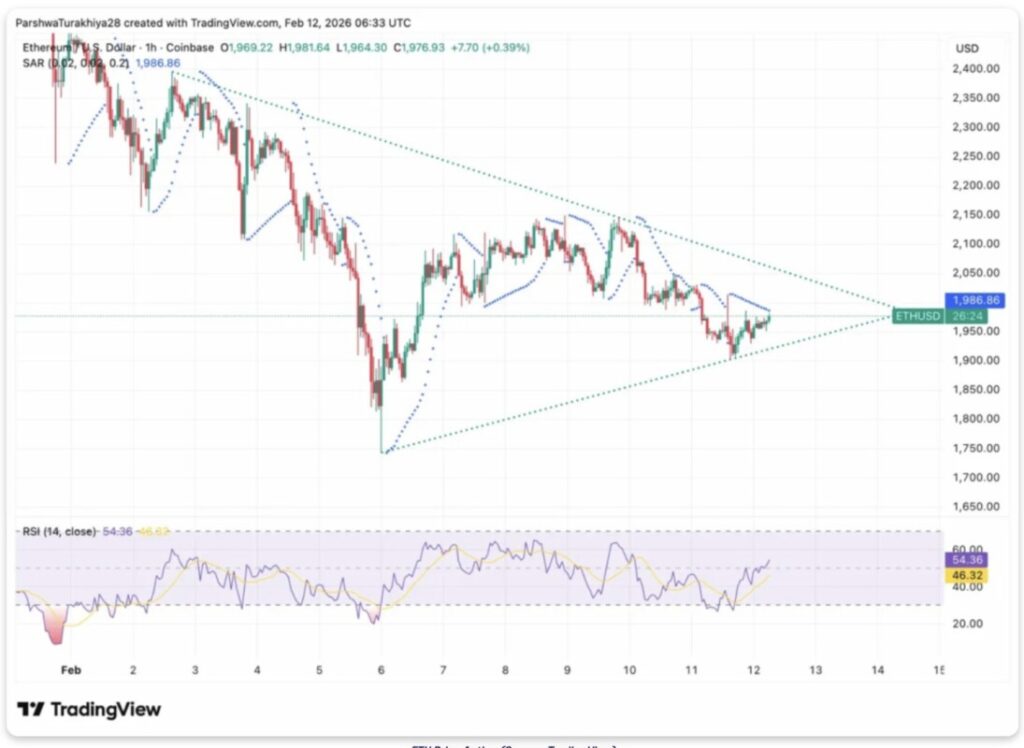
On the 1-hour chart (12/2), Ethereum looks trapped in a symmetrical triangle pattern, with price action narrowing further towards the apex area around $1,976. The Parabolic SAR indicator is at the $1,986 level and serves as the nearest resistance.
Meanwhile, the RSI was in the range of 54.36 – neutral, but started to show recovery after previously touching the oversold area.
The structure of the movement shows that:
- The price formed a higher low from the base area around $1,830.
- The triangle resistance is near the $2,000 level.
- Narrowing of the range (compression) signals the potential for a big move, either a breakout or breakdown.
On the downside, buyers are trying to defend the lower border of the triangle after a sharp drop from the $2,150 area. If the price manages to break above the $2,000 level with strong volume support, the bearish scenario could be invalidated and open the opportunity for a retest of the $2,150 level.
Conversely, if the price breaks below $1,900, the downtrend could potentially continue with the next target towards the $1,750 area.
In theory, a triangle pattern like this is usually followed by a continuation move with a range roughly equivalent to the height of the pattern. With a compression range between $1,900 to $2,100, a clean break in either direction could trigger considerable volatility.
Glamsterdam and Hegota Upgrades Focus on Scalability

Ethereum is scheduled to undergo two major upgrades in 2026. The Glamsterdam upgrade is planned for the first half of the year, featuring Proposer-Builder Separation and Block-Level Access Lists aimed at improving MEV fairness and strengthening censorship resistance.
Following this, the Hegota update will be implemented by the end of 2026 by implementing Verkle Trees to improve access state and increase network scalability.
Currently, developers are testing on blob-devnet-0 so that the mainnet will be able to accommodate more blobs, although Prysm and Lighthouse clients still face some integration issues. The bals-devnet-2 testnet is scheduled to launch on February 4, while the epbs-devnet-0 network is planned to follow in late February.
These upgrades bring significant technical improvements, but the market does not seem to have fully priced in their potential impact. Current price movements reflect short-term selling pressure more than expectations of upcoming network updates.
If ETF fund flows begin to stabilize and key technical levels are maintained, the narrative around the upgrade has the potential to become a price support as 2026 progresses.
Follow us on Google News to stay up to date with the latest in crypto and blockchain technology. Check Bitcoin price, usdt to idr and tokenized nvidia stock price via Pintu Market.
Enjoy an easy and secure crypto trading and crypto gold investment experience by downloading the Pintu crypto app via Play Store or App Store now. Also, experience web trading with advanced trading tools such as pro charting, various order types, and portfolio tracker only at Pintu Pro.
*Disclaimer
This content aims to enrich readers’ information. Pintu collects this information from various relevant sources and is not influenced by outside parties. Note that an asset’s past performance does not determine its projected future performance. Crypto trading activities are subject to high risk and volatility, always do your own research and use cold hard cash before investing. All activities of buying and selling Bitcoin and other crypto asset investments are the responsibility of the reader.
Reference:
- CoinEdition. Ethereum Price Prediction: ETH Clings To $1,900 Support After $129M ETF Exodus. Accessed on February 13, 2026


