Ethereum Holds Firm at $1,900 Amidst Signs of On-Chain Recovery

Jakarta, Pintu News – The price of Ethereum rose by about 1% and stayed around $2,000 on February 17. However, this is not the first time ETH has tried to bounce back. In the last 10 days (between February 6 and February 15), Ethereum made three rebound attempts. Each of them showed strong signs at the beginning, but eventually failed to continue rising.
Now, the chart explains why each of these attempts failed. The data also shows what needs to change for the Ethereum price outlook to finally turn bullish. So, how will Ethereum price move today?
Ethereum Price Up 0.14% in 24 Hours
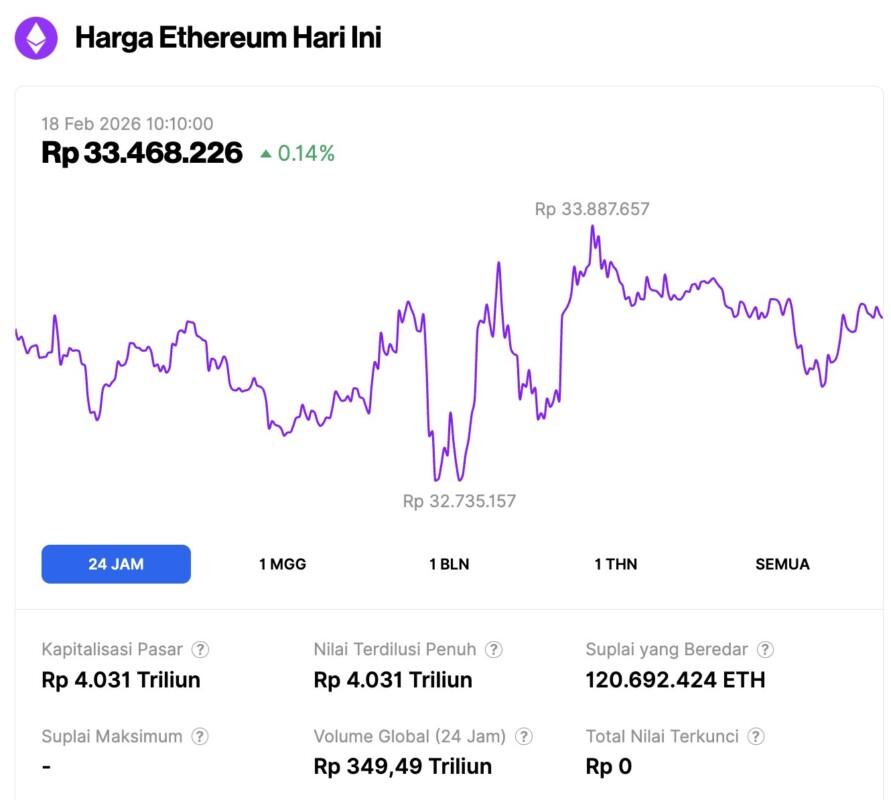
Ethereum held steady on February 18, 2026, edging up just 0.14% to trade around $1,986 (approximately IDR 33.46 million). Throughout the session, the asset saw some volatility, fluctuating between a low of IDR 32.73 million and a high of IDR 33.88 million.
Despite the modest price action, trading activity heated up; daily volume climbed 9% to IDR 349.49 trillion, supporting a total market capitalization of roughly IDR 4,031 trillion.
Read also: Bitcoin Slips to $67,000 as Long-Term Holders Stand Firm
Ascending Triangle Shows Recovery Effort, but Resistance is Still Strong
Ethereum price formed an ascending triangle pattern since early February. This pattern usually appears when buyers slowly push the price up, while sellers continue to defend the same resistance zone.
The rising trend line suggests buyers are stepping in faster every time there is a dip. However, the resistance areas around $2,000 and $2,120 remain successful in stopping any rebound attempts so far.
There were three fairly clear bounce attempts. On February 6, Ethereum’s price surged 23% but was held back and failed to break around $2,120. On February 12, the price rose 11% but again failed below resistance. Then on February 15, the price rallied 7% but eventually stagnated below $2,000 again. This means that while buyers are always back, they have not been able to make a convincing breakout.
One indicator that supports the recovery effort is the Chaikin Money Flow (CMF). CMF measures the buying and selling activity of large investors by combining price and volume data. If the CMF moves above zero, it indicates that buying pressure is more dominant than selling pressure.
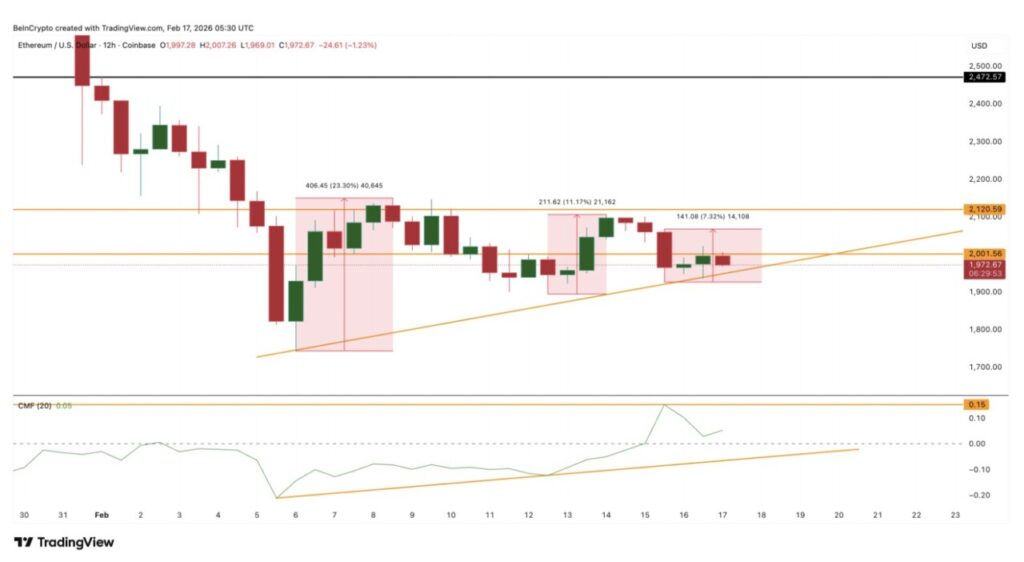
Ethereum’s CMF broke through the zero level on February 15 (during the third rebound) and is still in the positive area around 0.05. This indicates that large investors are starting to buy again. However, the buying power has been relatively limited so far.
This raises an important question: if buyers are returning, why does Ethereum price continue to fail to rise further? The answer will be clearer if we look at the movements of whales and long-term holders.
Whale and Long-Term Holder Sales Increase
During a period when the Ethereum price was trying to recover, large investors were seen reducing exposure. Wallets holding large amounts of ETH – often referred to as whales – decreased their holdings from 113.92 million ETH to 113.66 million ETH. That’s a reduction of about 260,000 ETH, equivalent to approximately $500 million.
Read also: 8 Crypto Presales in the Spotlight in February 2026, What Makes Them Stand Out?
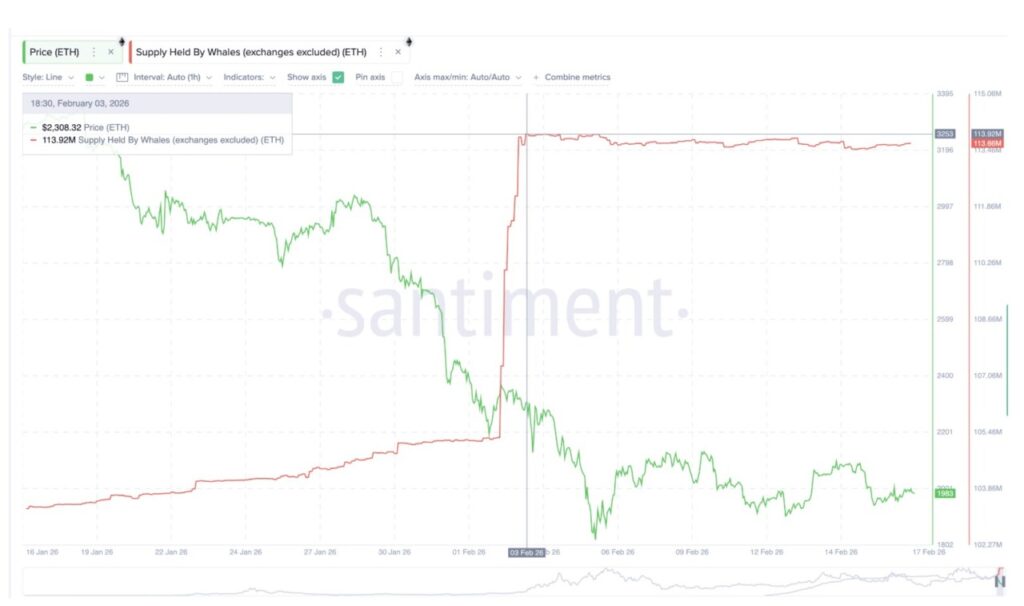
This finding suggests that whales are selling off as the recovery effort progresses, instead of helping to push prices up.
Another important indicator also corroborates the trend, the Hodler Net Position Change, which monitors whether long-term investors are adding assets or selling. When the number is negative, it means that long-term holders are distributing (selling).
On Ethereum, the Holder Net Position Change remained in the negative zone between February 3 and February 16 (rebound phase). In fact, selling pressure increased from -13,677 ETH to -18,411 ETH, an increase of about 34%.
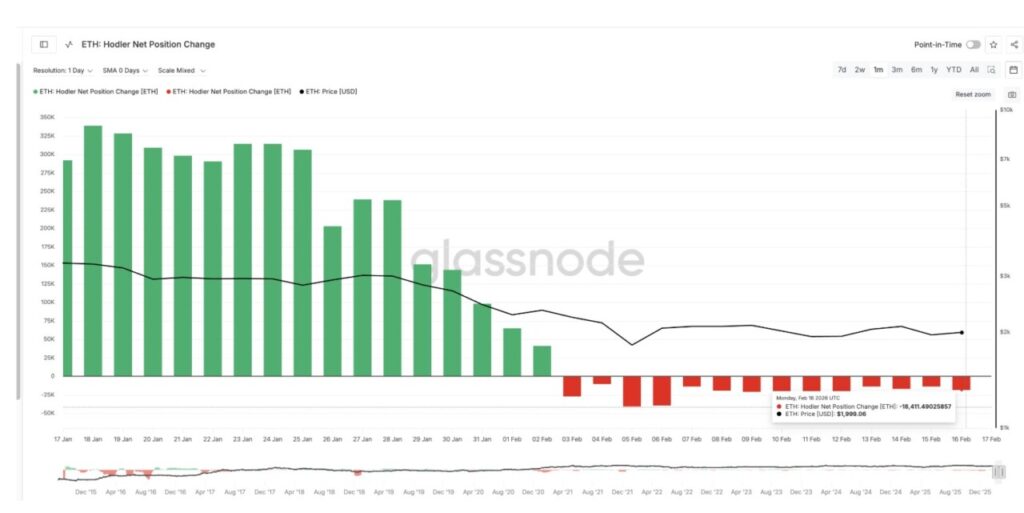
The timing of this is very important, as every rebound attempt happens exactly in the same period when the sell-off increases.
This is the reason why Ethereum price is finding it difficult to sustain a recovery. Despite new buyers coming in, whales and long-term holders are exiting positions. However, there are still other factors that make the $2,000 and $2,120 levels difficult to break.
Cost Basis Data Explains Why Ethereum Price Keeps Failing Around $2,000
The cost basis data shows at what level investors initially bought Ethereum. When the price returns to that area, this level often turns into resistance, as many people tend to sell when “turning capital”.
The largest cost basis cluster is currently in the range of $1,995-$2,015. More than 1.01 million ETH were bought in this range. As a result, there was strong selling pressure.
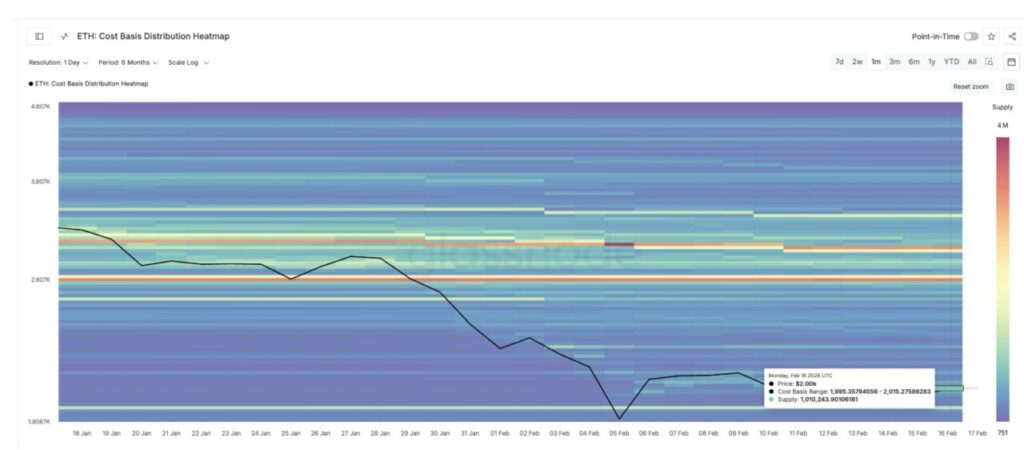
When the Ethereum price touched that area again, many investors chose to sell to secure their initial capital. This increased the supply in the market and made it difficult for the price to climb further. This pattern is consistent with the three previous failed rebounds.
Each rebound attempt stopped right near (or slightly above) the same cost basis zone. This confirms that for the recovery to be stronger, Ethereum price needs to break this level cleanly. For the time being, ETH is still stuck between support and resistance.
The immediate resistance levels are $2,000 (the most important right now) and $2,120, as discussed earlier. Using a more detailed technical projection, if Ethereum is able to break the $2,120-$2,140 zone, the next upside targets could be $2,210 and $2,300.
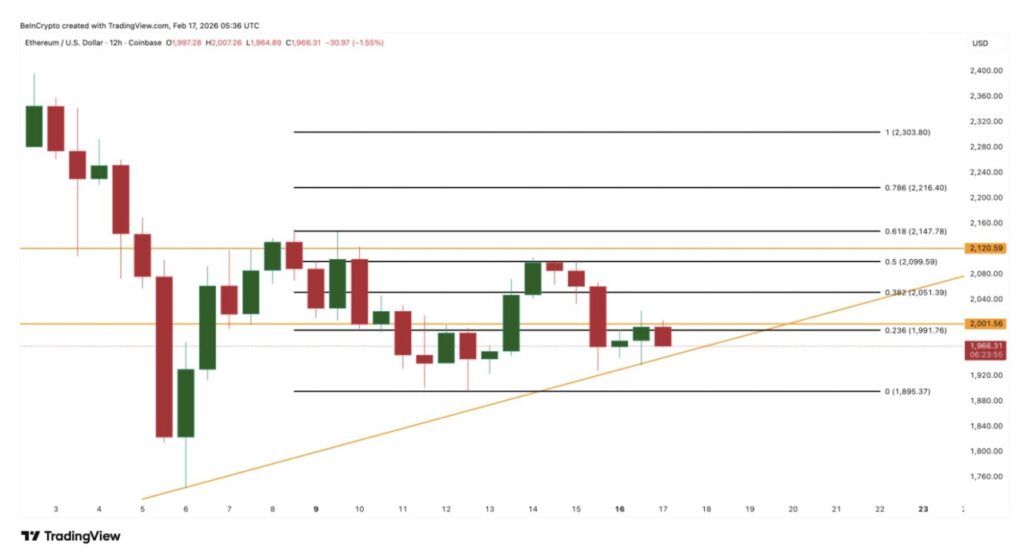
Conversely, if the price fails to break the resistance again, ETH’s movement could potentially go sideways for longer. Support is still around $1,895, and a drop below this level could derail the recovery attempt supported by the uptrend line.
The chart does show a recovery attempt, and the CMF confirms buyers are starting to return. However, the sell-off from whales, long-term holders, and strong resistance from the cost basis are still the main obstacles to the rally.
As such, Ethereum’s price projection now largely depends on whether buyers are able to absorb the selling pressure and eventually break the resistance.
Follow us on Google News to stay up to date with the latest in crypto and blockchain technology. Check Bitcoin price, usdt to idr and tokenized nvidia stock price through Pintu Market.
Enjoy an easy and secure crypto trading and crypto gold investment experience by downloading the Pintu crypto app via Play Store or App Store now. Also, experience web trading with advanced trading tools such as pro charting, various order types, and portfolio tracker only at Pintu Pro.
*Disclaimer
This content aims to enrich readers’ information. Pintu collects this information from various relevant sources and is not influenced by outside parties. Note that an asset’s past performance does not determine its projected future performance. Crypto trading activities are subject to high risk and volatility, always do your own research and use cold hard cash before investing. All activities of buying and selling Bitcoin and other crypto asset investments are the responsibility of the reader.
Reference:
- BeInCrypto. Ethereum Price Attempts 3 Rebounds in 10 Days – Charts Explain Why Each Failed. Accessed on February 18, 2026


