Ethereum Navigates a Storm as a Sharp 5% Correction Collides with a Retreat in Staking Activity

Jakarta, Pintu News – Ethereum price movements have been lacking conviction lately. The price was observed to move rather flatly over the weekend and still recorded a decline of more than 5% in the last seven days.
Nevertheless, a small recovery attempt is underway. Since February 19, Ethereum has bounced around 4.5%, driven by a bullish divergence on the daily chart.
This signal usually indicates that selling pressure is starting to weaken. But at the same time, the sharp decline in staking demand raises new questions: Is the return of liquidity to the market quietly building pressure that could hinder this recovery?
Ethereum Price Drops 5.78% in 24 Hours
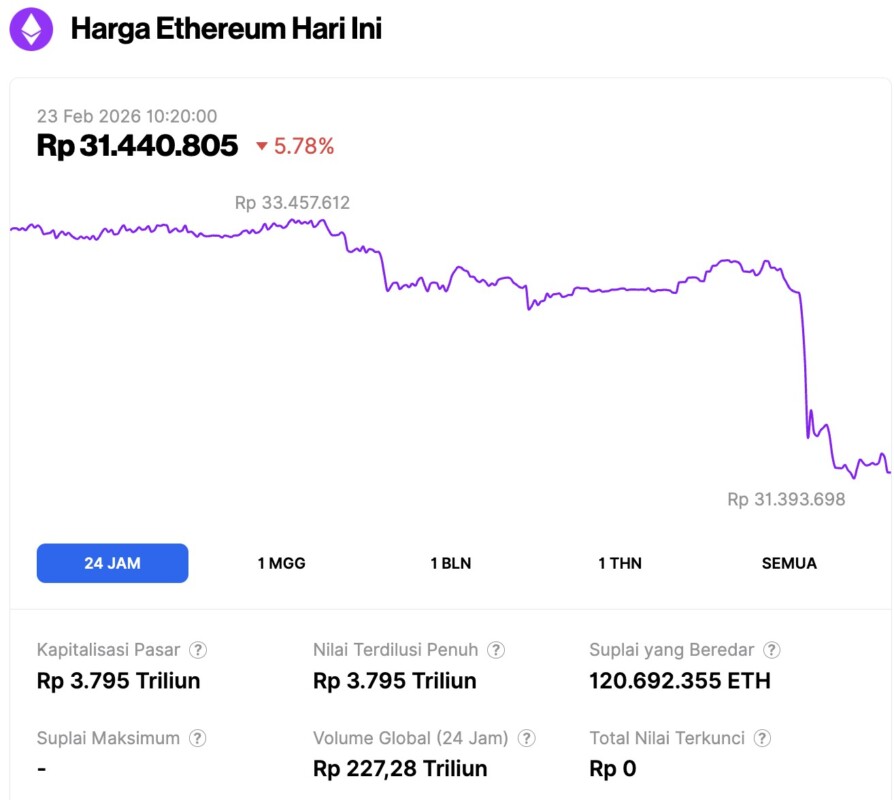
Ethereum faced a sharp correction on February 23, 2026, with its price sliding 5.78% over the last 24 hours to reach $1,858—approximately IDR 31,440,805. The second-largest cryptocurrency navigated a volatile session, swinging from an intraday high of IDR 33,457,612 to a low of IDR 31,393,698.
Despite the downward price pressure, market activity intensified as trading volume surged 17% to IDR 227.28 trillion. As of today, Ethereum’s total market capitalization holds at roughly IDR 3,795 trillion.
Read also: Bitcoin’s Slide to $64,000 Signals a Deeper Descent into Stage 4 of the Bear Market
Bullish Divergence Emerges, but Declining Staking Demand Risks Restoring Supply to the Market
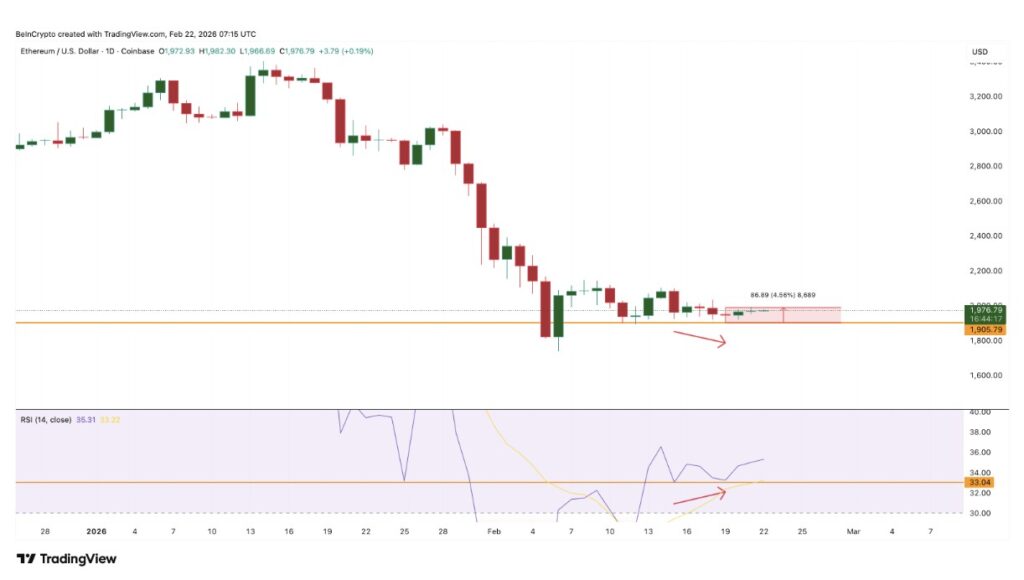
Ethereum’s latest recovery began after a bullish divergence pattern formed between February 15th and 19th. Bullish divergence occurs when the price prints alower low, while the Relative Strength Index (RSI) indicator shows ahigher low. The RSI itself is a momentum indicator that measures the strength between selling pressure and buying pressure.
When the RSI improves at a time when prices are falling, it is often a signal that the sellers’ strength is starting to run out, allowing the start of a recovery phase. This is the reason why Ethereum managed to bounce back from its low around $1,740 on February 6 and crawled back up to $1,970 on February 22.
However, while the technical charts are showing signs of recovery, Ethereum staking data compiled exclusively by BeInCrypto analysts has started to show the opposite trend.
Staking means locking ETH in the network to help secure Ethereum and earn rewards. When ETH is staked, it reduces theliquid supply as the coins cannot be sold easily. Conversely, when staking demand drops, that supply can return to the market and increase the risk of selling pressure.
The data shows that Ethereum’s 6-month cumulative net staking deposit fell sharply from 1,994,282 ETH on January 13 to just 1,008,012 ETH on February 22. This represents a drop of about 986,000 ETH, or almost 50%.
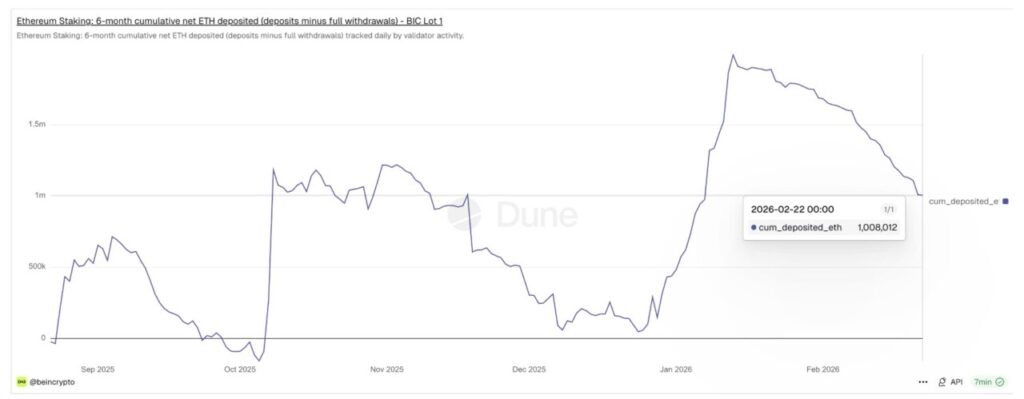
This sharp decline means that much less ETH is being absorbed into the staking mechanism, leaving more ETH liquid or available in the market. This creates a direct conflict: on one hand the bullish divergence hints at a recovery, but on the other hand the drop in staking demand suggests that liquidity is flooding back into the market.
Now, the key question becomes clear: Where does this flow of ETH back into the market go?
Exchange Balances and Whale Sales Show Liquidity is on the Move
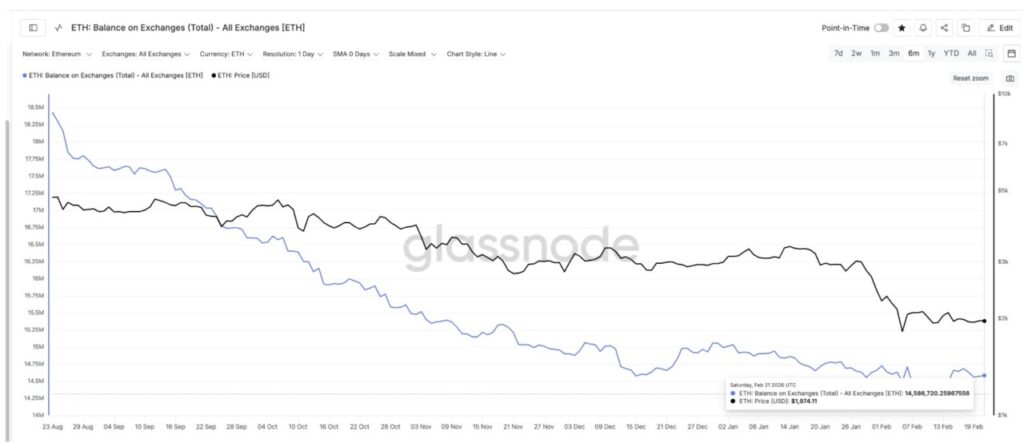
Exchange balance data provides the first crucial clue. Ethereum’s balance on various exchanges recently jumped from 14,241,203 ETH to 14,586,720 ETH. This represents an increase of approximately 345,500 ETH, or roughly 2.4%, in a relatively short period of time.
The exchange balance measures the volume of ETH available on the trading platform. When this number increases, it usually signals that more ETH is available for sale. The current level is particularly noteworthy because it matches the level last seen on February 4.
At the time, Ethereum’s price fell sharply from $2,140 to $1,820 in just one day-a drop of almost 15%. This shows how quickly an increase in supply on exchanges can turn into massive selling pressure.
Read also: These 3 Altcoins Have the Potential for a Strong Rebound After February 2026, How Come?
This momentum is also very much in line with the decline in staking activity, confirming that the reduced staking demand is directly contributing to the increase in liquid supply in the market.
The behavior of ETH whales (large investors) further reinforces this trend. Since February 19, the whales ‘ total holdings have dropped from 113.65 million ETH to 113.42 million ETH. This means that these large investors have sold around 230,000 ETH in just three days. Interestingly, this sell-off happened just as Ethereum was attempting torebound.
This indicates that instead of supporting price recovery, large holders are likely to utilize existing or increased liquidity to reduce their positions.
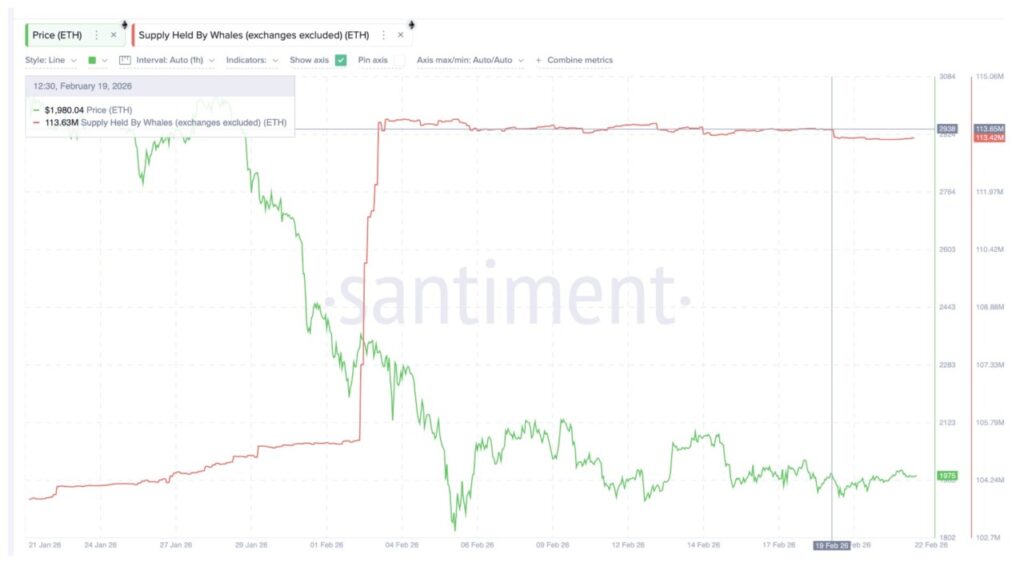
The combination of rising exchange balances and whale selling suggests that liquidity is not just returning to the market, but has started to create resistance to price increases.
Cost Basis Cluster Shows Why Ethereum Price Recovery Faces Immediate Resistance
On-chain cost basis data now sheds light on where the resistance is likely to appear. The cost basis represents the price level at which investors previously purchased their ETH.
When the price returns to these levels, many asset holders tend to try to sell atbreakeven, which then creates resistance unless there is a compelling reason to continue holding the asset.
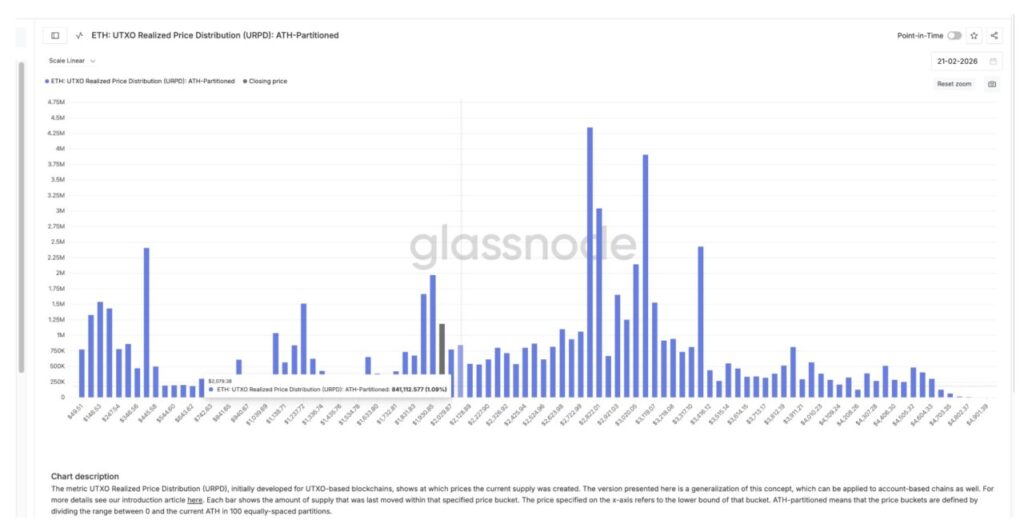
This data comes from the UTXO Realized Price Distribution, or URPD. Although Ethereum uses anaccount-based system, this metric has been adapted to estimate Ethereum’s supply distribution.
The data shows that more than 2% of Ethereum’s supply is concentrated between $2,020 and $2,070. These levels are also very much in line with the resistance points on the Ethereum price chart. This creates a critical test for the market.
Read also: Arkham Guide: 6 Smart Ways to Turn Losses into Profits during Crypto Bear Market
If Ethereum’s recovery continues, the price should be able to break above $2,050 first before testing the $2,140 level. A stronger move could take the price towards $2,300.
However, due to the concentration of supply near $2,020 and $2,070, many asset holders may go short when ETH approaches these levels. This makes the $2,050 zone the most crucial region in the short term.
Given the declining demand for staking and the whales that have started selling, attempts to absorb this supply (if it is actually released when prices hit key levels) will be difficult in the absence of strong new demand.
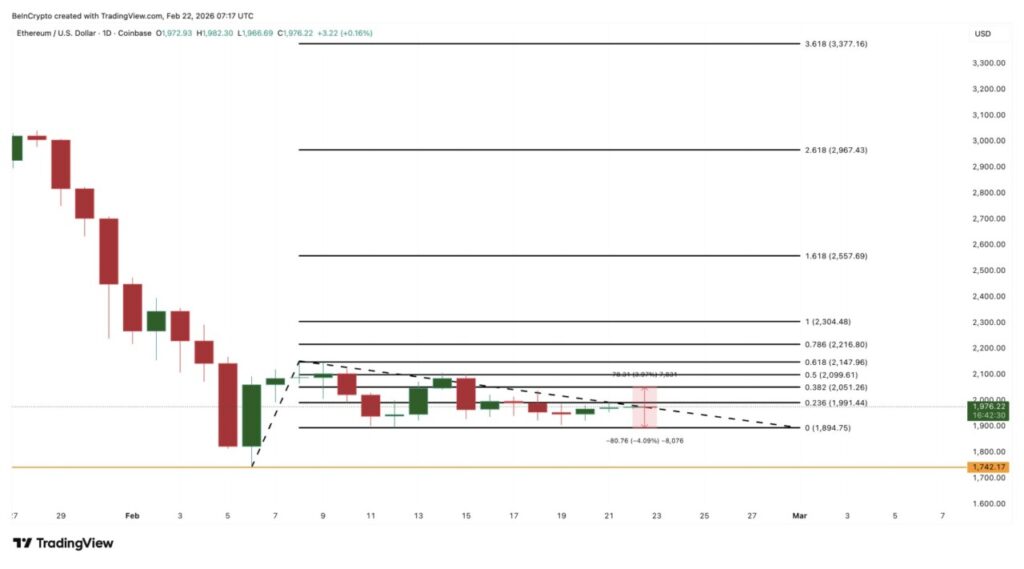
On the downside, the key support level is at $1,890, which lies about 4% below the current price. If this support fails to hold, Ethereum risks falling back towards the February lows around $1,740.
This situation puts Ethereum in a risky position. Although the bullish divergence pattern has opened up opportunities for recovery, factors such as a decrease in staking demand, an increase in exchange balances, a sell-off by whales, and strong cost-basis resistance suggest that the flow of liquidity back into the market will be the main determinant of further movement.
Follow us on Google News to stay up to date with the latest in crypto and blockchain technology. Check Bitcoin price, usdt to idr and tokenized nvidia stock price through Pintu Market.
Enjoy an easy and secure crypto trading and crypto gold investment experience by downloading the Pintu crypto app via Play Store or App Store now. Also, experience web trading with advanced trading tools such as pro charting, various order types, and portfolio tracker only at Pintu Pro.
*Disclaimer
This content aims to enrich readers’ information. Pintu collects this information from various relevant sources and is not influenced by outside parties. Note that an asset’s past performance does not determine its projected future performance. Crypto trading activities are subject to high risk and volatility, always do your own research and use cold hard cash before investing. All activities of buying and selling Bitcoin and other crypto asset investments are the responsibility of the reader.
Reference:
- BeInCrypto. Ethereum Staking Demand Falls 50% – ETH Price in More Trouble? Accessed on February 23, 2026