Dogecoin Rallies 3% Today, but a Drop Below $0.087 Could Trigger a Sharp Sell-Off

Jakarta, Pintu News – Dogecoin briefly traded at $0.09339 on March 2, 2026, according to a Coinpaper report, the room for further movement is narrow. The bullish side needs about 20% upside to reach the resistance area at $0.110.
Meanwhile, the bearish side only needs a relatively small drop to break and collapse the support level that is holding. Technical signals are increasingly showing a tendency towards the downside.
The structure is quite clear. If the price manages to break above $0.110, then a reversal to a bullish trend can be considered confirmed. Conversely, if the price drops below $0.087, the broader downtrend could potentially resume. The gap between these two scenarios is thin, and chart-wise, the lower level seems more vulnerable to break.
Dogecoin price rises 3.62% in 24 hours
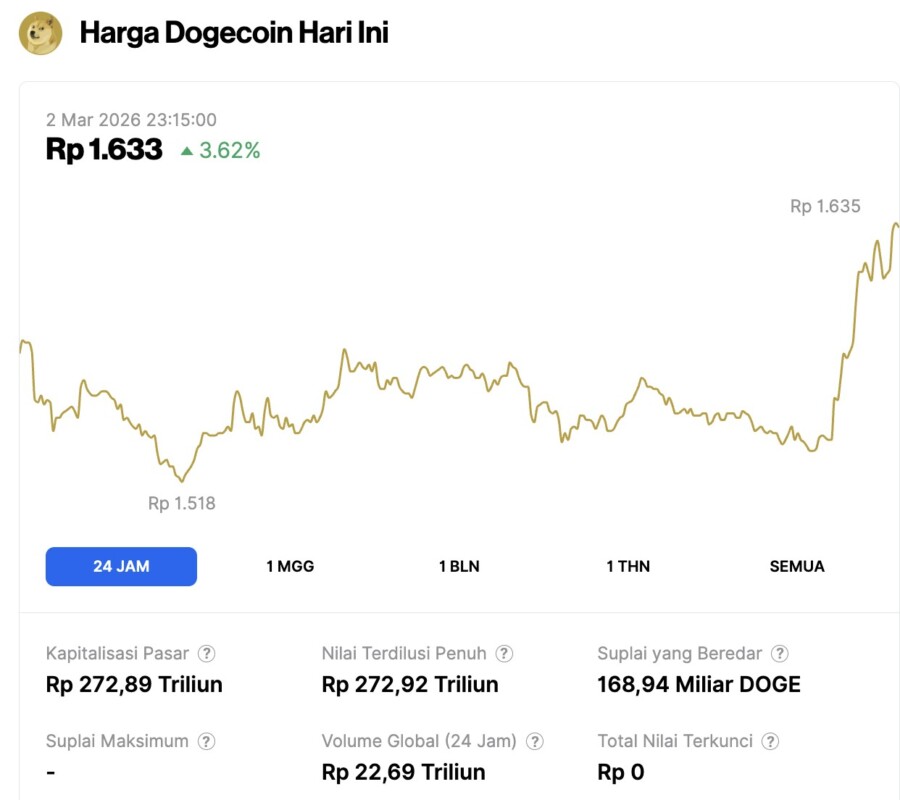
On March 2, 2026, Dogecoin rose 3.62% over the past 24 hours to trade at $0.09686, or roughly IDR 1,633. During the same period, DOGE moved within a 24-hour range of IDR 1,518 to IDR 1,635.
At the time of writing, Dogecoin’s market capitalization is around IDR 272.89 trillion, while its 24-hour trading volume is approximately IDR 22.69 trillion.
Read also: Pi Network Price Prediction March 2026: Network Upgrade, KYC Acceleration, & Reward Distribution
Hidden Bearish Divergence Weakens Recovery Argument
Between December 22, 2025 and February 25, 2026, a clear pattern emerged on the DOGE chart. The price formed lower highs. However, during the same period, the Relative Strength Index (RSI) recorded higher highs. This unsynchronization is known as a hidden bearish divergence.
A rising RSI often gives the impression that momentum is building. However, the more correct interpretation is the opposite: buyers have to exert greater effort, but still fail to push the price through higher levels. This means that the underlying strength of the market is weakening, not improving.
This pattern is very relevant for the $0.110 target. A rise of about 20% requires consistent and sustained buying pressure. Hidden bearish divergence indicates that buying pressure is decreasing. Any upside attempt is likely to be met with a steady supply of sellers.
As such, the $0.110 resistance zone is not just a technical limit. This level serves as a point where deteriorating momentum makes the chances of a breakout structurally low, unless there is an external catalyst strong enough to change the balance of supply and demand.
Increase in the Profit Portion of Supply Creates a Multilevel Selling Problem
On March 1, 2026, approximately 44.79% of Dogecoin’s circulating supply was in profit. On March 2, the figure rose to 45.6%. This increase seems small, but the consequences are important.
Read also: 3 Must-Watch Token Unlocks in the Week Beginning March 2026
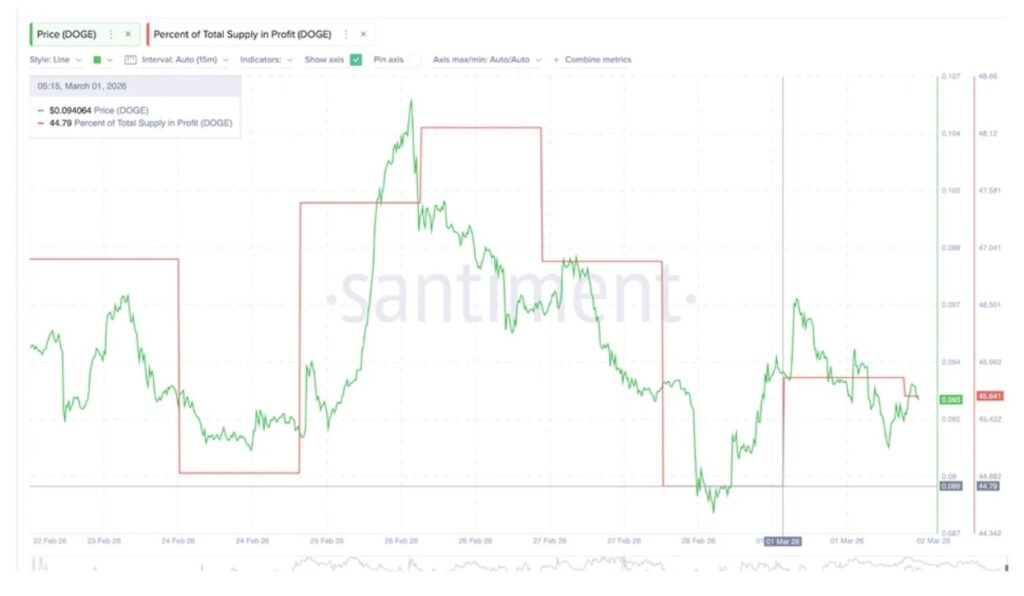
When the share of supply that is profitable increases amidst a still fragile price phase, it suggests that new buyers accumulated at lower levels during the February decline. Those holders are now in profit positions.
In a coin meme market dominated by short-term players, positions are often closed immediately when uncertainty signals appear. They do not need large profits to start selling.
This dynamic builds layered resistance along the recovery path. At $0.10, more holders turned into profits. At $0.105, the number grows again. Every small increase could trigger a new wave of sellers, as more market participants see profit-taking opportunities.
Consequently, the rally is not just about breaking $0.110. It should also be able to absorb selling pressure spread across each stage towards that level, rather than facing one single obstacle at the end.
Meme coins are relatively more susceptible to this kind of cascading resistance. Unlike utility-driven assets, DOGE is less likely to attract a long-term holder base with strong fundamental conviction.
The main attraction is momentum. Momentum-oriented players generally take small, quick profits, and it is this pattern of behavior that shapes many price movements.
Follow us on Google News to stay up to date with the latest in crypto and blockchain technology. Check Bitcoin price, usdt to idr and tokenized nvidia stock price through Pintu Market.
Enjoy an easy and secure crypto trading and crypto gold investment experience by downloading the Pintu crypto app via Play Store or App Store now. Also, experience web trading with advanced trading tools such as pro charting, various order types, and portfolio tracker only at Pintu Pro.
*Disclaimer
This content aims to enrich readers’ information. Pintu collects this information from various relevant sources and is not influenced by outside parties. Note that an asset’s past performance does not determine its projected future performance. Crypto trading activities are subject to high risk and volatility, always do your own research and use cold hard cash before investing. All activities of buying and selling Bitcoin and other crypto asset investments are the responsibility of the reader.
Reference:
- Coinpaper. DOGE Price Prediction: Dogecoin Risks Major Breakdown Below $0.087. Accessed on March 2, 2026