Dogecoin Jumps 7% Today, Signaling a Possible Bullish Expansion

Jakarta, Pintu News – Dogecoin was briefly trading at $0.09857, up about 8.6% earlier today (5/3). Previously, the price moved flat around the $0.0900 level, before buying interest increased sharply.
The consistent bullish impulse then pushed DOGE through $0.095, indicating the market momentum is starting to improve. This latest rise reflects the growing buying pressure as the price approaches the $0.100 resistance area. If the momentum continues, Dogecoin could potentially attempt to break through this important psychological level.
Then, how is the current Dogecoin price movement?
Dogecoin Price Rises 7.89% in 24 Hours
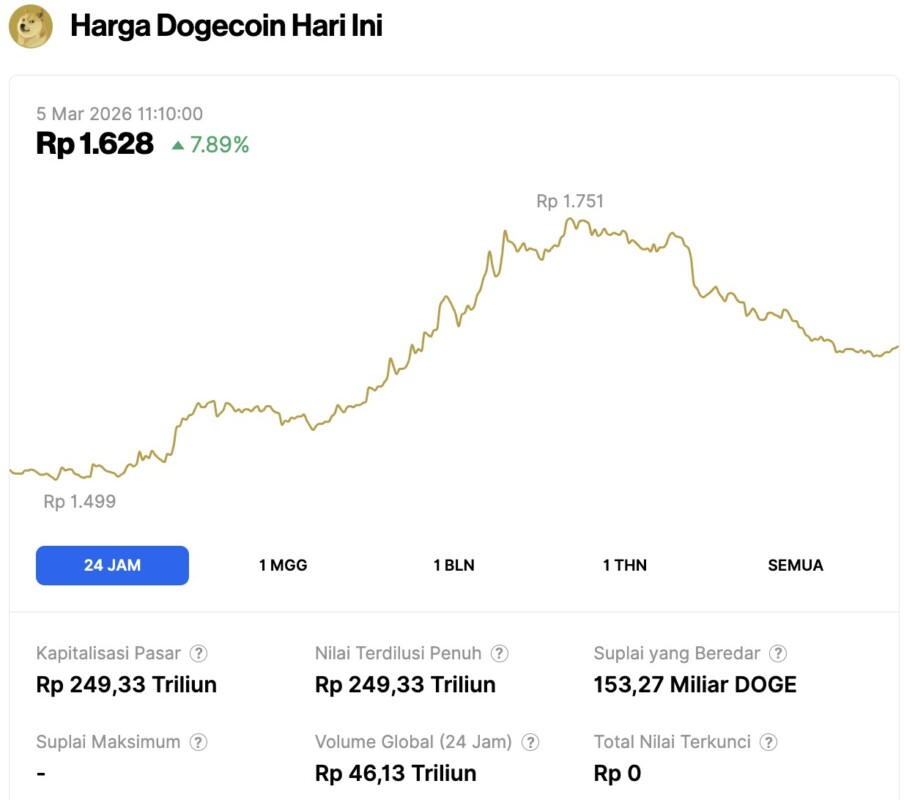
On March 5, 2026, Dogecoin posted a 7.89% gain over the past 24 hours, trading at $0.09689, or about IDR 1,628. During the same period, DOGE moved within a daily range of IDR 1,499 to IDR 1,751.
At the time of writing, Dogecoin’s market capitalization is approximately IDR 249.33 trillion, while its 24-hour trading volume is around IDR 46.13 trillion.
Read also: Ethereum Price Surges 7% Today Smart DCA Signals and ETH Patterns Drive Market Optimism!
Dogecoin Price Approaches $0.096 Key Breakout Level
According to analyst Kamran Asghar, Dogecoin has been moving in a fairly clear descending channel pattern for several weeks. The price movement formed a lower high and lower low, with the upper trendline holding the rally around $0.100 to $0.104, while the lower boundary held the decline in the range of $0.088 to $0.090.
Currently, DOGE is pushing up again and is trading around $0.0959 after briefly touching $0.0962, an important resistance area within the channel.
A decisive break above $0.096 could potentially change the direction of momentum. Kamran Asghar thinks that this level could turn into a new support. If buyers are able to hold $0.096, the next target is near $0.100, and if the push gets stronger, the price has a chance to test $0.104 which is the previous lower high.
Conversely, if DOGE fails to hold above $0.096, the price could correct back towards $0.092 or even $0.088. Therefore, the price response at the $0.096 level will be an important determinant for further movement.
Dogecoin Monthly Breakdown Pattern Indicates Potential Bullish Expansion
According to Tardigrade Trader analysts, Dogecoin’s monthly chart shows a recurring breakdown pattern that in its next phase often triggers a strong bullish movement. Each breakdown usually comes after a long period of consolidation near the support area.
Read also: Shiba Inu Price Prediction: Will SHIB Rise or Fall in 2026?
The price briefly dropped through the lower boundary of the range, but then quickly recovered. Such a pattern is often interpreted as a bear trap, when the selling pressure loses control and the momentum switches back to the buyers’ side.
The latest monthly structure shows the appearance of a similar breakdown. The price briefly moved below the support before bouncing sharply. This behavior is more indicative of accumulation, rather than a truly solid weakening. In previous cycles, similar breakdown patterns were followed by large aggressive rallies.
If that historical scenario repeats itself, Dogecoin could potentially be preparing to enter its next phase of upward expansion.
Follow us on Google News to stay up to date with the latest in crypto and blockchain technology. Check Bitcoin price, usdt to idr and tokenized nvidia stock price through Pintu Market.
Enjoy an easy and secure crypto trading and crypto gold investment experience by downloading the Pintu crypto app via Play Store or App Store now. Also, experience web trading with advanced trading tools such as pro charting, various order types, and portfolio tracker only at Pintu Pro.
*Disclaimer
This content aims to enrich readers’ information. Pintu collects this information from various relevant sources and is not influenced by outside parties. Note that an asset’s past performance does not determine its projected future performance. Crypto trading activities are subject to high risk and volatility, always do your own research and use cold hard cash before investing. All activities of buying and selling Bitcoin and other crypto asset investments are the responsibility of the reader.
Reference:
- Coinpaper. Dogecoin Price Prediction: Bulls Target $0.100 as Breakout and Monthly Pattern Align. Accessed on March 5, 2026


