3 Frequent Bitcoin Price Bottom Levels

Jakarta, Pintu News – Bitcoin price is back on the radar of crypto investors after on-chain indicators showed an interesting historical pattern. In previous cycles, Bitcoin often formed a price bottom within a certain range based on the MVRV ratio. The latest data shows that the pattern is still relevant to understand the potential movement of the world’s largest cryptocurrency.
This indicator helps investors see whether the market is in profit or loss in aggregate. By understanding these important price areas, you can get a clearer picture of potential accumulation phases in the crypto market.
1. Understanding the MVRV Indicator in the Crypto Market
MVRV (Market Value to Realized Value) is an on-chain indicator that compares the market capitalization of Bitcoin (BTC) to the realized value of all coins in circulation. In simple terms, this indicator shows whether the majority of cryptocurrency investors are in a position of profit or loss.
If the MVRV value is above 1, it means that most Bitcoin holders are in a state of unrealized gains. Conversely, when the indicator is below 1, many investors have incurred losses and so selling pressure usually begins to ease.
In crypto market analysis, this is often a sign that prices are approaching a bottom. Because of this, the indicator is often used by analysts to identify potential accumulation phases.
Also Read: Czech Central Bank seeks 100 tons of gold reserves, Bitcoin (BTC) is still under consideration
2. Bitcoin’s Bottom Zone Over the Last 10 Years
Based on analysis of historical cryptocurrency data, Bitcoin tends to form price lows when the MVRV is between 1.0 to 0.8 levels. This pattern has appeared repeatedly in several market cycles for more than a decade.
Currently, the price range corresponding to the zone is at several important levels:
- The MVRV 1.0 level is around $54,000 or around Rp913,626,000
- The MVRV 0.8 level is at around $43,000 or around Rp727,517,000.
Such price zones are often considered as areas where selling pressure begins to weaken. When most crypto investors incur losses, selling activity usually diminishes, opening up opportunities for trend reversals.
However, it is important to remember that this indicator only provides a probability picture based on historical data, not a guarantee that cryptocurrency prices will always follow the same pattern.
3. Bitcoin Price Currently Still Above the Bottom Zone
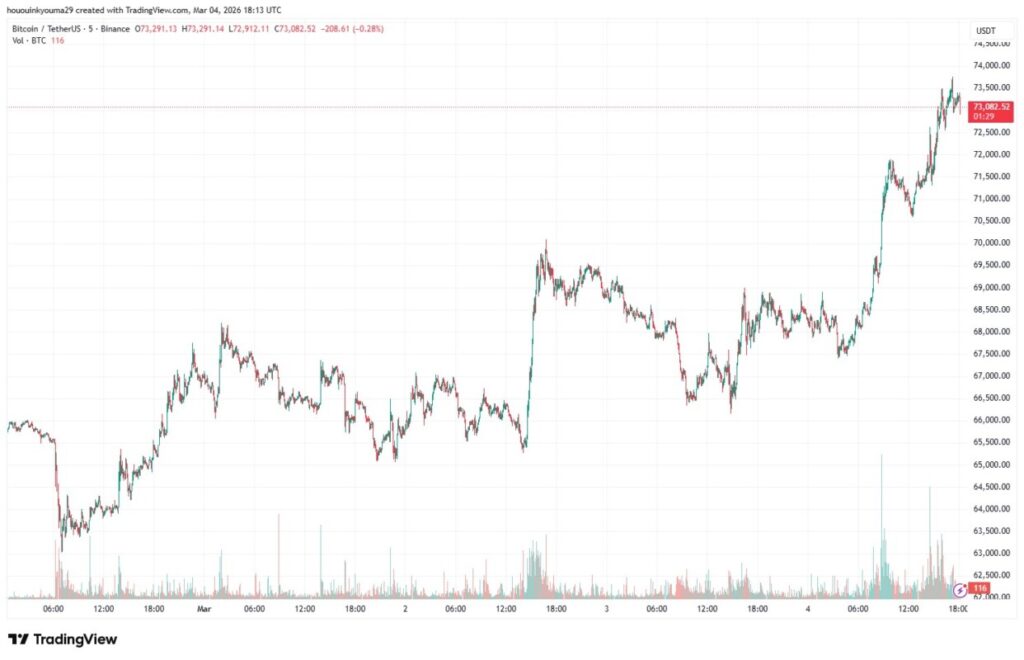
At the time of this analysis, Bitcoin (BTC) is trading at around $73,000 or about Rp1,235,087,000. In the past week, the price of this cryptocurrency has even recorded an increase of more than 6 percent.
Interestingly, despite the correction, Bitcoin’s MVRV value is still above the 1.0 level. This means that overall, investors are still holding unrealized gains.
This suggests that the crypto market hasn’t fully entered the extreme selling pressure phase that usually comes ahead of the bottom. In other words, there is a possibility that Bitcoin price can still move above the zone.
4. Profit Taking Levels to Watch Out For
In addition to bottom zones, the MVRV indicator also shows areas where potential profit-taking starts to increase. When the price of Bitcoin rises too far above the realized value, investors tend to start selling their assets to lock in profits.
Some important levels that are often associated with the risk of profit taking include:
- Band MVRV 2.4 at around $130,000 or around Rp2,199,470,000
- Band MVRV 3.2 at around $174,000 or around Rp2,943,906,000
When cryptocurrency prices approach this area, selling pressure usually increases as many investors have made large profits. This often leads the market to enter a correction phase after a period of strong gains.
But in the current cycle, Bitcoin has never even touched the 3.2 level. This suggests that the current crypto cycle pattern has slightly different dynamics compared to previous periods.
Conclusion
The MVRV indicator has become one of the most important tools in the on-chain analysis of cryptocurrencies as it is able to provide an overview of the overall profit conditions of investors. For more than a decade, Bitcoin (BTC) often forms price lows when this indicator is between the 1.0 and 0.8 levels.
Currently, the zone is in the range of Rp913 million to Rp727 million. However, Bitcoin prices are still trading well above these levels so the market is yet to show the classic signs of a bottom phase.
For crypto investors, understanding indicators like MVRV can help read market cycles more objectively. But like all indicators in the cryptocurrency world, investment decisions still require additional analysis and sound risk management.
Also Read: The Might of the US Dollar: De-Dollarization Fails, Other World Currencies are Out!
Follow us on Google News to stay up to date with the latest in crypto and blockchain technology. Check Bitcoin price, usdt to idr and tokenized nvidia stock price via Pintu Market.
Enjoy an easy and secure crypto trading and crypto gold investment experience by downloading the Pintu crypto app via Play Store or App Store now. Also, experience web trading with advanced trading tools such as pro charting, various order types, and portfolio tracker only at Pintu Pro.
*Disclaimer
This content aims to enrich readers’ information. Pintu collects this information from various relevant sources and is not influenced by outside parties. Note that an asset’s past performance does not determine its projected future performance. Trading crypto carries high risk and volatility, always do your own research and use cold hard cash beforeinvesting. All activities of buying and selling Bitcoin (BTC) and other crypto asset investments are the responsibility of the reader.
Reference
- Keshav Verma/NewsBTC. Bitcoin Historically Bottoms Between These MVRV Levels-Where Are They Now? Accessed March 6, 2026.