Ethereum Holds Above $2,000 Today—What Could Drive ETH’s Next Move?

Jakarta, Pintu News – The Ethereum price recovered and is back above $2,000 despite the negative war-related news. At one point, the price touched $2,200, the highest level since February 5. However, this rise may not have been enough to ensure a trend reversal. The latest Ethereum trading data explains why risks still remain high throughout March.
Then, how will Ethereum price move today?
Ethereum Price Drops 0.92% in 24 Hours
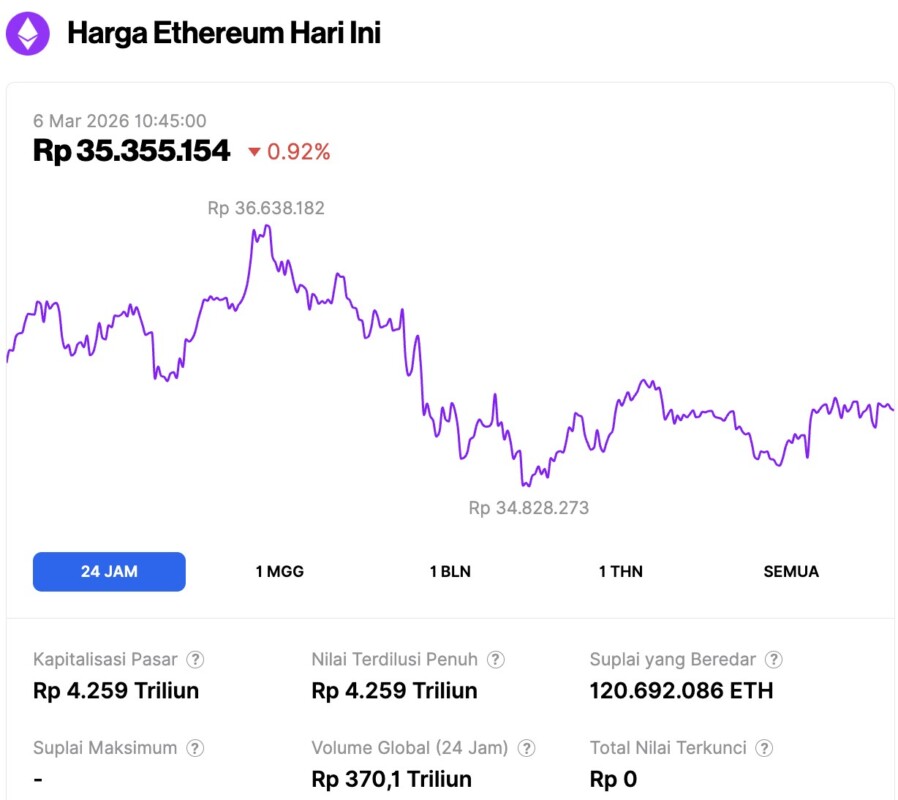
On March 6, 2026, Ethereum was trading at around $2,082, equivalent to roughly IDR 35,355,154, after a 0.92% decline over the past 24 hours. Within that window, ETH dipped to a low of IDR 34,828,273 and climbed to a high of IDR 36,638,182.
At the time of writing, Ethereum’s market capitalization stood at approximately IDR 4,259 trillion. Daily trading volume fell 34% over the last 24 hours to about IDR 370.1 trillion.
Read also: Bitcoin Slips to $71,000 Today as Markets Watch for Trump’s CLARITY Act Signature
Ethereum Still Volatile in a Narrow Range
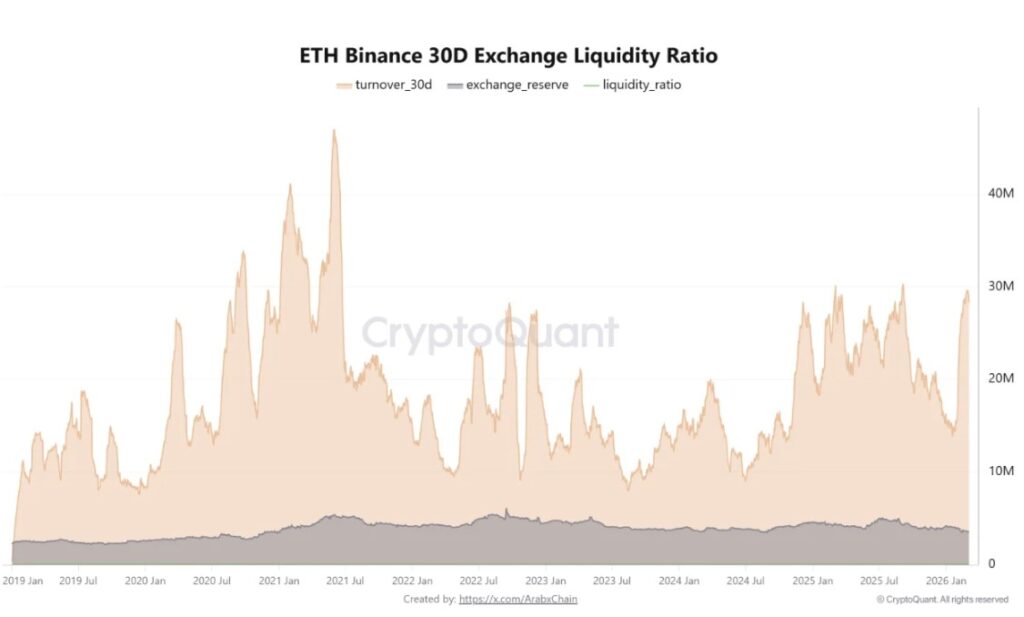
Based on CryptoQuant data, ETH trading volume on Binance over the past 30 days reached around 29.6 million ETH, the highest since September last year.
At the same time, the supply of ETH stored on Binance is only about 3.5 million ETH. Recent data also shows that the supply of ETH on exchanges has fallen sharply. Throughout February 2026, more than 31.6 million ETH was recorded as being withdrawn from exchanges, the largest outflow since November the previous year.
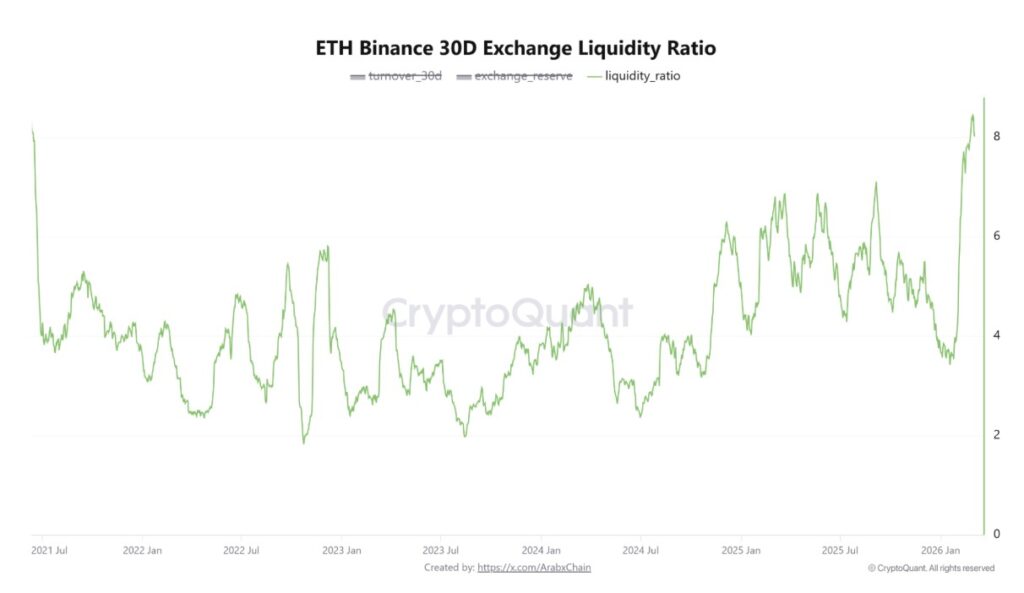
This pushed the Liquidity Ratio up to around 8.47. This metric is generally calculated by dividing the trading volume in a given period by the actual supply available on the exchange, thus illustrating how intensely the existing ETH supply is “used” in transaction activity.
The 8.47 level indicates that the same amount of ETH is traded repeatedly in a short period of time. This means that market participants tend to rotate the same liquidity, rather than making one-way transactions driven by new supply flows.
Analyst’s Outlook for Ethereum Price Going Forward
CryptoQuant analyst Arab Chain explained that the pattern reflects very aggressive trading activity and is mainly influenced by speculation. He believes that traders could have executed short-term orders, employed scalping strategies, or utilized ETH as collateral in derivatives markets such as futures and perpetuals.
Read also: 3 Meme Coins that are in the Spotlight in Early March 2026, Potential to Soar?
This kind of strategy can boost trading volumes even if it is not accompanied by a significant increase in real supply.
Arab Chain added that such patterns often appear when price volatility increases or when the market enters a repositioning phase among investors. Historically, periods of high Liquidity Ratio have also often coincided with strong price volatility, improved market liquidity and increased investor risk appetite.
Consequently, the dominance of short-term trading sentiment and the hunt for quick profits in derivatives can create conditions that trigger a wave of liquidation.
While many analysts remain optimistic after ETH broke $2,000, market analyst IncomeSharks thinks it’s too early for the bullish side to celebrate. Based on the daily chart of ETH/USD that he shared, ETH is still moving below the SuperTrend line around $2,230, which currently serves as a strong resistance.
He emphasized that a single daily candle that looks positive is not meaningful if it is not followed by a continuation of the movement. According to him, a more convincing confirmation is when prices are able to close above the SuperTrend or show consistent upward follow-through.
This series of signals indicates that excessive optimism regarding Ethereum’s March trend reversal could be detrimental to investors. Referring to BeInCrypto’s latest analysis, Ethereum needs to close above $2,140 to completely break out of the sideways phase that lasted since the beginning of last month. Otherwise, the price risks dropping to lower levels.
Follow us on Google News to stay up to date with the latest in crypto and blockchain technology. Check Bitcoin price, usdt to idr and tokenized nvidia stock price via Pintu Market.
Enjoy an easy and secure crypto trading and crypto gold investment experience by downloading the Pintu crypto app via Play Store or App Store now. Also, experience web trading with advanced trading tools such as pro charting, various order types, and portfolio tracker only at Pintu Pro.
*Disclaimer
This content aims to enrich readers’ information. Pintu collects this information from various relevant sources and is not influenced by outside parties. Note that an asset’s past performance does not determine its projected future performance. Crypto trading activities are subject to high risk and volatility, always do your own research and use cold hard cash before investing. All activities of buying and selling Bitcoin and other crypto asset investments are the responsibility of the reader.
Reference:
- BeInCrypto. Has Ethereum Begun a Reversal in March? Accessed on March 6, 2026


