Ethereum Hits $2,000 Today as Whales Step Up ETH Accumulation

Jakarta, Pintu News – Ethereum price trends are back in the spotlight after the latest on-chain data showed a significant surge in long-term accumulation. Meanwhile, technical chart analysis indicates resistance pressure in the short term.
Overall, these findings illustrate a market condition where large holders continue to add to ETH holdings, even though the price still struggles when approaching key trading levels. So, how will Ethereum price move today?
Ethereum Price Up 2.55% in 24 Hours
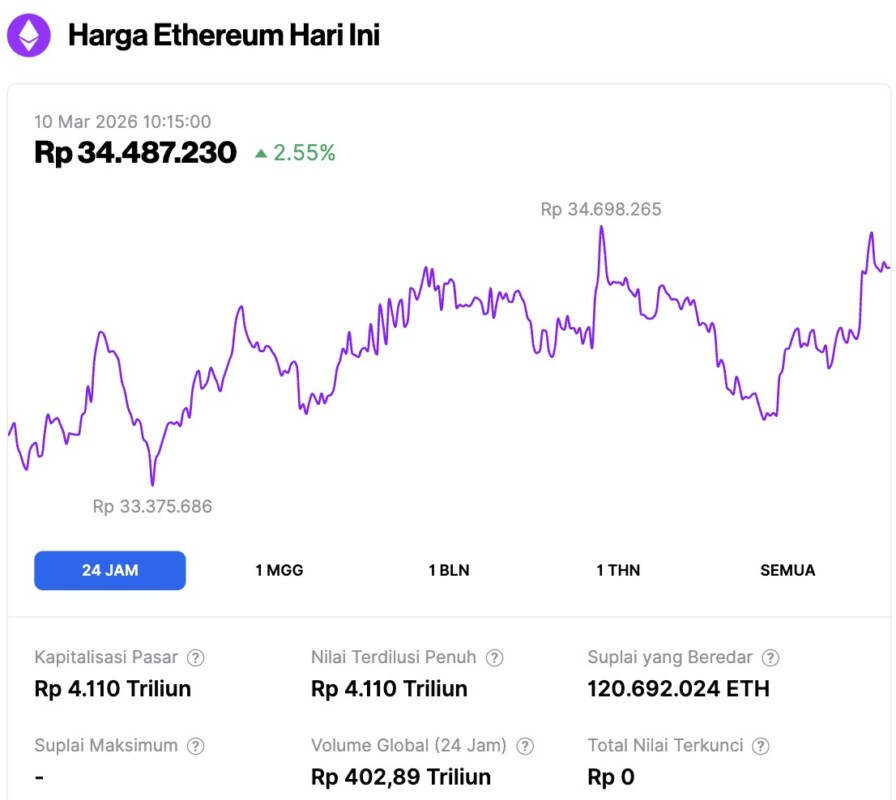
On March 10, 2026, Ethereum was trading at roughly $2,042, or about IDR 34,487,230, up 2.55% over the past 24 hours. Within that window, ETH dipped to a low of IDR 33,375,686 and climbed to a high of IDR 34,698,265.
At the time of writing, Ethereum’s market capitalization was approximately IDR 4,110 trillion. Meanwhile, its 24-hour trading volume jumped 32% to IDR 402.89 trillion.
Ethereum Accumulation Address Surges as Whale Holdings Rise Sharply
Ethereum accumulation wallets grew rapidly in recent months, based on on-chain data shared by CryptoQuant and later highlighted by market analyst James Easton via X.
The chart titled “ETH: Balance on Accumulation Addresses” shows a sharp rise in the total ETH held by long-term accumulation wallets. Typically, these addresses are associated with entities that regularly add to positions and rarely move funds to exchanges.
The data shows that the balance at the accumulation address increased slowly from 2018 to 2023. However, the rate of increase strengthened significantly throughout 2025 to early 2026. The total ETH stored in these addresses increased from less than 10 million coins to more than 24 million coins.
Over the same period, Ethereum’s price did go through several cycles, but the increase was not as fast as the growth of the accumulation curve. This difference in direction indicates that large holders were increasing their holdings, while the price remained volatile in the broader market.
James Easton thinks that accumulation by whales has recently moved “vertically,” referring to the sharp slope seen in the accumulation balance line. The graph also shows a very strong spike on the far right, reflecting a rapid increase in wallet balance.
Read also: Shiba Inu Launches ShibClaw AI Skill: A Sophisticated Innovation Amidst Crypto Security Threats?
While price movements showed reasonable volatility over the same time frame, the accumulation metric continued its upward trend without any major dips. As such, this data confirms the continued concentration of capital in long-term Ethereum holders, despite changing market conditions across multiple cycles.
Ethereum Rejects Range Resistance as Chart Points to Potential Correction to Lower Support
Ethereum’s latest price movement saw rejection near an important resistance band, referring to a four-hour chart that analyst Kamran Asghar shared on X. The chart displays a horizontal range, with the upper limit repeatedly serving as resistance and the lower limit as an area of support. Whenever the price approaches the upper line, selling pressure tends to emerge and push the price back into the range.
Recent movements have followed the same pattern. Ethereum briefly rallied towards the resistance level and even traded slightly above it. However, the gains didn’t last. The chart marked this rejection at a specific area near the top of the range, when the candles quickly reversed direction. After the rejection, the price corrected towards the middle area of the range, instead of continuing to rise.
At the same time, the chart also shows the presence of a support zone located slightly below the current trading area. This zone previously acted as a short-term demand area, when buyers stepped in to arrest the decline.
According to the analyst, there is a small chance of a bounce if the price tests the area again. However, the overall structure on the chart still points to the lower limit of the range as the next major support level.
The movement projection on the chart depicts a possible upside reaction first, followed by a drop towards the lower support area if the selling pressure continues.
Follow us on Google News to stay up to date with the latest in crypto and blockchain technology. Check Bitcoin price, usdt to idr and tokenized nvidia stock price through Pintu Market.
Enjoy an easy and secure crypto trading and crypto gold investment experience by downloading the Pintu crypto app via Play Store or App Store now. Also, experience web trading with advanced trading tools such as pro charting, various order types, and portfolio tracker only at Pintu Pro.
*Disclaimer
This content aims to enrich readers’ information. Pintu collects this information from various relevant sources and is not influenced by outside parties. Note that an asset’s past performance does not determine its projected future performance. Crypto trading activities are subject to high risk and volatility, always do your own research and use cold hard cash before investing. All activities of buying and selling Bitcoin and other crypto asset investments are the responsibility of the reader.
Reference:
- Coinpaper. Ethereum Price Prediction: ETH Hits Resistance Despite Whale Buying. Accessed on March 10, 2026