Ethereum Price Stays at $2,000 Today: Can ETH Maintain the Rally Momentum?

Jakarta, Pintu News – The price of Ethereum has recorded a limited recovery, rising about 7% since March 8 after forming bullish technical signals on the 8-hour chart. This rise comes as the crypto market in general seeks to find stability.
However, the larger trend for Ethereum is still relatively weak. Through 2026 to date, the asset is still down around 31%, which confirms that the main downtrend has not changed despite the short-term bounce.
Interestingly, this recovery comes after the formation of a technical pattern that had previously triggered a strong rally. However, this time a number of on-chain indicators indicate that the recovery phase could potentially face stronger obstacles ahead.
Then, how will Ethereum price move today?
Ethereum Price Drops 1.13% in 24 Hours
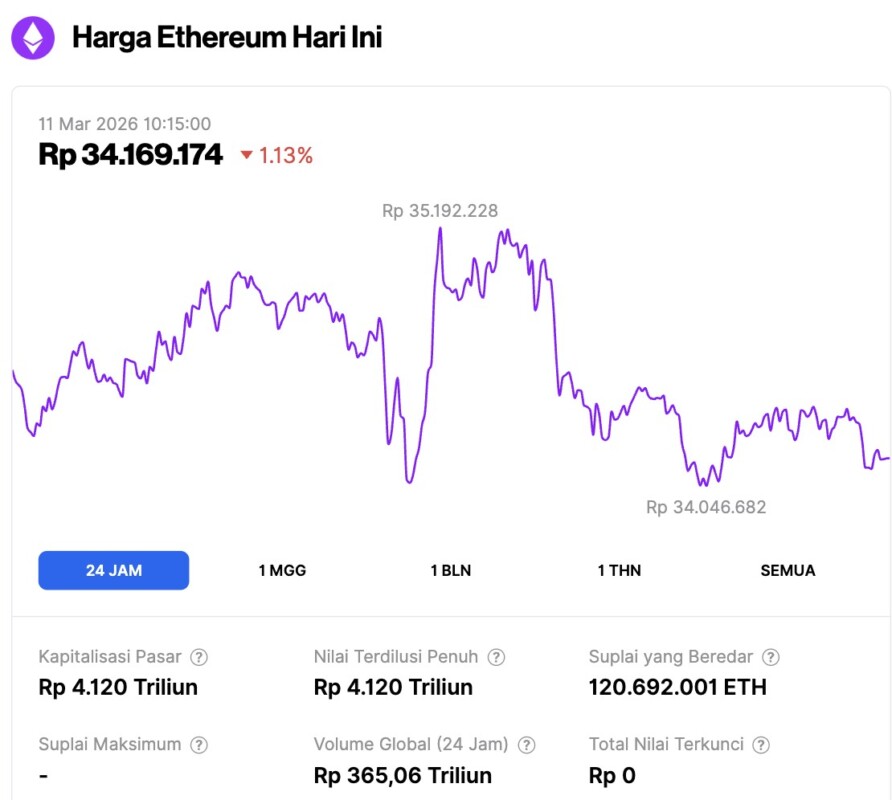
On March 11, 2026, the price of Ethereum was recorded at around $2,023 or the equivalent of IDR 34,169,174, a decrease of 1.13% in the last 24 hours. During this period, ETH had touched its lowest level at IDR 34,046,682 and its highest level at IDR 35,192,228.
As of writing, Ethereum’s market capitalization now stands at around IDR4,120 trillion, with daily trading volume falling 5% to IDR365.06 trillion in the last 24 hours.
Read also: Bitcoin Price Drops Back to $69,000 Today: Is a BTC Whale Making Moves?
Historical Bullish Divergence Triggers 15% Rally in Early March
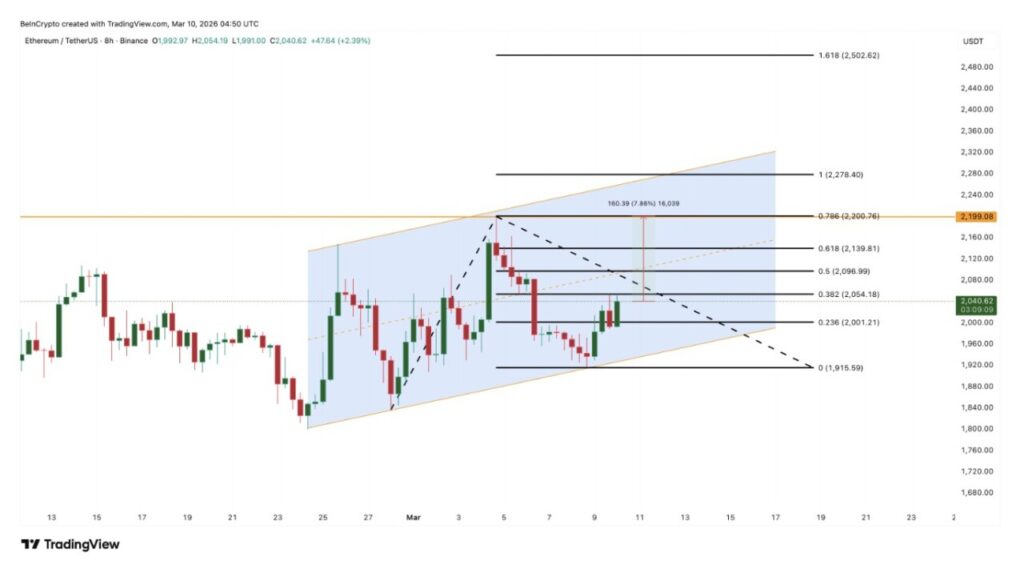
This latest recovery follows the appearance of a bullish divergence on the Relative Strength Index (RSI) on the 8-hour chart. The RSI is a momentum indicator that measures the speed and strength of price movements. When the price forms a lower low while the RSI forms a higher low, it is often interpreted as a weakening of selling momentum.
In the period from February 15 to March 8, Ethereum price printed a lower low, while the RSI formed a slight higher low, resulting in a classic bullish divergence.
A similar pattern also appeared between February 15 and March 1. After the signal was formed, Ethereum rallied more than 15% and climbed towards a local peak around $2,199 ($2,200 area), before the movement lost steam again.
This latest divergence has already prompted a bounce of more than 7%, opening up the opportunity for Ethereum to try to move back into the $2,200 region, which previously acted as resistance during the previous rally.

However, the supporting data for the current move appears weaker than the previous recovery.
Exchange Flow and Whale Ownership Indicate This Bounce Isn’t as Supported as Before
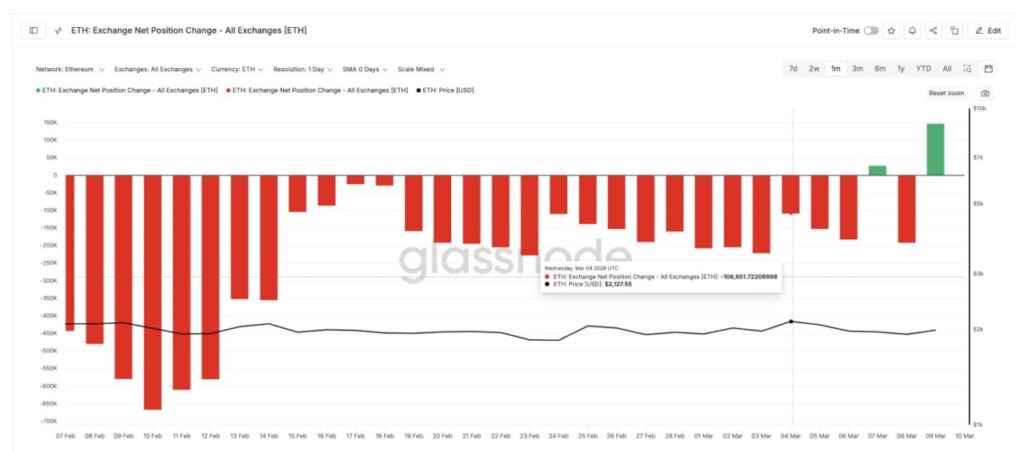
The notable difference this time is seen in asset flows on exchanges and accumulation by whales. In the previous (post-divergence) rally between March 1-4, Ethereum experienced sustained exchange outflows.
The Exchange Net Position Change indicator remains in the negative area, which signals coins are exiting exchanges-generally read as a signal of more consistent buying pressure.
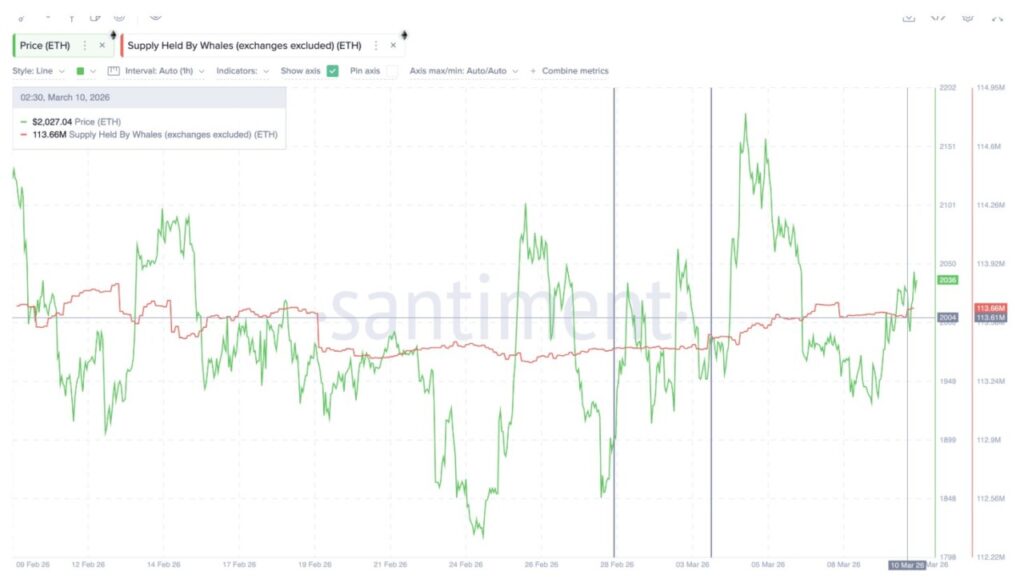
During the same period, whale wallets were also observed accumulating. Large wallet holdings rose from 113.43 million ETH on February 28 to 113.51 million ETH on March 3, an increase of about 80,000 ETH, thus strengthening the bullish momentum.
On the contrary, the current bounce shows the opposite pattern.
On March 9, the Exchange Net Position Change turned positive, with inflows reaching 146,709 ETH. An increase in inflow usually indicates investors moving coins to the exchange, thus increasing the chances of selling pressure appearing. If selling pressure appears immediately after divergence, the prospect of a rally becomes less strong.
Whale behavior has also shifted. Large holders decreased their supply from 113.70 million ETH on March 7 to approximately 113.61 million ETH on March 10, a decrease of approximately 90,000 ETH.

This combination indicates that the latest bounce has not been backed by the same strong accumulation that drove ETH’s previous 15% price rally. However, this is not the only risk.
Cost Basis Data Shows Solid Supply Cluster in the Range of $2,030-$2,180
On-chain cost basis data further emphasizes the potential resistance ahead.
URPD (UTXO Realized Price Distribution) maps the price areas where large portions of supply last moved on-chain. These zones often serve as support or resistance as many holders tend to sell when the price returns closer to their cost basis.
Notes: While URPD was originally designed for UTXO-based networks like Bitcoin, analytics platforms like Glassnode have extended this metric to be used on account-based networks like Ethereum.
A number of important supply clusters are visible just above the current Ethereum price.
About 1.42% of Ethereum’s supply is concentrated in the $2,029 area (close to the current price). Another cluster of 1.06% is around $2,079, followed by 0.88% around $2,128, and 0.91% around $2,178.
Read also: XRP Price Drops 64% from All-Time High: Time to Buy or Wait for a Deeper Drop?

Combined, these levels form a dense resistance corridor, with over 4% of the supply in the range of around $2,030 to $2,180.
If holders in these zones start realizing profits or making distributions, the bounce risks facing significant resistance. Meanwhile, the seemingly weaker buying support – as discussed earlier – may not be sufficient to absorb the potential selling pressure.

Ethereum price needs to break $2,200 to keep the rally going
From a technical standpoint, Ethereum needs to first break $2,130, which is positioned near the bottom of the URPD supply cluster.
The next crucial hurdle is around the $2,200 psychological level, which was the “roof” of the March rally. A decisive 8-hour candle close above $2,200 would indicate Ethereum has successfully absorbed supply from the nearby cluster, potentially opening up space towards $2,270 – an area that also has a sizable supply cluster to consider.

As such, $2,270 becomes an important resistance zone, which will likely need to be broken to reignite expectations of a more sustained rally.
However, downside risks remain. If Ethereum drops through $2,000, the bounce narrative could potentially weaken. A further drop towards $1,910 would further emphasize the broader bearish structure.
For now, Ethereum’s latest bounce can still be considered technically valid, but weaker on-chain support indicates that this rally may face tougher resistance than previous attempts.
Follow us on Google News to stay up to date with the latest in crypto and blockchain technology. Check Bitcoin price, usdt to idr and tokenized nvidia stock price through Pintu Market.
Enjoy an easy and secure crypto trading and crypto gold investment experience by downloading the Pintu crypto app via Play Store or App Store now. Also, experience web trading with advanced trading tools such as pro charting, various order types, and portfolio tracker only at Pintu Pro.
*Disclaimer
This content aims to enrich readers’ information. Pintu collects this information from various relevant sources and is not influenced by outside parties. Note that an asset’s past performance does not determine its projected future performance. Crypto trading activities are subject to high risk and volatility, always do your own research and use cold hard cash before investing. All activities of buying and selling Bitcoin and other crypto asset investments are the responsibility of the reader.
Reference:
- BeInCrypto. Ethereum Price Rebound: Analysis of March Rally and Risk Factors. Accessed on March 11, 2026