3 Altcoins That Crypto Whales Are Buying and Selling Ahead of the March 2026 US CPI Release

Jakarta, Pintu News – The crypto market is bracing for the release of the February US Consumer Price Index (CPI) data (March print), with inflation expected to be slightly higher, partly driven by recent oil price fluctuations.
The macroeconomic backdrop remains uncertain, but on-chain data suggests that large holders have started to position themselves. Analysts on the BeInCrypto page who monitor crypto whale movements have identified three tokens that experienced significant accumulation or selling ahead of the data release.
Pump.fun (PUMP)
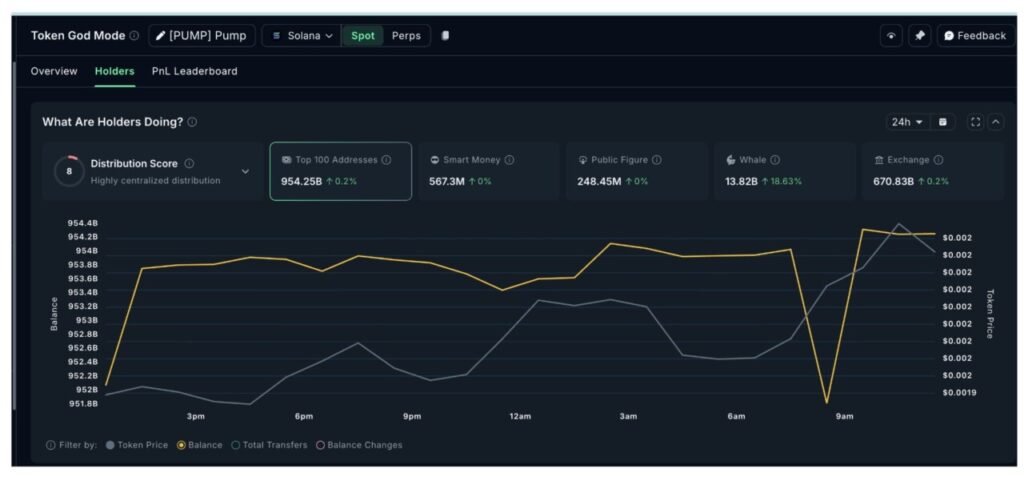
Among the tokens that caught the attention of crypto whales ahead of the February US CPI data release, Pump.fun has seen a sharp spike in accumulation by large holders in 24 hours (10/3).
Read also: 3 Token Unlocks This Week, Potential Crypto Market Shock?
On-chain data shows that PUMP whales increased their holdings by 18.63%, bringing the whales’ total balance to 13.82 billion tokens. This means that large holders accumulated around 2.17 billion PUMP tokens in a single day. At current prices, this equates to about $4.34 million in new purchases by whales.
This time is interesting. With CPI data expected to be slightly mixed compared to January’s data, macro uncertainty remains high. However, as mentioned earlier, many crypto whales seem to see this volatility as an opportunity rather than a risk trigger.
Pump’s chart structure might help explain this interest.
On the 12-hour chart (10/3), PUMP formed an inverse head-and-shoulders pattern, a reversal structure that often signals a potential shift from a downtrend to a new up phase. The right shoulder pattern formed around March 6, and the price has since been slowly moving towards the neckline.
Currently, PUMP is trying to stabilize around $0.0020, which is in line with the 0.382 Fibonacci retracement level and has become an important short-term resistance.
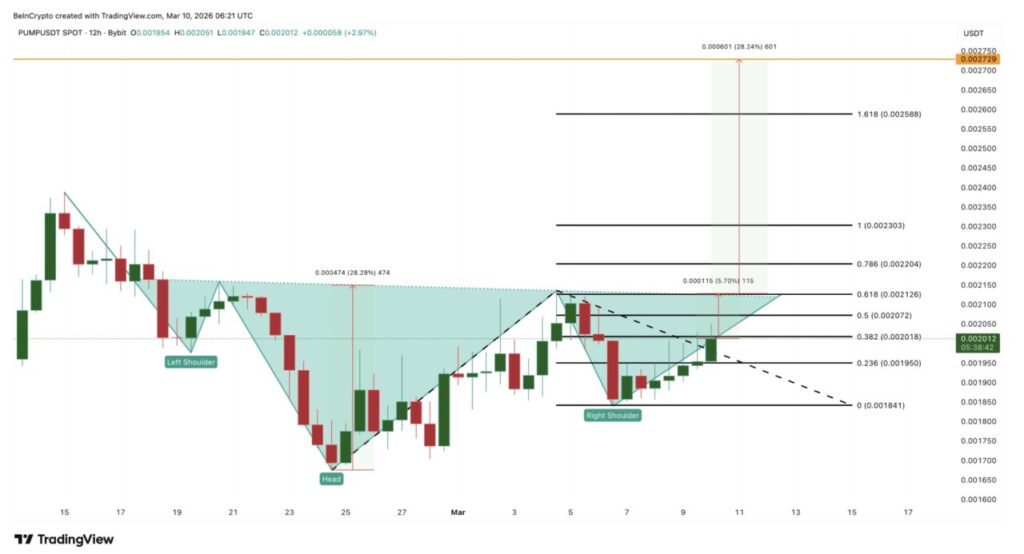
A clean move above $0.0020 would bring the neckline around $0.0021 into focus. The level is about 5.7% above the current price. If buyers manage to break and keep the price above the neckline, the inverse head-and-shoulders projection suggests a potential upside move of 28%, targeting the $0.0027 region.
However, a drop to $0.0018 would weaken the structure. This could delay breakout expectations, although crypto whales continue to accumulate ahead of the CPI data release.
Chainlink (LINK)
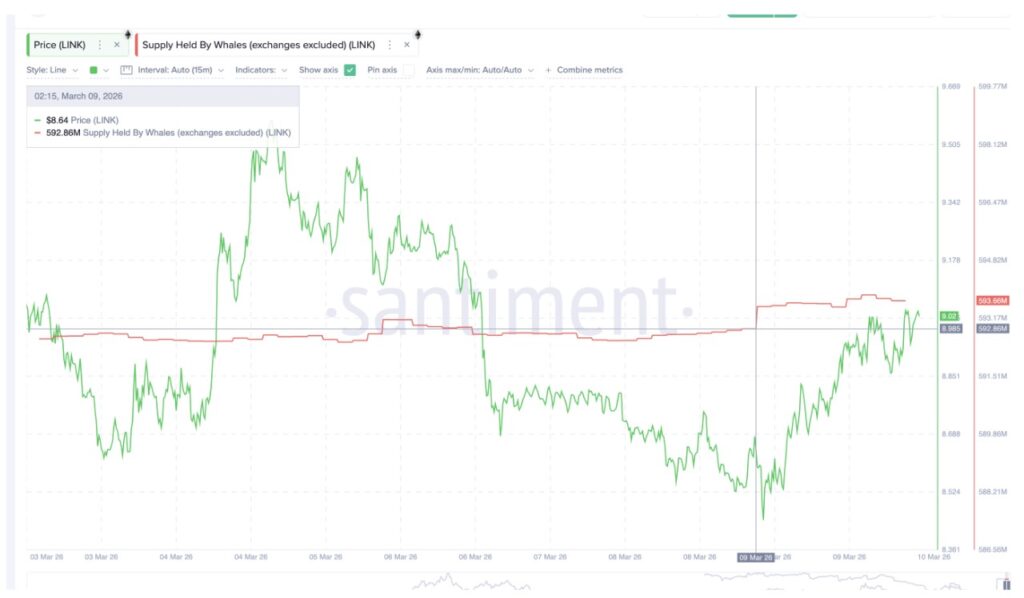
Chainlink was another asset that caught the attention of crypto whales ahead of the February US CPI data release, with on-chain data showing steady accumulation in the 24 hours (10/3).
As of March 9, the whale wallet held 592.86 million LINK tokens. The balance has now risen to 593.66 million LINK, meaning large holders accumulated around 800,000 LINK in a single day. At the current price of about $9 per token, this equates to about $7.2 million in new purchases by whale.
Part of this interest seems to be related to the improvement of Chainlink’s technical structure.
On the daily chart (10/3), LINK showed bullish divergence on the Relative Strength Index (RSI), a momentum indicator. Between January 25 and March 8, LINK’s price formed lower lows, while the RSI printed higher lows, a classic divergence pattern that often signals a weakening of downward momentum and a potential trend reversal.
This possibility is significant as Chainlink has been under pressure for months. Despite rising around 2.4% on March 10, LINK remains down around 26% since the start of the year, reflecting a broader downward trend that may now be starting to stabilize.
From a price perspective, $9.91 is the first major level to watch. This area is in line with the 0.618 Fibonacci retracement, which is historically one of the most important technical zones. A clean move above $9.91, followed by a break of $10.32, could confirm strength and open up opportunities towards $12.36, especially if this divergence holds and sentiment towards the real-world asset sector remains favorable.
Read also: Kraken Announces Pi Network Listing Ahead of Pi Day, PI Price Strengthens
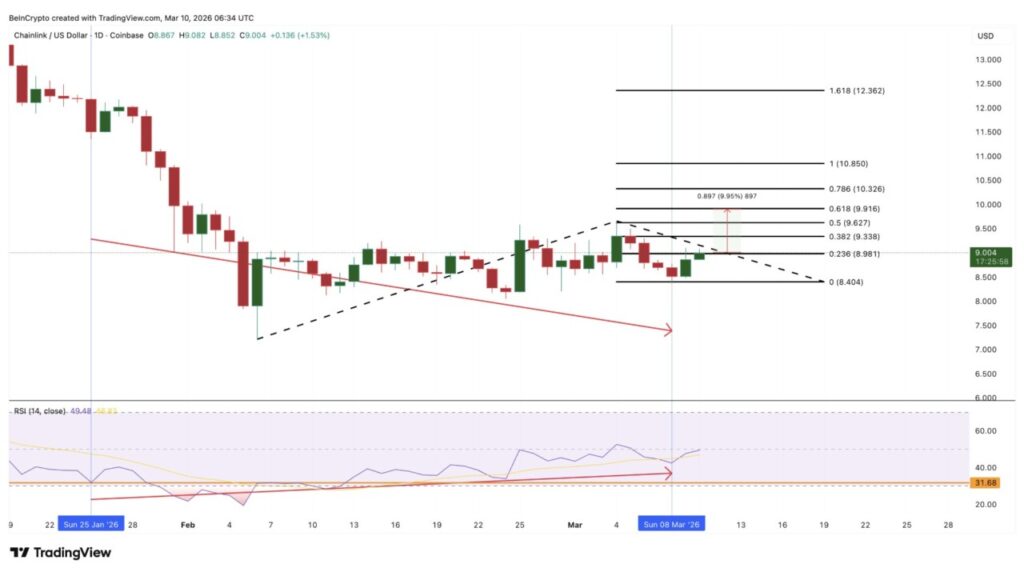
However, this bullish structure has its limits. A drop below $8.40, the low of March 8, will weaken the divergence setup. This will delay any potential recovery despite the recent increase in whale accumulation.
Morpho (MORPHO)
Morpho shows a more complex picture in the positioning of crypto whales ahead of the US CPI data release.
In the past 7 days, whale wallets have reduced their MORPHO holdings by 26.53%, leaving the group with approximately 555,435 MORPHO tokens. This sharp sell-off suggests that many large holders are locking in profits after the token’s strong rally earlier in the year.
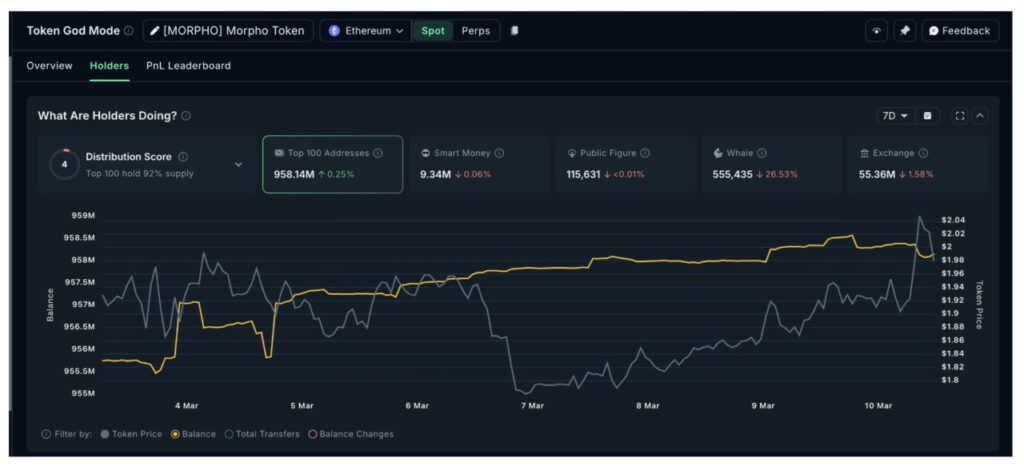
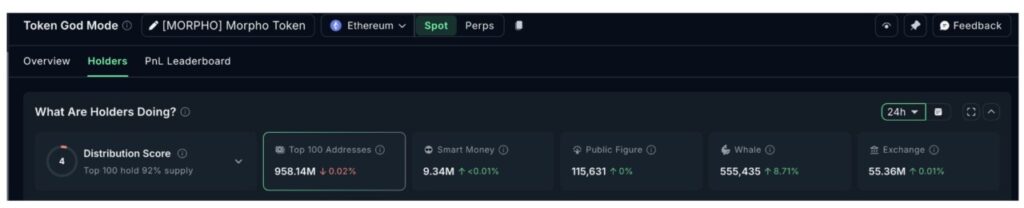
However, the latest data shows a change. On March 10, the same group of whales increased their holdings by 8.71%, indicating that some big players re-entered the market after the recent consolidation.
This behavior makes more sense when looking at Morpho’s pricing structure.
Since February 6, MORPHO has been rising steadily, registering a rally of around 100% that peaked around March 3. After reaching that level, the token entered a consolidation pattern similar to a bullish flag, a continuation structure that often forms after a strong upward movement. The breakout of this flag occurred recently, which likely explains the renewed whale buying in the past day.
However, caution is still required.
Although the price attempted to go higher, the Relative Strength Index (RSI) formed a lower high, while the price printed a higher high. This developing bearish divergence suggests that momentum could weaken if this pattern is confirmed.
For bullish continuation, MORPHO needs to move above $2.08, which will invalidate the developing divergence and keep the uptrend intact. A stronger continuation could then target $2.41, the 0.618 Fibonacci level, followed by $2.82 or even higher if the momentum gets stronger.
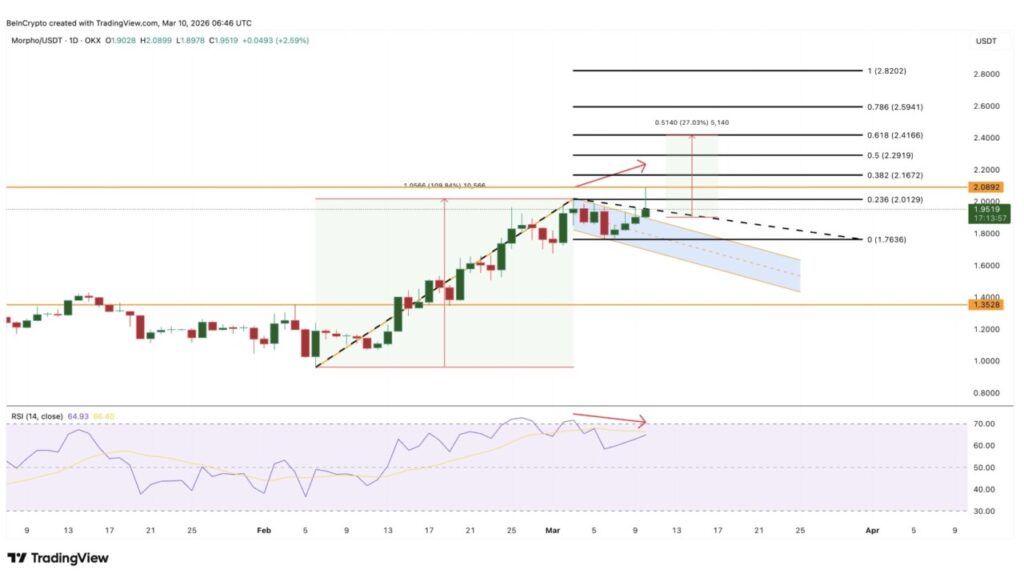
On the downside, a drop below $1.76 will weaken the current structure, while falling below $1.35 could invalidate the overall broader breakout pattern.
Overall, the whale data suggests that crypto whales initially sold MORPHO to lock in profits during the consolidation, but are now starting to cautiously return after the breakout.
Follow us on Google News to stay up to date with the latest in crypto and blockchain technology. Check Bitcoin price, usdt to idr and tokenized nvidia stock price through Pintu Market.
Enjoy an easy and secure crypto trading and crypto gold investment experience by downloading the Pintu crypto app via Play Store or App Store now. Also, experience web trading with advanced trading tools such as pro charting, various order types, and portfolio tracker only at Pintu Pro.
*Disclaimer
This content aims to enrich readers’ information. Pintu collects this information from various relevant sources and is not influenced by outside parties. Note that an asset’s past performance does not determine its projected future performance. Crypto trading activities are subject to high risk and volatility, always do your own research and use cold hard cash before investing. All activities of buying and selling Bitcoin and other crypto asset investments are the responsibility of the reader.
Reference:
- BeInCrypto. Crypto Whales Buy and Sell Ahead of March 2026 CPI Print. Accessed on March 13, 2026