Ethereum Holds Above $2,100 as Signs Emerge That ETH May Be Entering an Overvalued Phase

Jakarta, Pintu News – Ethereum is currently trading at around $2,150 and is recovering in an upward channel pattern after correcting from its March peak of $2,393.
Now, there are two on-chain signals and a clear area of technical resistance, which will determine whether ETH’s bullish momentum is strong enough to push the price towards $2,500.
In terms of asset outflows from the exchanges, conditions look quite positive. However, at the same time, there is one valuation metric that signals caution. In addition, the price chart also shows certain zones that had previously held back ETH’s rise.
Ethereum Price Drops 0.19% in 24 Hours
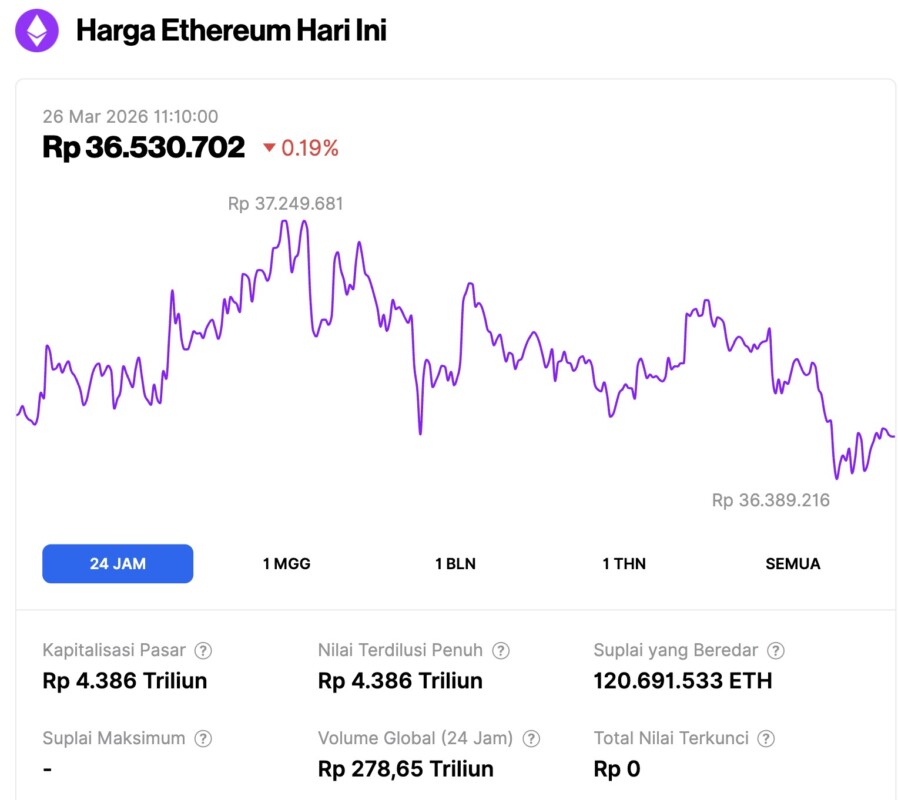
As of March 26, 2026, Ethereum was trading at around $2,150, or approximately IDR 36,530,702, marking a modest 0.19% decline over the past 24 hours. During that period, ETH moved within a range of IDR 36,389,216 at its lowest point and IDR 37,249,681 at its highest.
At the time of writing, Ethereum’s market capitalization stood at roughly IDR 4,386 trillion, while its daily trading volume dropped 7% over the last 24 hours to IDR 278.65 trillion.
Read also: Bitcoin Price Stable at $70,000 Today: What is Needed for BTC to Breakout?
Ethereum Outflows from Exchanges Touch Highest Levels, Indicate Accumulation
Glassnode’s exchange net position change chart shows the movement of ETH across exchanges in the period from March 2 to March 25. In the first half of March, the movement was still rather mixed.
The small red bars that appeared at the beginning of the month then changed to green bars from March 8 to 13, indicating ETH flowed into the exchange during that period. This is generally seen as a signal to prepare to sell.
However, since March 14, the direction changed quite sharply. The red bars, indicating a net outflow of ETH from exchanges, reappeared and continued to grow until the last week of March.
The largest outflows seen on the chart occurred around March 22 and March 24-25, with the value approaching -1.2 million ETH in a single day. On a large scale, the exit of ETH from exchanges usually indicates that holders are likely to take advantage of low prices for accumulation, while reducing the supply ready for sale in the near future.
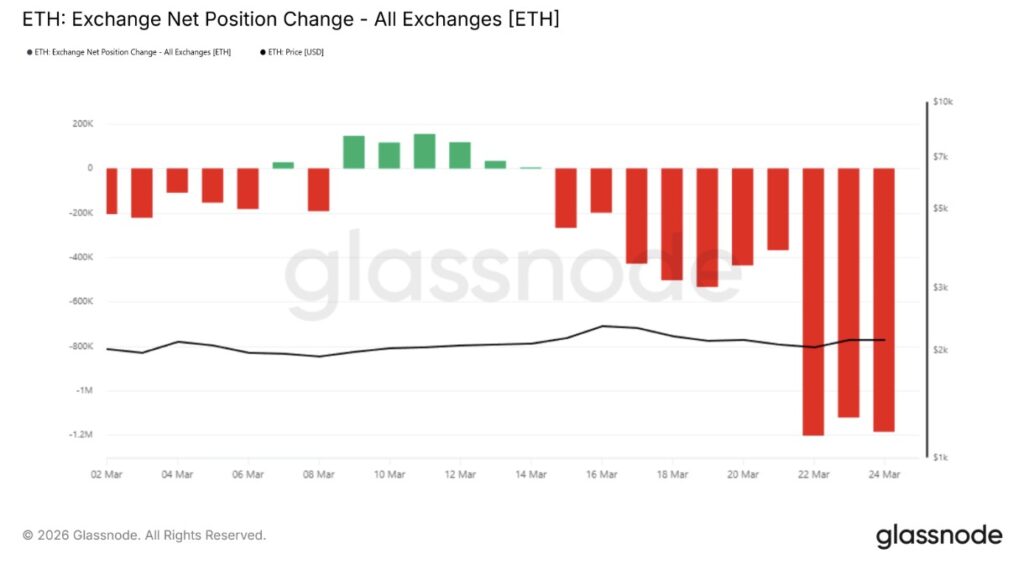
However, the magnitude of recent outflows also reflects that the market is very sensitive to price movements at current levels. Large fund movements, both in and out, are often a precursor to sharper price volatility.
Is ETH Starting to Enter the Overvalued Phase?
The Network Value to Transactions (NVT) Signal chart covers the period from February 19 to March 25, 2026. This indicator measures the ratio between ETH market capitalization and on-chain transaction volume, so it is often thought of as a kind of price-to-earnings ratio for the Ethereum network. When the NVT value increases, it means that the price of ETH is rising faster than the economic activity that supports it.
It then steadily increased throughout March, peaking at around 64 on March 17, and then corrected briefly before rising back to around 60 as of March 25. Meanwhile, the price of Ethereum, shown by the black line, moved relatively flat in the range of $2,100 to $2,300 during the period.
Read also: Bitcoin is Ready for Volatility, Here are 4 US Economic Data to Watch!
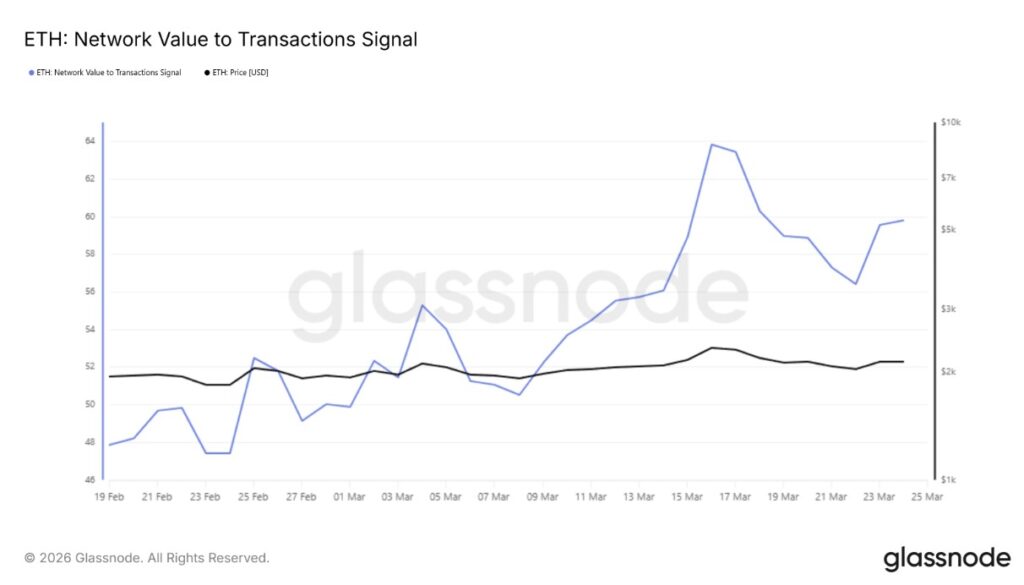
This is where the concern lies. The volume of on-chain transactions is not growing in proportion to the increase in market capitalization. An increase in NVT Signal does not automatically mean the price will fall.
However, this suggests that ETH’s current valuation needs stronger network activity to remain reasonable. If transaction volumes don’t catch up soon, ETH will look increasingly expensive relative to its fundamental network usage.
ETH Price Has a Clear Target
Ethereum price was briefly at $2,186, moving between the 23.6% Fibonacci level at $2,130 and the 38.2% level at $2,203. The Fibonacci grid is drawn from the cycle low of $2,023 to the latest swing peak of $2,494.
Meanwhile, the 20-day EMA stands at $2,145, slightly below the current price and still showing an uptrend, thus signaling short-term support.
ETH is also still trading inside a fairly clear rising wedge pattern, with the lower boundary of the pattern currently at around $2,080. This channel structure has remained intact since the February 25 low, and the price respected its upper and lower boundaries several times when tested.
The area annotated with a “red circle” on the chart is at the 78.6% Fibonacci retracement level of $2,393. This zone was the previous price rejection point in mid-March. At that time, the price of Ethereum had risen to near $2,393 before finally correcting sharply to the $2,130 area. For the bullish camp, this area is the only important resistance that needs to be broken before ETH has a chance to advance to the $2,500 target.
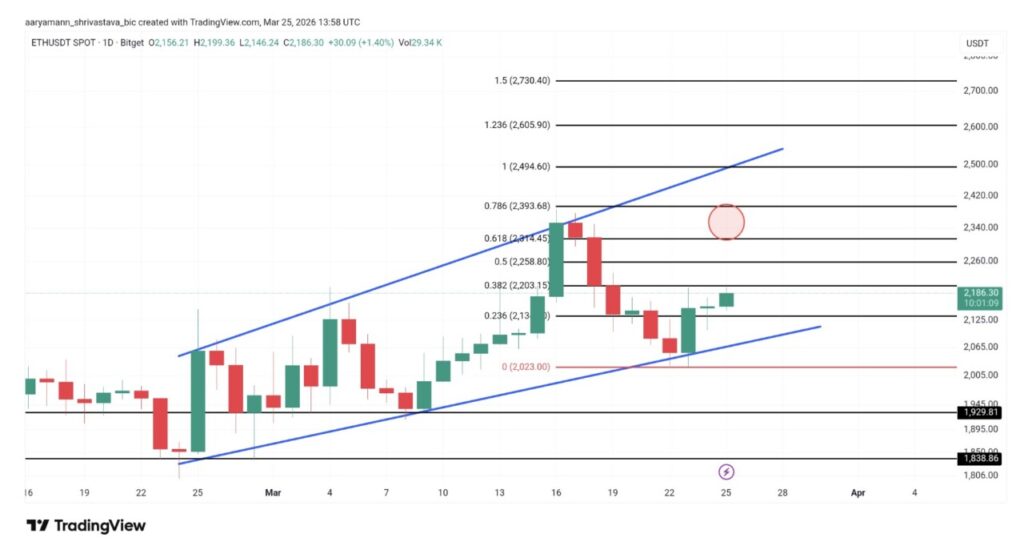
If ETH is able to record a 12-hour candle close above $2,393, then an upside opportunity towards $2,494 will open up, and then continue to the 1.236 extension level at $2,605. After that, the next target is at the 1.5 extension at $2,730. These levels are also in line with the upper limit of the rising channel. When the Fibonacci levels of 0.618 or 0.786 successfully turn into support, the price could potentially bounce and break out of the pattern.
The scenario that invalidates the bullish view is if the price closes daily below the lower boundary of the rising channel which is around $2,023. If this support is broken, the entire upward structure formed since late February will collapse. In that case, the next support areas to watch would be around $1,929 or $1,838.
Follow us on Google News to stay up to date with the latest in crypto and blockchain technology. Check Bitcoin price, usdt to idr and tokenized nvidia stock price via Pintu Market.
As a safe crypto app, Pintu provides a crypto trading experience to access crypto gold investment easily and conveniently. You can also see today’ s gold jewelry price and today’s gold bullion price to support your investment activities and portfolio diversification as well as learn crypto through Pintu Academy.
Download the Pintu crypto app via Play Store or App Store now. Enjoy the web trading experience with various advanced trading tools such as pro charting, various types of order types, and portfolio tracker only at Pintu Pro.
*Disclaimer
This content aims to enrich readers’ information. Pintu collects this information from various relevant sources and is not influenced by outside parties. Note that an asset’s past performance does not determine its projected future performance. Crypto trading activities are subject to high risk and volatility, always do your own research and use cold hard cash before investing. All activities of buying and selling Bitcoin and other crypto asset investments are the responsibility of the reader.
Reference:
- BeInCrypto. Ethereum Price’s Climb Above $2,500 Requires Crossing This “Red Circle” Accessed on March 26, 2026


