Reading Bitcoin’s Direction Before and After Halving
The halving event is one of the most anticipated catalysts as it is expected to lift the price of Bitcoin. Due to the reduced supply of Bitcoin after halving, the perception of scarcity of Bitcoin can be a positive catalyst for Bitcoin price. So, has the halving event been correlated with an increase in Bitcoin price? Find out in this article.
Article Summary
- ✂️ Bitcoin Halving is when the block reward earned by Bitcoin miners is cut in half. Halving events occur every 210,000 blocks or approximately every four years.
- ♻️ Historical data shows that three phases in a halving cycle occur every 70,000 blocks. They are parabolic uptrend, large drawdown, and consolidation.
- 🚀 The process towards the fourth halving reached 73% on April 6, 2023. Bitcoin has also found its bottom and has now closed above the macro downtrend for the third time.
What is Bitcoin Halving?
Bitcoin Halving is when the block reward earned by Bitcoin miners is cut in half. Halving events occur every 210,000 blocks or approximately every four years. The idea behind halving is to limit supply and slow the speed of new Bitcoins entering the market (inhibiting inflation of BTC). With supply reduced but demand remaining high, the price of BTC is expected to continue to rise in the long run.
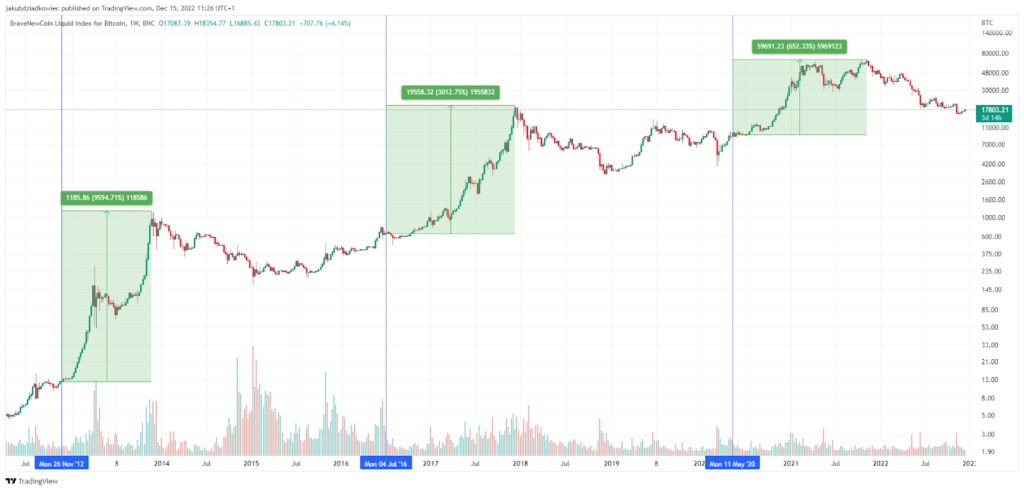
Bitcoin’s price has historically increased after each of its three halvings, which occurred in 2012, 2016, and most recently on May 11, 2020. This trend suggests that reducing the supply of Bitcoin through halving events can trigger price increases.
| Halving | Halving Date | Days to Next Halving | Number of Blocks | Miner Rewards | BTC Price Increase* | Uptrend Period |
| #1 | 28 Nov 2012 | 1.318 Day | 210.000 | 25 BTC Per Block | 9.594% | 369 Day |
| #2 | 9 Jul 2016 | 1.401 Day | 420.000 | 12,5 BTC Per Block | 3.012% | 526 Day |
| #3 | 11 May 2020 | 1.427 Day | 630.000 | 6,25 BTC Per Block | 652% | 538 Day |
| #4 | 6 Apr 2024 | ??? | 840.000 | 3,125 BTC Per Block | ??? | ??? |
According to the latest estimates, the fourth Bitcoin halving will occur on April 6, 2024. Miners’ rewards for each new Bitcoin issuance will be slashed to 3,125 BTC.
Bitcoin Halving Cycle
As mentioned earlier, halving events occur every 210,000 blocks. Historical data shows that three phases in a halving cycle occur every 70,000 blocks. In fact, the cycle has repeated itself in the last three halving events. As quoted from Bitcoin Magazine, the three phases are parabolic uptrend (price increase), large drawdown (price decrease), and consolidation. The cycle occurrence is inseparable from the perception of people who see Bitcoin becoming more scarce as the BTC supply decreases.
Parabolic Uptrend Phase
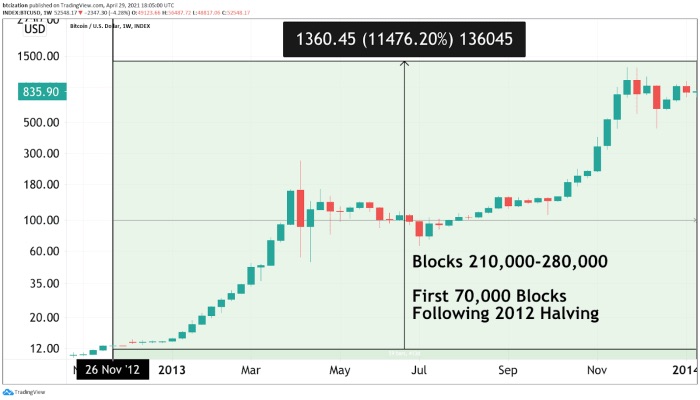
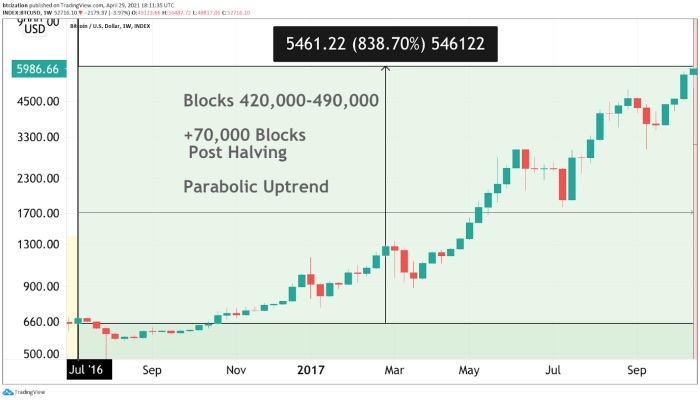
After the halving event, the first 70,000 blocks of Bitcoin will be in the parabolic uptrend phase. In this phase, Bitcoin price is in a strengthening trend. The price increase is attributed to the reduced supply of Bitcoin. However, another important factor is the presence of Bitcoin miners.
Miners are considered the most bullish market participants. This is because they keep as much of their mined Bitcoin as possible. At the same time, they will sell as little Bitcoin as possible just to cover their operating costs.
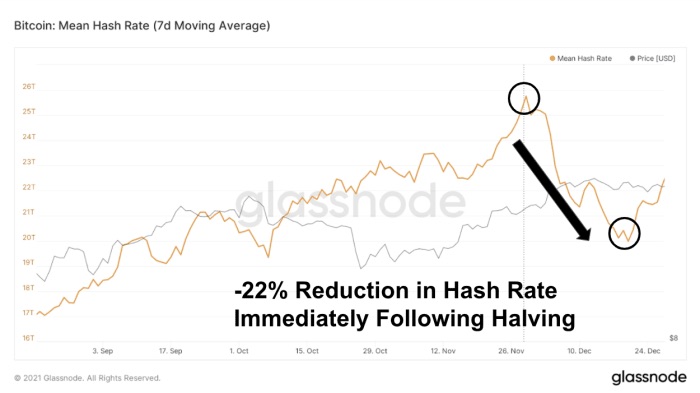
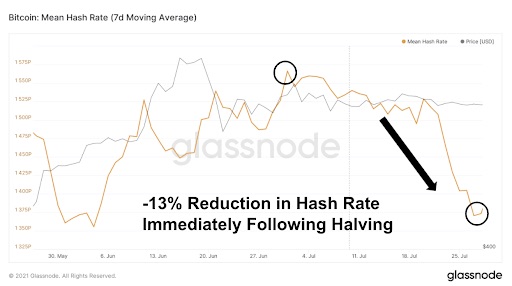
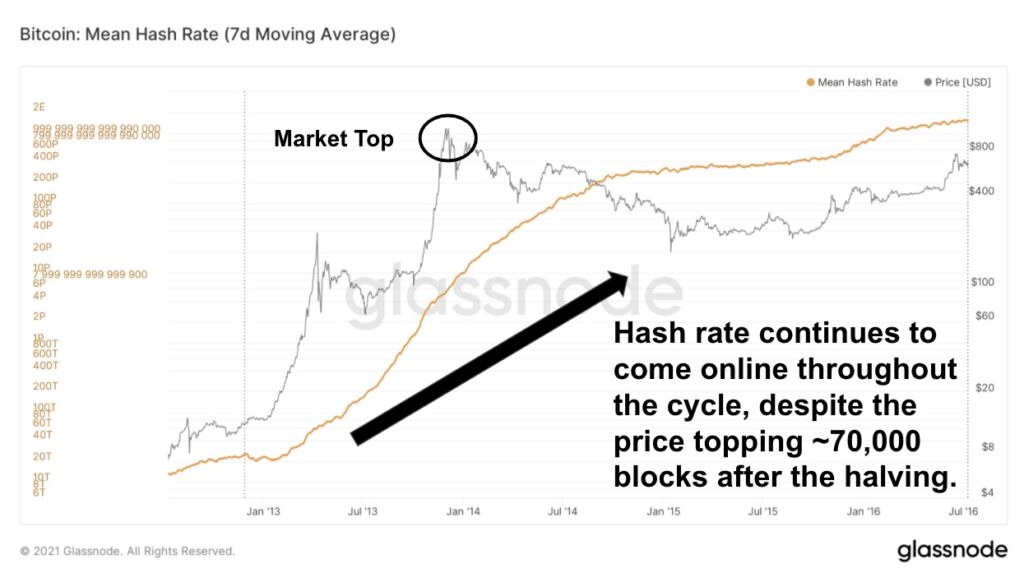
So why would the presence of Bitcoin miners affect the price of BTC? The reduced supply of Bitcoin post-halving will make it difficult for less efficient miners. With reduced revenue while operating costs remain high, some will have to shut down their operations. As the number of miners decreases, the hash rate will also drop. This allows only highly efficient miners to mine new blocks. As a result, they can get a bigger market share and profit. At the same time, they also don’t need to sell all of their mining output, reducing selling pressure in the market.
As BTC prices rise following the reduction in supply, more investors will go long to capitalize on the momentum. At the same time, selling pressure from miners also diminishes. This happened in 2012 and 2016 when the initial 70,000 blocks post-halving were in the parabolic uptrend phase, and BTC rallied.
Large Drawdown Phase
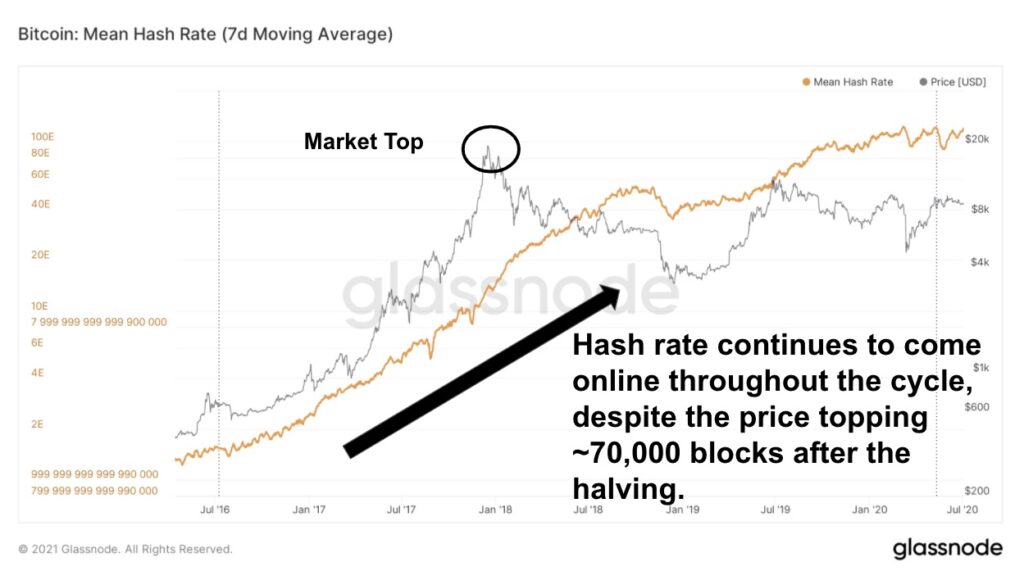
As the price of Bitcoin increases, the rewards Bitcoin miners earn increase. As a result, many are interested in becoming miners, so the Bitcoin mining industry has become very competitive. Inevitably, the hash rate rose again. However, the high level of participation is not followed by the availability of mining equipment.
The tight competition among miners, the high hash rate, and the shrinking rewards have reduced miners’ profitability. This increases selling pressure as miners need funds to cover operational costs. At the same time, buying action from most investors could be reduced because the price of BTC is considered too high.
After a parabolic uptrend phase where Bitcoin always breaks a new all-time high, the price of BTC then starts to fall. The previous two cycles have seen a large drawdown phase when demand for BTC starts to disappear. At the same time, BTC supply increases due to sell-offs from miners and investors taking profits.
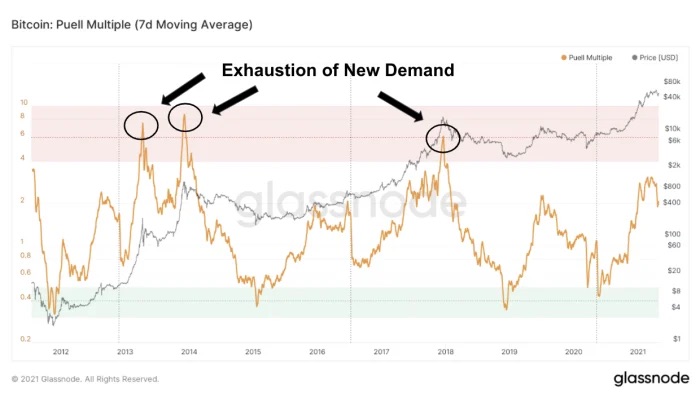
This dynamic can be seen with the Puell Multiple Indicator, which is calculated by dividing the daily issuance value of bitcoins in dollars by the 365-day moving average of daily issuance value. Even with demand increasing exponentially, if price rises too far, too fast, the new high in price cannot be sustained for long. It can be seen in the chart above that when the puell multiple experienced a significant increase, the price of BTC did not last long and then immediately fell. The peak point of the puell multiple can signify the beginning of the large drawdown phase.
Historical data shows that after the first halving, BTC was in the large drawdown phase from December 2, 2013 (ATH level of the first halving cycle) to January 18, 2015 (bottom level of the first halving cycle), or for 412 days. Then, in the second halving period, the large drawdown phase occurred for 375 days, from December 17, 2017 (ATH level of the second halving cycle) to December 27, 2018 (bottom level of the second halving cycle).
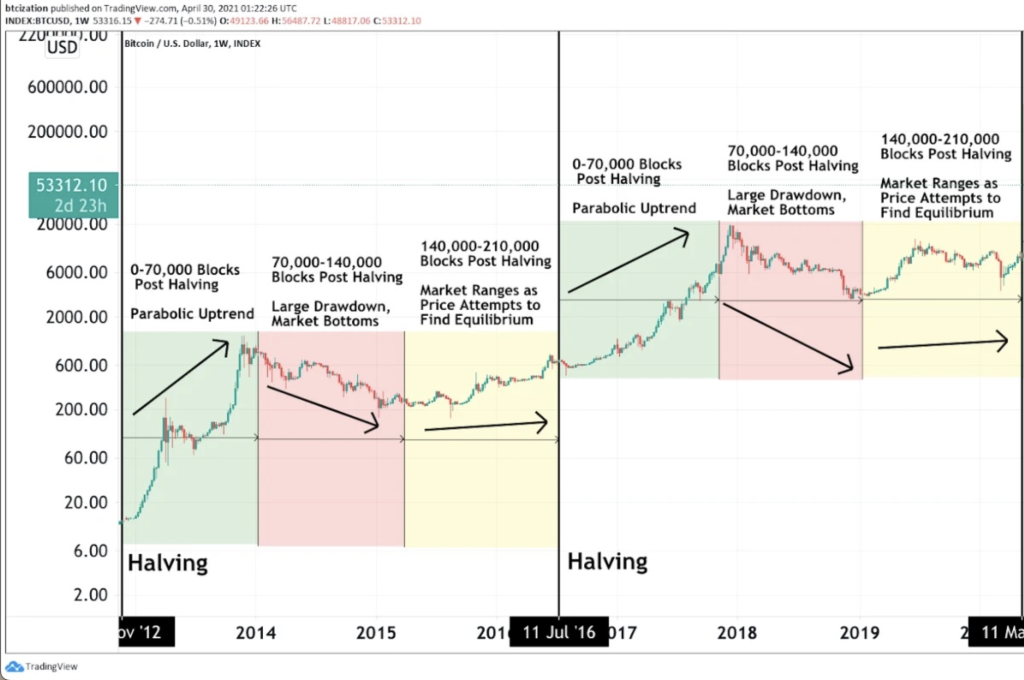
Consolidation Phase
After the large drawdown, the last 70,000 blocks before the next halving, Bitcoin will look for a new equilibrium point. During this consolidation phase, the price of BTC will move above the bottom of the bearish period but below the all-time high level of the bullish period. In this phase, the price of BTC will move sideways until it finally enters a bullish phase in the next halving. Bitcoin continued its sideways movement in the previous two cycles for 200 days (2015) and 100 days (2019).
Bitcoin Condition at The Moment
Bitcoin on-chain and cycle analyst @therationalroot conducted an analysis and found that the process towards the fourth halving has reached 73% as of April 6, 2023. The important implication of the analysis is that the price of BTC has passed the macro bottom of each halving cycle. In 2015, BTC’s bottom was US$ 164; four years later, the bottom was US$ 3,184. If similar cycles remain the same, then in this phase, the US$15,945 on November 21, 2022, was the bottom of BTC.
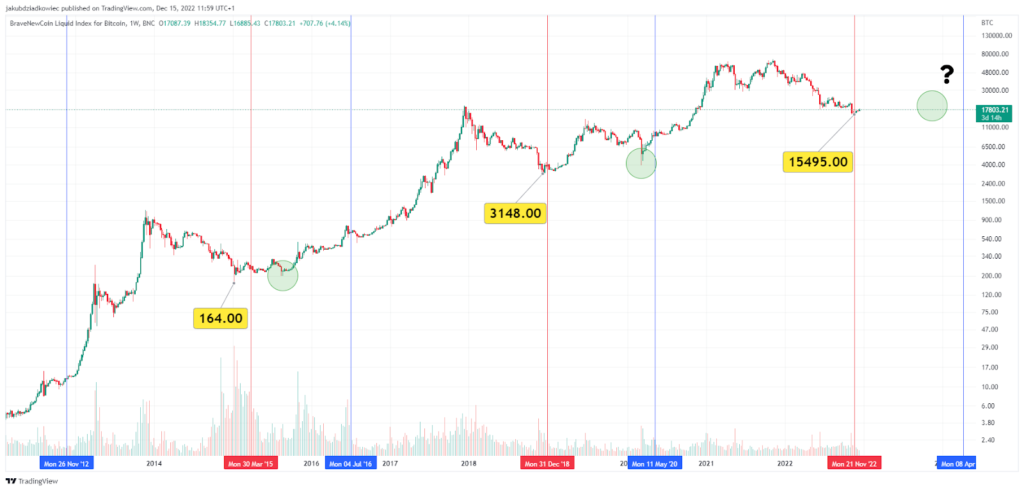
If you look at the chart above, after reaching the bottom, the price of BTC then moved up. BTC underwent a correction shortly after, as seen in the green circle. Pattern-wise, the green circle is the correction period before the halving, providing a promising buying opportunity. However, this is just historical data that cannot reflect future price movements.
Back in 2023, On the 1st of April, BTC created history by closing above a Macro Downtrend for the third time. These downtrends are diagonal resistances that keep prices down for several months from the previous ATH to the bear market bottom. A Monthly Close beyond this downtrend has historically been followed by a mid-to-long-term Macro Uptrend.
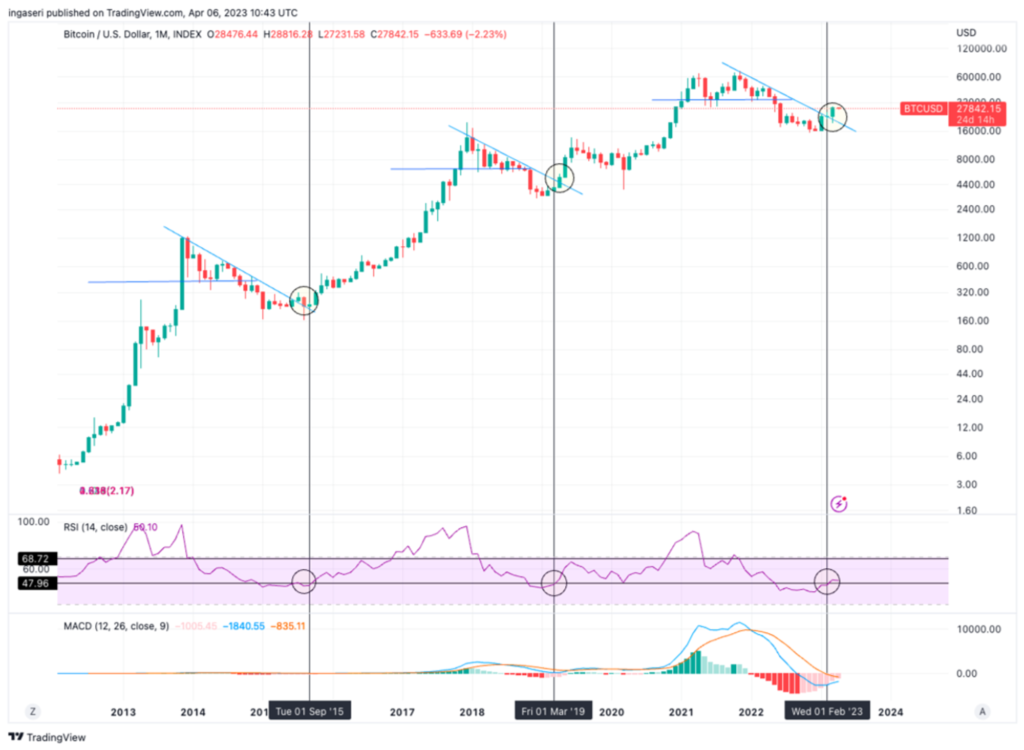
In 2019, BTC experienced three months of continuous growth after such a Monthly Close before hitting a Local Top at $13900 in June 2019. Interestingly, the downside wick of the March 2020 crash retested the same price point that BTC would have retested as support if it had immediately dipped after the breakout.
In 2015, a short-term retest was required for BTC to flip the Macro Downtrend from old resistance to the new support. In both cases, the breakouts were followed by long-term growth. It’s also worth noting that this doesn’t mean the BTC price will continue increasing. This is because there is a possibility that the price of BTC will move sideways again, like in 2015 and 2019.
Closing Thoughts
It’s important to note that all the data presented above reflects past performance and cannot accurately predict future price movements. While there is no guarantee that the same patterns will repeat themselves in the future, studying historical data can be a helpful exercise. By examining Bitcoin’s price movements before and after past halving events, investors may be better equipped to develop effective investment strategies in anticipation of future halvings. Therefore, exploring this data may provide valuable insights for investors seeking to make informed decisions.
Buy Bitcoin at Pintu
After learning about Bitcoin NFT or Ordinals, you can start minting by buying BTC in the Pintu App. Here’s how to buy crypto on the Pintu application:
- Create a Pintu account and follow the process of verifying your identity to start trading.
- On the homepage, click the deposit button and top up the Pintu balance using your preferred payment method.
- Go to the market page and look for Bitcoin.
- Click buy and fill in the amount you want.
- Now you have BTC as an asset!
Besides BTC, you can buy various crypto assets such as ETH, SOL, MATIC and others safely and easily. Furthermore, Pintu has subjected all its crypto assets to a thorough evaluation process, emphasizing the importance of prudence.
Pintu is also compatible with popular wallets such as Metamask to facilitate your transactions. Download Pintu app on Play Store and App Store! Your security is guaranteed because Pintu is regulated and supervised by Bappebti and Kominfo.
In addition to executing transactions, in the Pintu Apps, you can also learn more about crypto through various Pintu Academy articles updated weekly! All Pintu Academy articles are made for knowledge and educational purposes, not as financial advice.
Reference
Dyan Leclair, Why the Bitcoin Price Will Continue Going Parabolic? Bitcoin Magazine, accessed on 11 April 2023.
Jakub Dziadkowiec, Bitcoin Halving Is 65% Completed. Is This Signal of BTC Cycle Bottom? Bein Crypto, accessed on 11 April 2023.
Samuel Wan, Bitcoin halving pattern suggests price will cross above higher, realized value. Crypto Slate, accessed on 11 April 2023.
Share