How to Read Candlestick Pattern Easily
Cara Membaca Analisa Candlestick
In making investment decisions, the most important consideration is fundamental analysis. However, some investors are also take into account the price trend pattern or technical analysis before making decisions. Therefore many investors learn how to read a candlestick pattern.
By doing candlestick analysis, an investor can observe the historical data in the form of price ups and downs, as a guide for investors in making decisions.
Article Summary
- 📊 Candlestick is a technical indicator that show price over a specified period of time, which provides information on the opening price, closing price, the highest price, and the lowest price
- 📖 Reading a candlestick is important because it helps investors to understand the price movement signal and read market psychology, which can be valuable in making investment decisions.
- ⚠ There are three common candlestick pattern that are utilized to predict likely future price moves. First, a bullish reversal which indicates a reversal of the price trend that is strengthening, a bearish reversal, which indicates a reversal of a price that is weakening, and a continuation, which indicates a continuation of the prior price trend.
Candlestick Definition
Candlestick is a technical indicator that represents price activity in a certain time range, which can be minutes, hour, daily, and weekly. An example can be seen in the Bitcoin price chart below, which was acquired from TradingView.
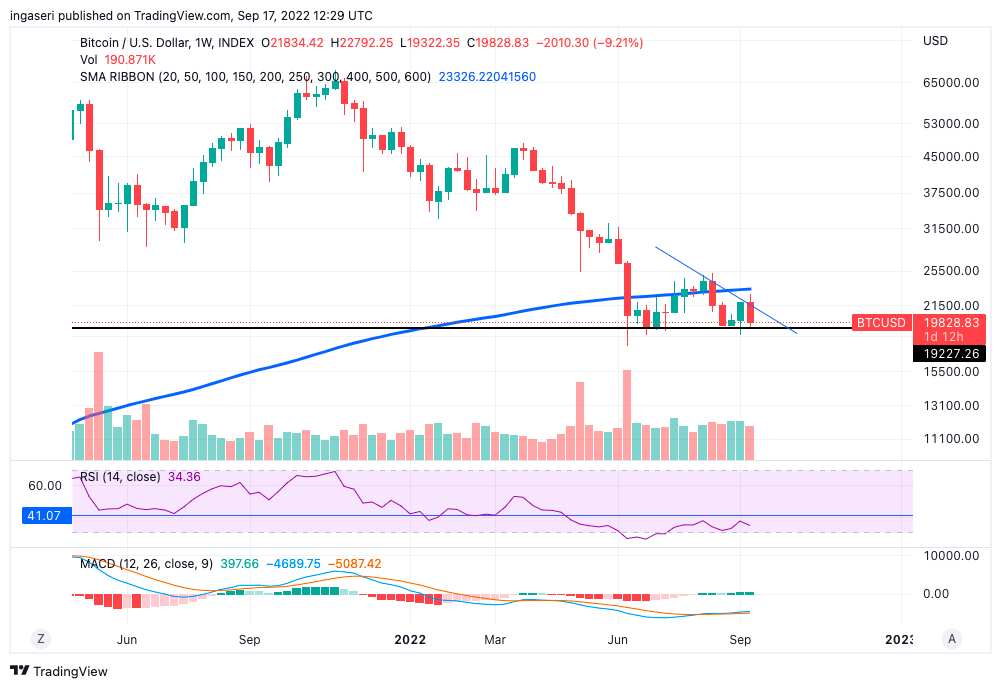
There are basically four bits of information on each candlestick instrument: the opening price, the closing price, the highest price, and the lowest price.
In order to make a sound decision, investors often also examine candlestick movement in addition to conducting fundamental analysis. They can can get a sense of potential price movement and forecast the trend movement, whether it is bullish or bearish, through candlestick analysis
How to Read Candlestick
When reading a candlestick, investors should focus on the colored part of the candle, which is called the ‘body’. This part represents the price range between the open and close of that days’ trading.
If the ‘body’ is red, it indicates a price decrease, and there is selling pressure. In a red candlestick, the bottom part indicates the closing price while the top part indicates the opening price. If the body is green, it indicates a price increase, and there is buying pressure. The bottom part of the green candlestick indicates the opening price, while the top part indicates the closing price.
Just above and below the body are the ‘shadows’ or ‘wicks’. This indicator shows the movement of the price range over a certain period, from the lowest to the highest. The upper shadow shows the highest price for the period, then the lower one shows the lowest price for the period.
Candlestick is not the only technical indicator, you can read another technical indicator and how to do it in this link
The Importance of Understanding Candlestick
Understanding candlestick movement is essential because it allows investors to observe price swings and get signals about potential future price changes.
Not only that, candlesticks also allow investors to understand the psychology of the market, such as who is controlling the trade—the buyer or the seller. A candlestick’s shadow and the body’s shape will both reflect this.
Candlestick Pattern and Its Meaning
After understanding the importance of candlestick analysis, investors learn the meaning behind the patterns. Understanding candlestick patterns can help investors make the best investment choice at the right time to take advantage of all available chances.
In general, there are three types of candlestick movement patterns, namely bullish reversal candlestick patterns, bearish reversal candlestick patterns, and continuation candlestick patterns.
Bullish Reversal Candlestick Pattern
As the name implies, the following candlestick patterns indicate a price trend reversal from a downtrend to an uptrend. This types of bullish candlesticks are often used as a reference for trader:
- Bullish Hammer
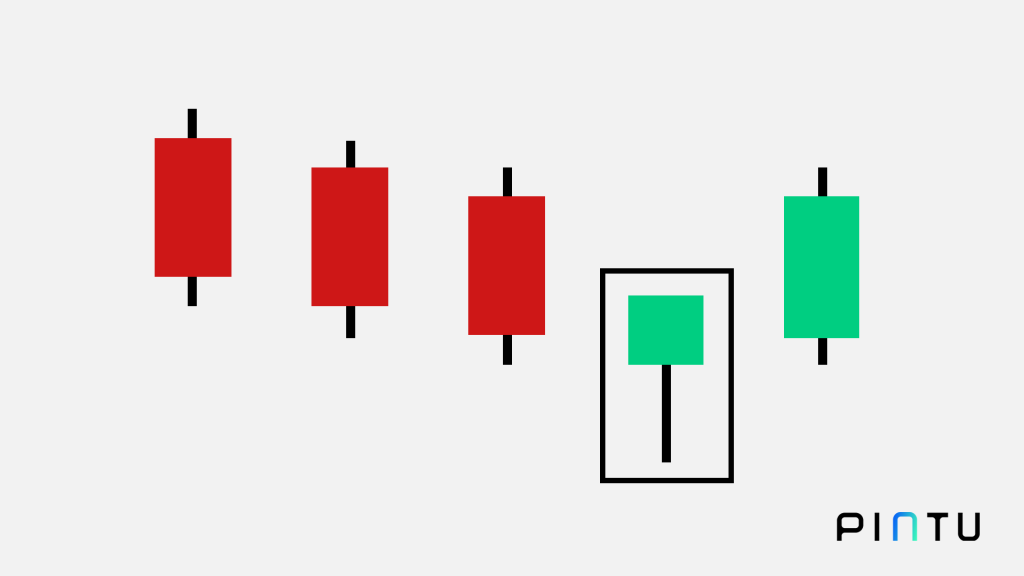
Bullish hammer is characterized by a candlestick that resembling a hammer with a green body at the end of downtrend then followed by an uptrend. This pattern indicates the bearish trend has over and will turn into a bullish trend.
- Morning Star
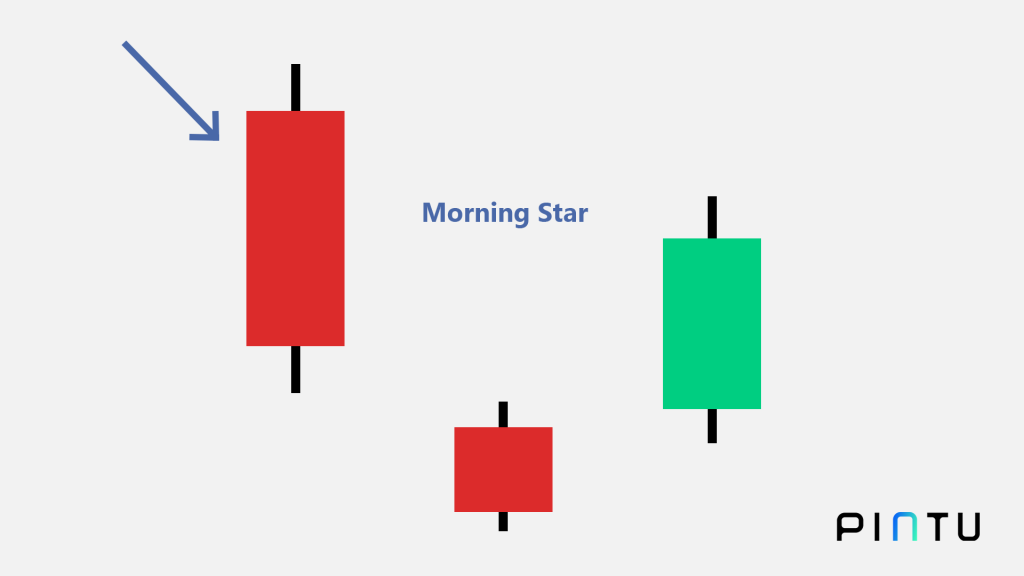
Morning star has candlestick with a small red or green body under the candlestick with a large red or green body. This pattern generally indicates the end of a downtrend and a signal for an uptrend reversal.
- Three White Soldier
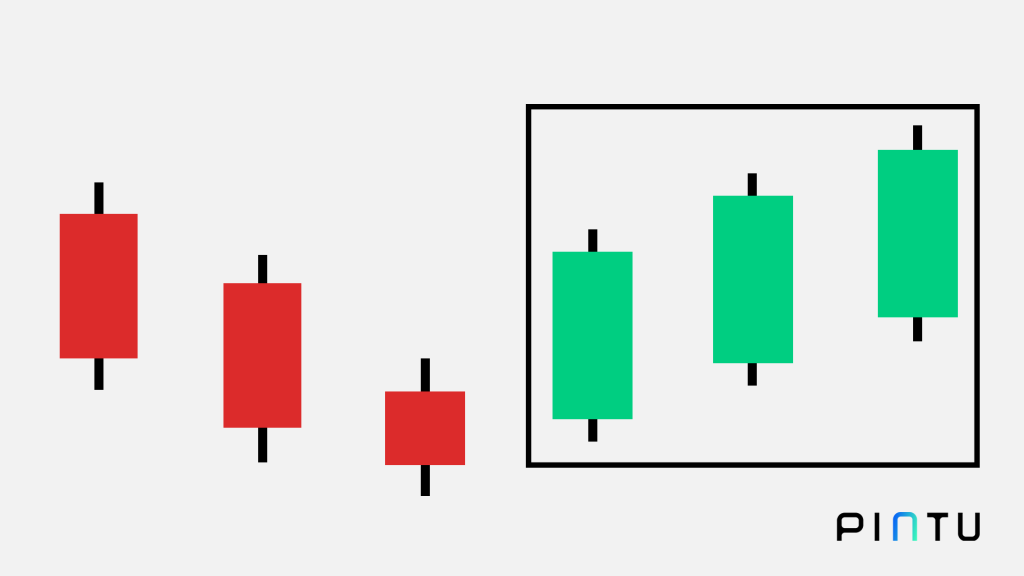
Three white soldier consist of three green candlestick that are shaped like ascending stairs. The body of three candlesticks are quite long and tend to have short wicks. This pattern shows that there is consistent buying pressure after experiencing a downtrend.
- Bullish Engulfing Candle
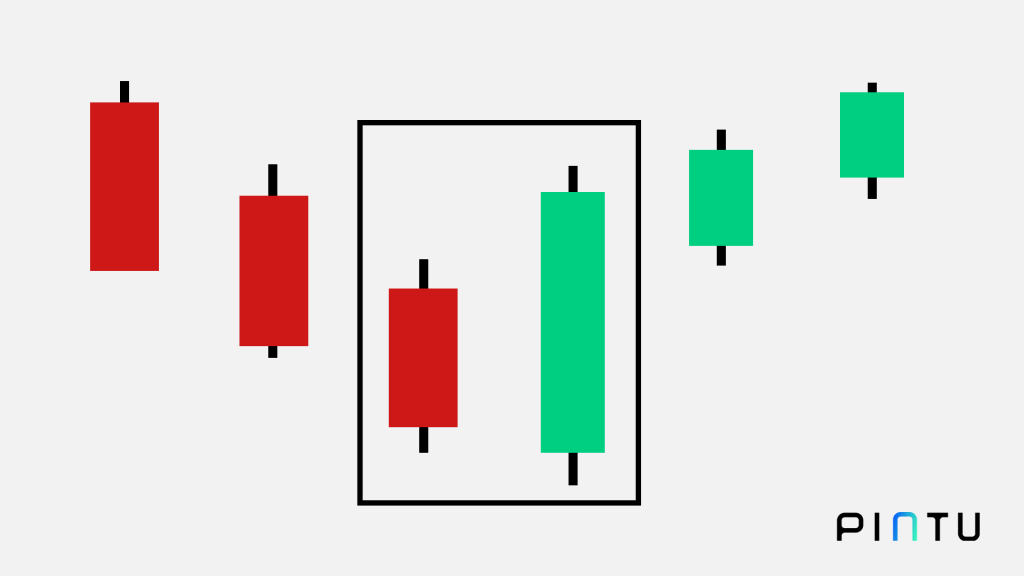
A bullish engulfing candle occurs when a green candlestick completely ‘engulfs’ a red candlestick at the end of downtrend. It means the green candlestick from the open side has a lower price, but from the close side, it has a higher price than the red candlestick. The higher the green candlestick, the stronger the signal of future price reversal trend. Because it indicates a large buying trend.
- Piercing Line
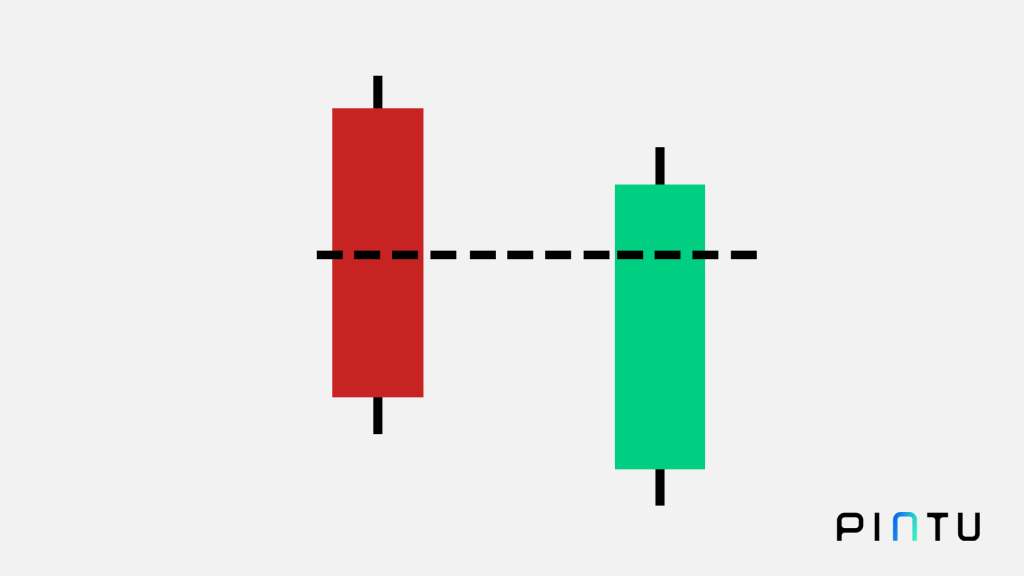
Piercing line is a pattern that shows a decline in price, but it is then followed by buying pressure. This is reflected in the first candlestick that was followed by a green candlestick which had closing price at least more than half of the candlestick. This indicates that many investors are interested in buying at the lowest price position, thus potentially turning asset’s prices up.
Also Read: 4 Crypto Trading Indicator You Should Know
Bearish Reversal Candlestick Pattern
In addition to bullish patterns, candlesticks can be used to forecast the movement of a bearish trend. As the name implies, a bearish reversal candlestick pattern indicates a price reversal from an uptrend to a downtrend.
This is several types of candlestick that show bearish signals:
- Bearish Harami
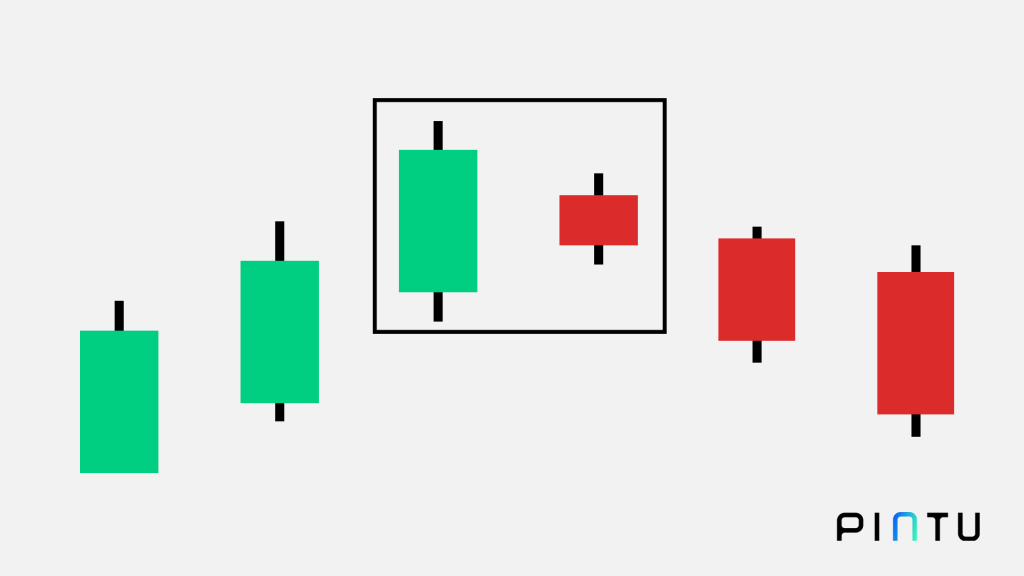
Bearish harami can be identified if a large green candlestick appears in an uptrend movement and is followed by a small red candlestick whose entire body does not exceed the top or bottom of the previous candlestick body. This pattern shows the possibility of a price correction.
2. Dark Cloud Cover
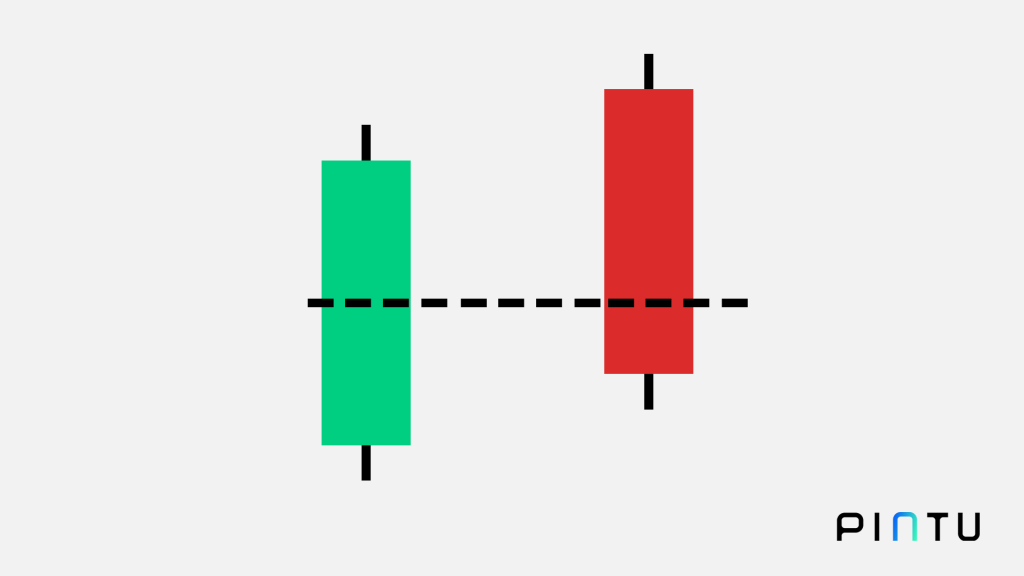
Dark cloud cover is the opposite pattern of the piercing line candlestick. This pattern consists of a green candlestick followed by a red candlestick whose closing price is at least more than half of the previous green candlestick. It means that there was an attempt to be bullish, but instead, there was a sell-off which in the end made the momentum go backwards. This also shows the price at the end of uptrend movement.
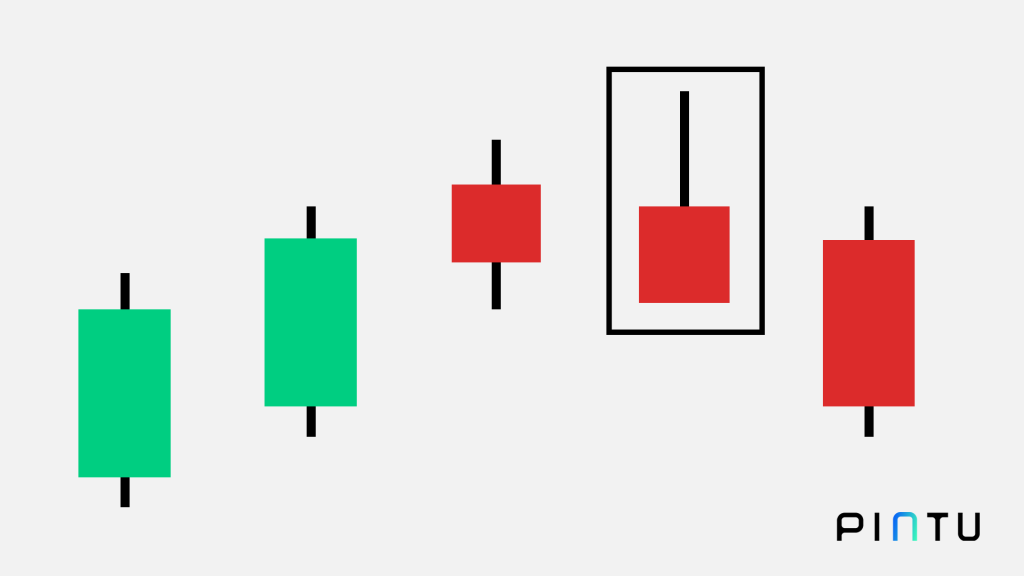
3. Hanging Man
Hanging man is a pattern that occur when there is a single red candlestick with a long downward wick that appears at the top of an uptrend. Long downward wick indicate that there is strong selling pressure. Therefore, the presence of a hanging man can suggest the potential for a bearish reversal.
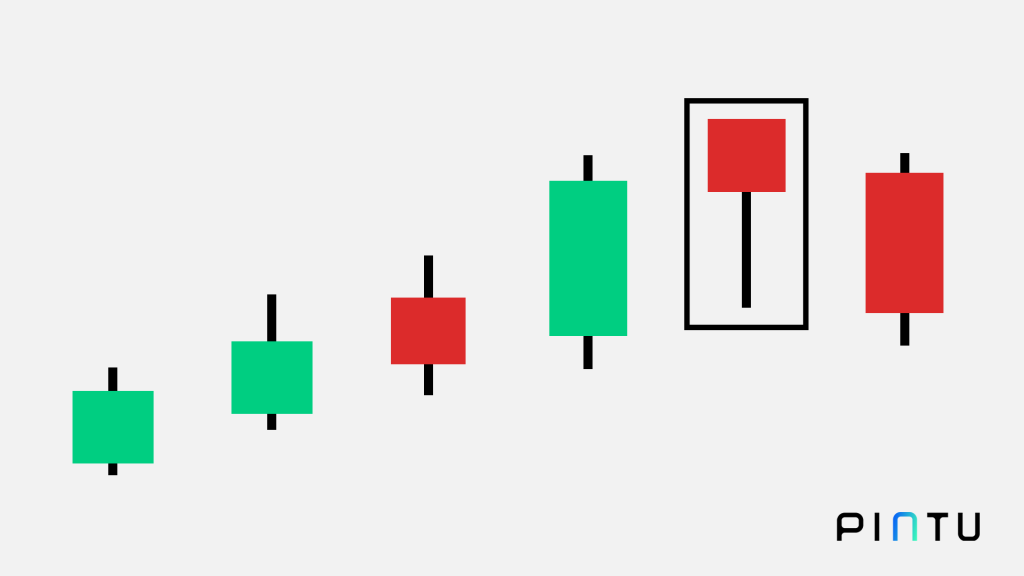
4. Shooting Star
Shooting star pattern is formed whenever a red candlestick appears on an uptrend movement. But, the green candlestick must have a thick body while the red candlestick has a body that tends to be small and has a long upwards wick. This suggested the price had gone up, but instead closed below the opening price.
5. Three Black Crows
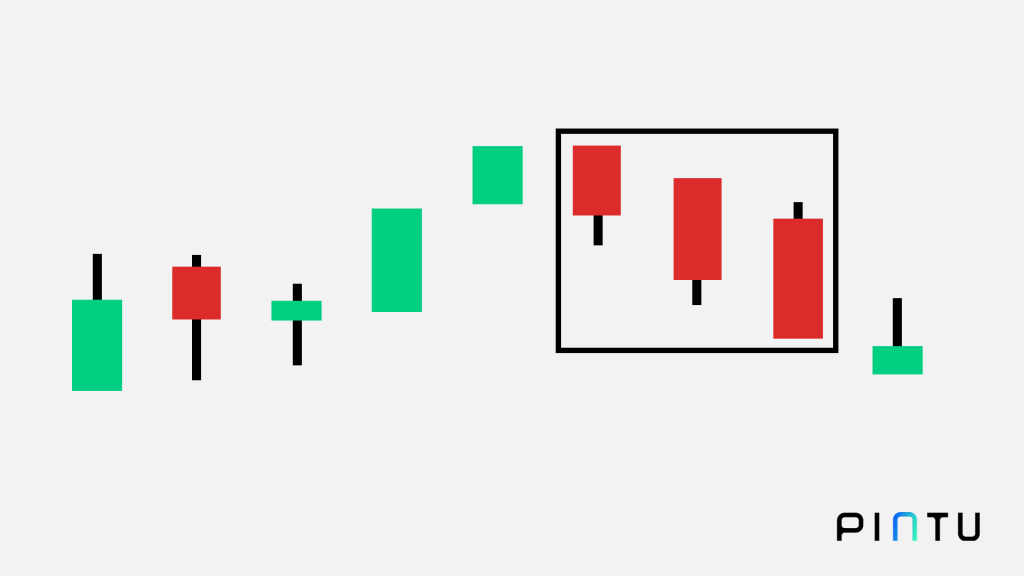
Three black crows pattern is the opposite of the three white soldiers pattern that was mentioned in the bullish pattern section earlier. This pattern shows the appearance of three consecutive red candlesticks shaped like descending stairs. One of the characteristics of this pattern is that the last two candlestick have an opening price that is in the middle of the previous candlestick. Then, the closing price is also lower than the previous candlestick.
Also read: What Is Bull and Bear Market, and How to Tell the Difference?
Candlestick Continuation Pattern
If the two previous section discussed about candlestick patterns that signal a reversal price movement, here are the types of candlestick that do not show any trend changes in market. This pattern is also known as continuation pattern which indicates that price movements will be in line with the existing price trend, whether it is an uptrend or downtrend.
- Doji
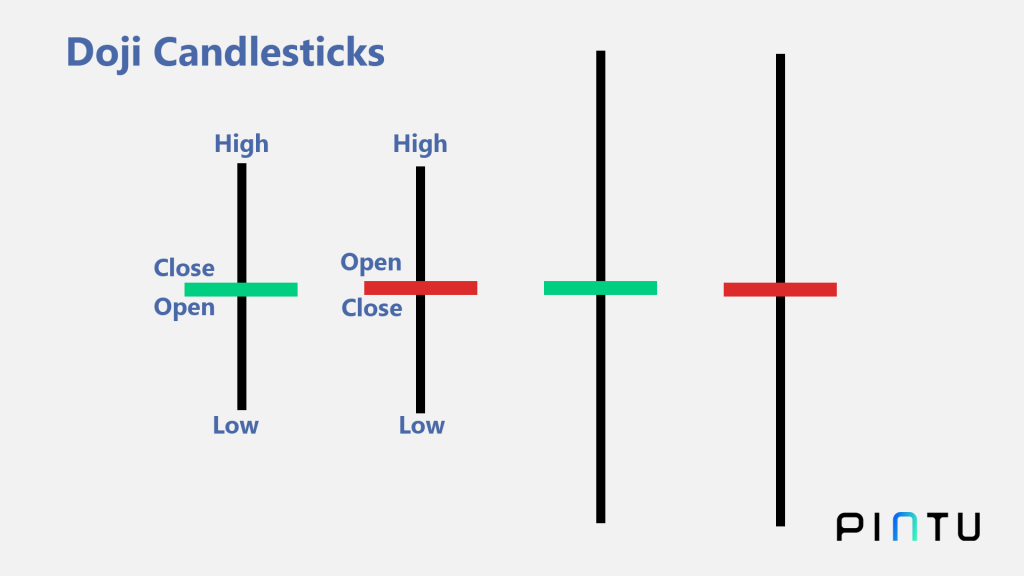
Doji is a candlestick that has a body that tends to be thin in the middle and a wick that tends to be equal. This patterns suggested a neutral signal because the opening and closing price are almost the same. This candlestick also shows the market’s doubts about the real value of the asset.
2. Spinning Top

Spinning top pattern has a larger body in the middle with a longer wick than doji candlestick. Generally, the same sized wick suggested a period of break as market pressures are losing control. This patterns also shows no significant price changes.
Reading a Candlestick at Pintu Apps
If you already understand how to read candlestick patterns, don’t forget to try implementing them when making an investment decision on Pintu Apps. Through Pintu, you can invest in various crypto assets such as BTC, BNB, ETH, and others safely and easily.
Pintu is also compatible with popular wallets such as Metamask to facilitate your transactions. Download the Pintu app on Play Store and App Store! Your security is guaranteed because Pintu is regulated and supervised by Bappebti and Kominfo.
Besides making transactions, in the Pintu Apps, you can also learn more about crypto through various Pintu Academy articles which are updated every week! All Pintu Academy articles are made for knowledge and educational purposes, not as a financial advice.
Reference
Alexandria, Candlesticks, CoinMarketCap, accessed on 7 September 2022
Bearish Candlestick Patterns You Should Know, Bit Panda, accessed on 7 September 2022
Bullish Candlestick Patterns in Crypto Trading You Should Know, Bit Panda, accessed on 7 September 2022.
Connor Blenkinsop, How to Predict Crypto Price Trends, Explained, CoinTelegraph, accessed on 7 September 2022
Cory Mitchell, Understanding Basic Candlestick Charts, Investopedia, accessed on 7 September 2022.
Mariana Galstyan, Using Bullish Candlestick Patterns To Buy Stocks, Investopedia, accessed on 7 September 2022
Sam Oimet, A Beginner’s Guide to Candlesticks, Coindesk, accessed on 7 September 2022
Share
Related Article