Market Analysis May 15th 2023: BTC Shows Weakness, Records a 6% Drop in Seven Days

The crypto market has yet to show any bullish signs, with both Bitcoin and Ethereum experiencing significant declines of 6% and 3.5% respectively. The negative movement in the crypto market is in line with the statement made by the US Treasury Secretary, who predicted a possible default on the nation’s debt. A full analysis of the market is provided below.
The Pintu trading team has gathered critical information and analyzed the general economic situation and the crypto market’s movements over the past week. However, it should be noted that all information in this Market Analysis is intended for educational purposes, not as financial advice.
block-heading joli-heading" id="market-analysis-summary">Market Analysis Summary
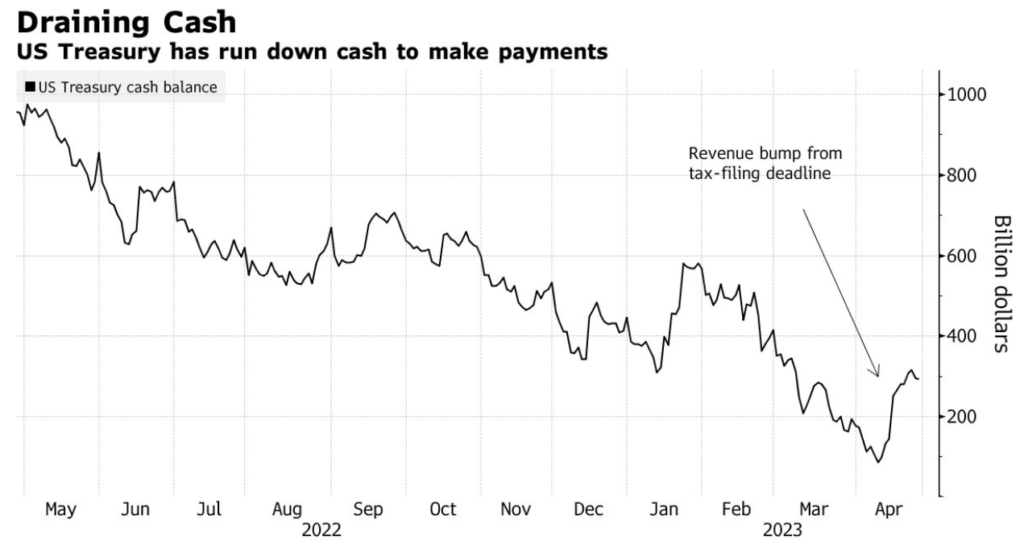
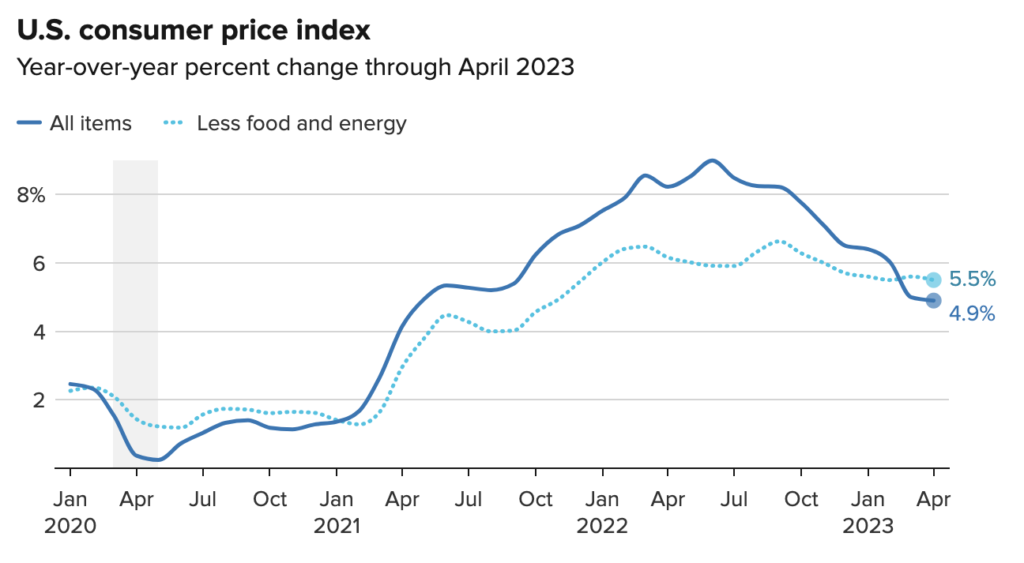
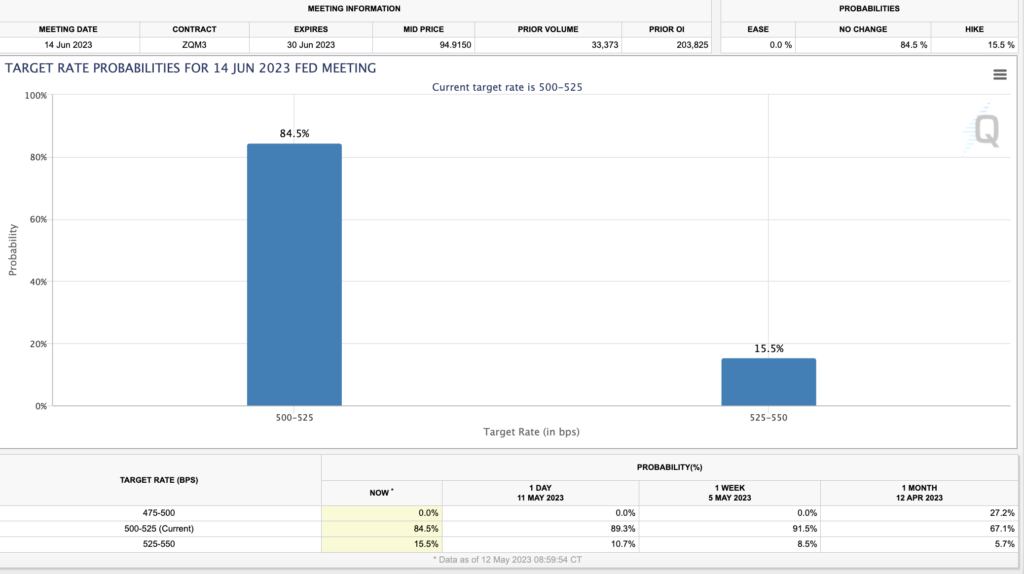
- 📉 The US Treasury is running out of cash, while the inflation rate fell to 4.9% in April, below the previous consensus estimate of 5%, and the probability of a target rate at the June meeting has risen to 15.5%.
- 📈 Jobless claims increased, with initial claims rising to 264K and continuing claims reaching 1813K.
- 👁️ The CPI rose 0.4% in April, while consumer sentiment fell to 57.7.
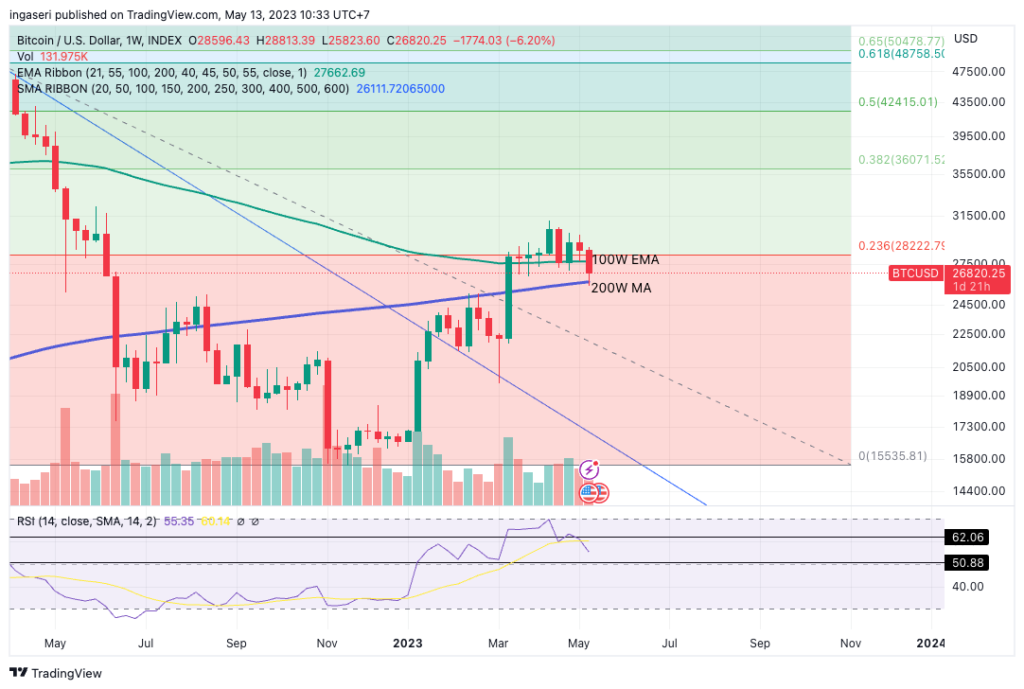
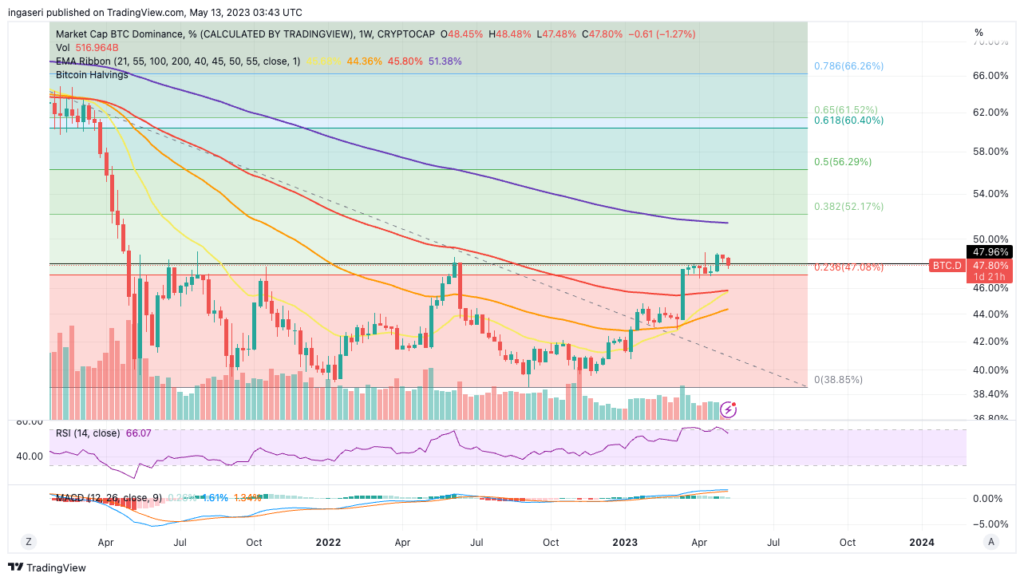
- ✍🏻 BTC fell 6% and ETH fell 3.5%. The BTC dominance has declined and is currently trading above its historical resistance level of 48%.
Macroeconomic Analysis
On May 1, U.S. Treasury Secretary Janet L. Yellen issued a stern warning to the U.S. Congress that if it fails to raise or suspend the debt limit, the United States could run out of money to cover government expenses by June 1. This situation has increased the urgency for President Joe Biden and lawmakers to quickly reach an agreement to avoid a default on U.S. debt.
The Treasury Secretary even wrote directly to the Speaker of the U.S. House of Representatives, Kevin McCarthy. In her letter, the Treasury Secretary stated, “After reviewing recent federal tax receipts, our best estimate is that we will be unable to continue to meet all of the government’s obligations by early June, and possibly as early as June 1 if Congress does not raise or suspend the debt limit before then. This estimate is based on currently available data because federal revenues and expenditures are inherently volatile, and the actual date on which the Treasury exhausts extraordinary measures could be several weeks later than these estimates.
There is a high-risk option for asserting the validity of the national debt, which is to invoke the 14th Amendment. However, it comes with the significant risk of litigation.
In the absence of this option, it is certain that the Treasury will use its available cash and revenues to guarantee timely payments on the national debt. The Treasury believes it still has sufficient revenues to meet its interest obligations on the debt, provided it significantly reduces other spending to achieve a balanced budget. This action is intended to prevent a debt default crisis, but carries the significant risk of an economic downturn and political unrest.
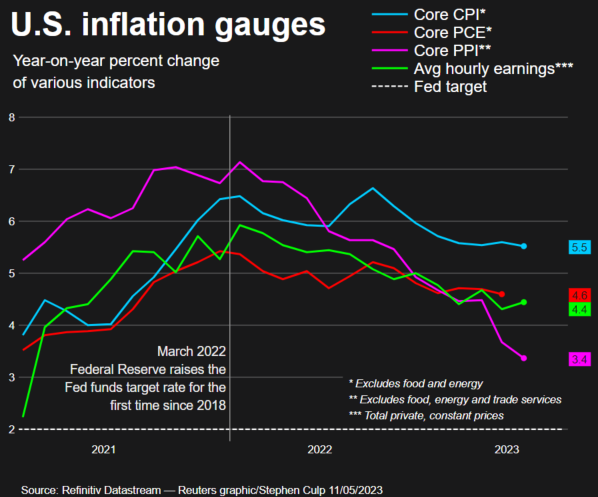
Behind the shadow of the US debt default, there was positive news on the US annual inflation rate, which fell to 4.9%. This is below the consensus estimate of 5%. However, despite the decline in inflation, the Consumer Price Index actually rose by 0.4% on a seasonally adjusted basis in April. This follows a 0.1% increase in March. This increase was influenced by rising shelter costs, used car prices, and gasoline prices. It can be concluded that this rate of increase represents the lowest annual pace since April 2021, and the results are in line with the consensus.
Another piece of positive news that triggered a market reaction was when futures moved into positive territory and Treasury yields declined. In addition, as far as the pace of price increases is concerned, the Federal Reserve’s (Fed) efforts to maintain inflation have shown results. These efforts have been ongoing since March 2022, during which time the U.S. central bank has implemented ten consecutive rate hikes, resulting in a cumulative increase of 5 percentage points. However, these rate hikes have also had an impact on benchmark borrowing rates, which have reached their highest levels in almost 16 years.
The Fed’s efforts have also had a significant impact on cooling the Consumer Price Index (CPI), which peaked at around 9% in June 2022. Still, inflation remains well above the Fed’s 2% annual target.
The data present a mixed picture of the inflation situation, offering both positive and negative aspects for Fed officials to consider when determining the next appropriate steps regarding interest rates.
In terms of probabilities, the odds of a rate hike at the June meeting have risen to 15.5% from 8.5% last week.
The announcement of the CPI reading came shortly after the US Bureau of Labor Statistics (BLS) also released data regarding a 253,000 increase in non-farm payrolls for April. The increase was higher than expected, indicating a strong labor market despite the Fed’s efforts to tamp down demand.
On the other hand, during the recent approval of the latest rate hike, the Fed removed the suggestion that future hikes are necessary. However, decisions will continue to be based on incoming data.
In the week ending May 6th, initial claims for state unemployment benefits rose by 22,000 to a seasonally adjusted 264,000. This is the highest level since October 2021. Prior to that, a Reuters survey of economists showed that most had predicted 245,000 claims for the same week.
Within the labor market, there is a four-week moving average indicator that is considered reliable as it smooths out weekly fluctuations. This indicator increased by 6,000 to 245,250, the highest level since November 2021.
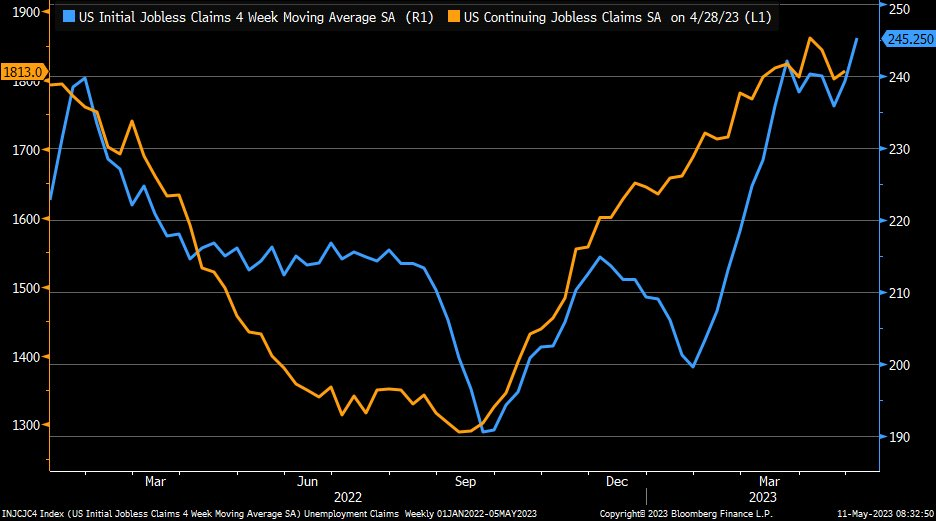
In the labor sector, the number of individuals continuing to receive benefits after their first week of aid, which is an indicator of hiring activity, increased by 12,000 to 1.813 million for the week ending April 29, according to the claims report. Ongoing claims, often referred to as continuing claims, remain relatively low by historical standards, suggesting that some of the previously laid-off workers are quickly securing new employment opportunities.
On Thursday, the Labor Department released another report on the Producer Price Index (PPI), which indicated that final demand rebounded by 0.2% in April, following a 0.4% decline in March.
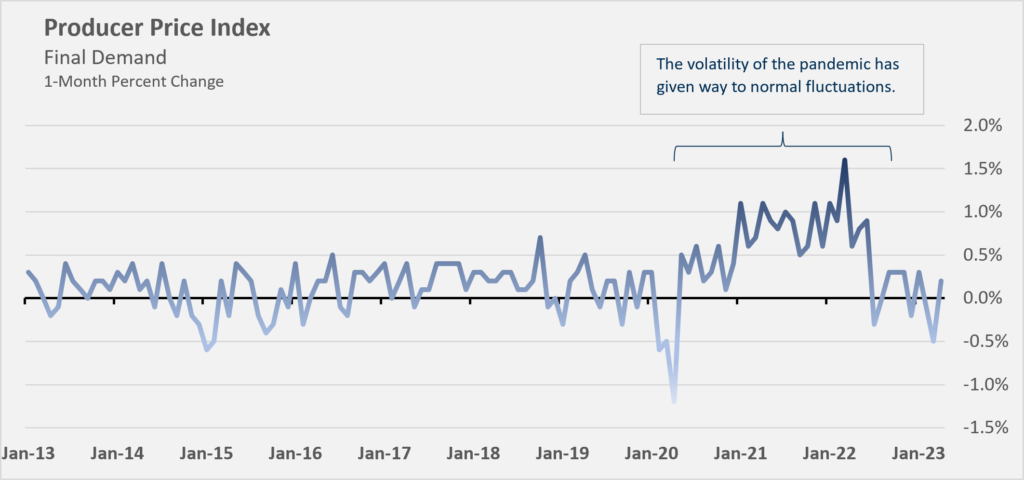
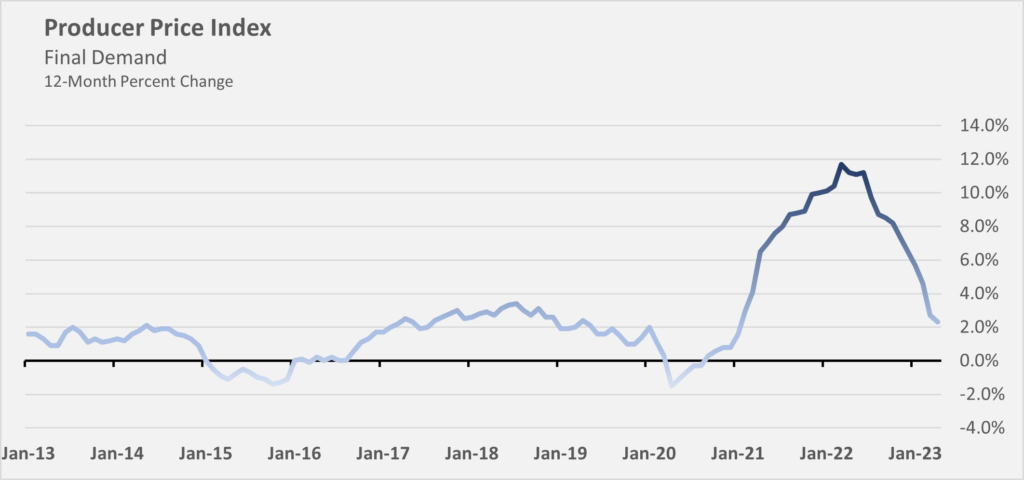
In April 2023, the year-over-year Producer Price Index (PPI), which strips out monthly fluctuations, rose 2.3%. This is the smallest year-over-year increase since January 2021, following a 2.7% increase in March. While inflation remains higher year-over-year, the rate of increase is slowing and is well down from its peak of 11.7% in March 2022. As the peaks from mid-2022 are excluded from the year-over-year calculation, inflation is expected to continue to stabilize.
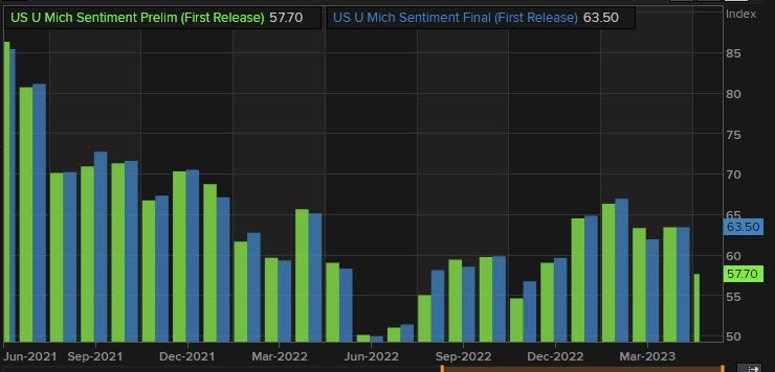
One factor in the stability of inflation is the measurement of consumer sentiment, as measured by the University of Michigan in its preliminary reading of consumer sentiment for May, which fell to 57.7 from 63.5 in April. This is the lowest reading since November of last year. Even in a Wall Street Journal survey of May consumer sentiment readings, several economists agreed on a reading of 63, but it fell short of expectations.
Speaking of inflation, the May survey indicated that U.S. citizens’ short-term inflation expectations had moderated somewhat. Currently, U.S. individuals expect an average inflation rate of around 4.5% over the next few years. Looking back at the April data, inflation expectations had risen sharply to 4.6% from 3.6% in March. Over the next five years, inflation is expected to rise to 3.2%, up from 3% in April. This is the highest inflation reading since 2011.
BTC & ETH Price Analysis
BTC fell below the support of the 100-week exponential moving average (EMA), plunging 6% in one week, before bouncing off the historically significant resistance of the 200-week EMA, currently at the $26,000 level. This level is a key support level to watch, as if BTC breaks below it, we could see further downside towards the 200-day moving average at the $22,000 level. It is important to note that there is still support at the Relative Strength Index (RSI) level of 50. However, as BTC approaches this barrier, be prepared for increased volatility.
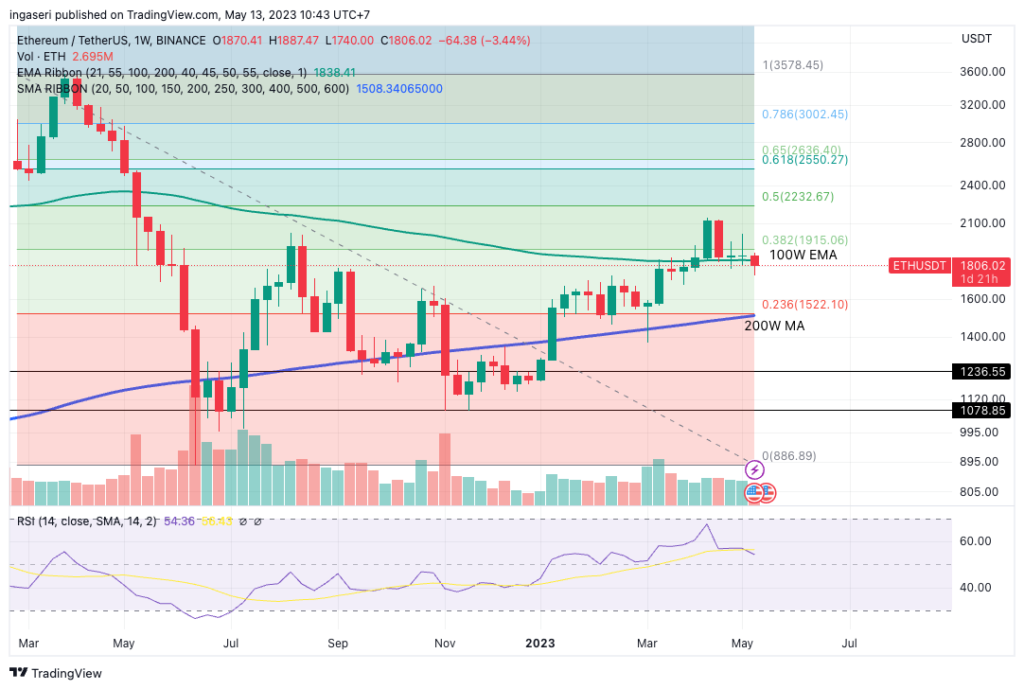
On the other hand, similar to BTC, ETH experienced a decline of 3.5% in one week. The decline observed in ETH can be considered slightly better compared to BTC for the second consecutive week. It is worth noting that ETH appears to be breaking down from the support of the 100-week exponential moving average (EMA) and still has strong support at the 1518 level, which corresponds to the 200-week moving average (MA).
Meanwhile, BTC Dominance has experienced a second week of decline and is now trading above its historical resistance level at 48%. Further declines from its resistance are expected if it manages to close below the 48% level.
On-Chain Analysis
- 📊 Exchange: As the exchange reserve continues to rise, it indicates higher selling pressure. Net deposits on exchanges are low compared to the 7-day average. Lower deposits can be interpreted as lower selling pressure.
- 💻 Miners: Miners’ are selling more holdings compared to its one-year average. Miner’s revenue is in a moderate range, compared to its one-year average.
- 🔗 On-chain: More investors are selling at a profit. In the middle of a bull market, it can indicate a market top. Long term holders’ movement in the last 7days were lower than the average. They have a motive to hold their coins. Investors are in an anxiety phase where they are currently in a state of moderate unrealized profits.
- 🏦Derivatives: Long position traders are dominant and are willing to pay to short traders. Buying sentiment is dominant in the derivatives market. More buy orders are filled by takers. As open interest decreases, it indicates investors are closing futures positions and possibility of trend reversals. In turn, this might trigger the possibility of long/short-squeeze caused by sudden price movement or vice versa.
- 🔀 Technicals: RSI indicates a neutral condition. Stochastic indicates a neutral condition where the current price is in a moderate location between the highest-lowest range of the last 2 weeks.
News About Altcoins
- ⚽ Chiliz Chain mainnet launched the first blockchain infrastructure for sports and entertainment. Chiliz (CHZ), the blockchain technology pioneer behind the Socios.com and Fan Token digital sports ecosystem with over 2 million wallets, has launched the Chiliz Chain mainnet. Chiliz Chain provides the infrastructure for sports teams and brands to build Web3 products that foster greater interaction and direct relationships with their communities. Chiliz Chain is a Layer 1 blockchain that is EMV compliant and utilizes the Proof of Staked Authority (PoSA) consensus mechanism.
- 💸 Arbitrum Holders Ready to Claim Rewards! The Ethereum Layer 2 blockchain, Arbitrum, has distributed $6.2 million worth of Ether (ETH) tokens to the Decentralized Autonomous Organization (DAO). The distribution was announced on the official Arbitrum Twitter account on May 9, 2023. The ETH tokens distributed came from the base fees and excess revenue generated from network transactions. The DAO successfully raised a total of 3,352 ETH. Eligible token holders who delegated their ARB tokens can now claim their rewards.
News from the Crypto World in the Past Week
- 🔝 Elon Musk Tweets Milady Meme, NFT Price Floor Soars on OpenSea! On May 10, Tesla CEO Elon Musk shared an NFT meme image representing a digital artwork of a character from “The Legend of the Iron Lady” game. The tweet garnered over 3,600 likes on Twitter, pushing the collection to the top trending position on the OpenSea NFT marketplace. The initial price reached an all-time high of 7.3 ETH (approximately $13,700).
Cryptocurrencies Market Price Over the Past Week
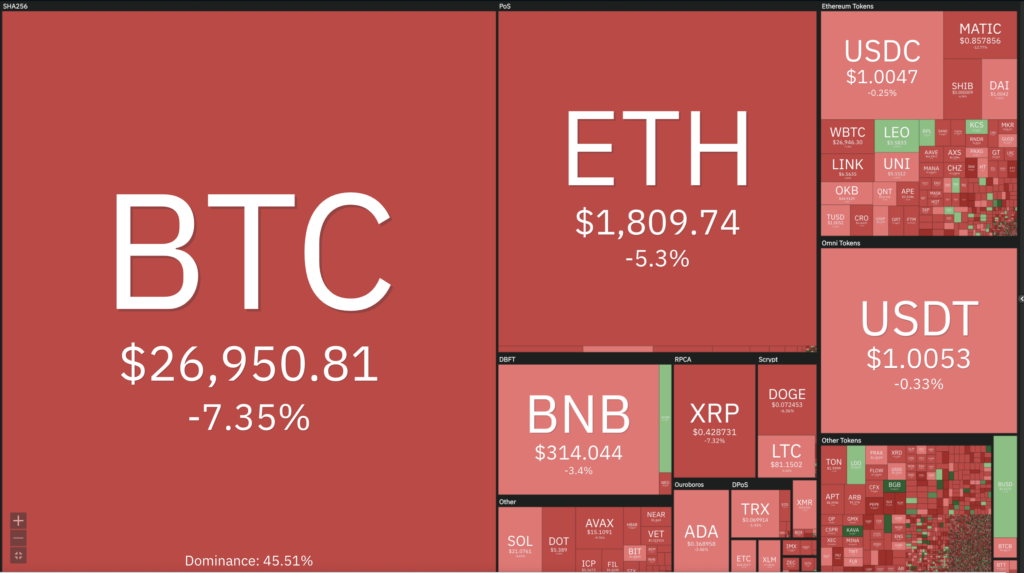
Cryptocurrencies With the Best Performance
- Rocket Pool (RPL) +4,30%
- Stacks (STX) +4,00%
- WOO Network (WOO) +3,09%
- Pax Gold (PAXG) +1,77%
Cryptocurrencies With the Worst Performance
- Pancake Swap (CAKE) -25,65%
- Immutable X (IMX) -18,49%
- Optimism (OP) -15,82%
- Lido DAO (LDO) -14,77%
References
- Solana Mobile, Saga orders now open to everyone, solanamobile.com, accessed on May 14 2023.
- Chiliz Official, CHILIZ AIMS TO TAKE SPORTS FROM WEB2 TO WEB3 AS IT COMPLETES PUBLIC LAUNCH OF ITS NEW LAYER-1 BLOCKCHAIN, Medium.com, accessed on May 14 2023.
- Arbitrum Official, Big news Arbinauts!, Twitter, accessed on May 14 2023.
- Ana Paula Pereira, Arbitrum’s DAO to receive over 3,350 ETH in revenue from transaction fees, Cointelegraph.com, accessed on May 15 2023.
- Toby Bochan, Elon Musk Tweets a Milady NFT, Floor Price Soars on OpenSea, Coindesk.com, accessed on May 15 2023.
Share
Related Article
See Assets in This Article
BTC Price (24 Hours)
Market Capitalization
-
Global Volume (24 Hours)
-
Circulating Supply
-


