Market Analysis 11 December 2022: 2023 Economic Prediction and Stagnant Bitcoin
Several economic projections for the next year have been published. The potential for a recession in the US could be an essential factor for the crypto market and world economy. In addition, the 10-2 year yield curve reaches its highest inversion rate since the 1980s.
Pintu’s trader team has collected various data from the crypto market in the past week, summarized in this Market Analysis. However, please note that all information in Market Analysis is for educational purposes, not financial advice.
Market Analysis Summary
- 🏦 The Fed’s interest rate is likely to remain high throughout 2023. This is done to counter inflation.
- 📈 At the December 2022 meeting, The Fed is likely to increase interest rates by 50 bps, followed by two 25 bps increases in 2023. The benchmark interest rate is expected to be around 5% throughout 2023.
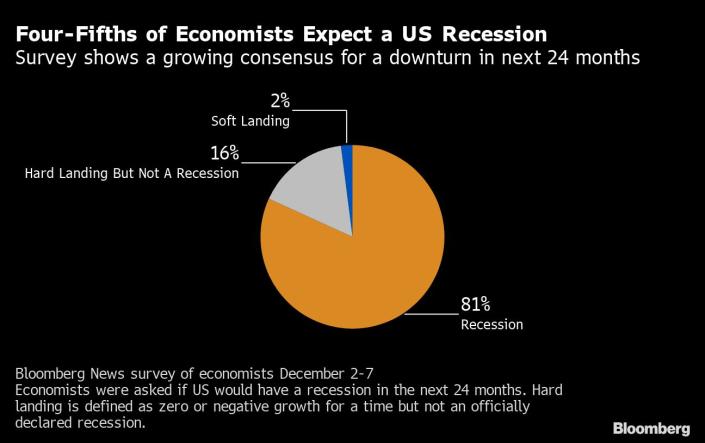
- 📉 81% of economists agree with the possibility of a US recession in 2023, while 76% of them predict a global recession. The Fed is trying to create a soft landing while the market expects a hard landing.
- ⚖️ Bitcoin is still moving sideways and forming a bullish flag pattern. There is a possibility that BTC will test the upper limit at around $19,000 and continue a correction to $15,000.
- 🔍 Ethereum is likely to experience a short-term rally. However, ETH is still in a long-term bearish pennant pattern. Resistance is at $1450-$1500, where the price is likely to consolidate and fall again.
Macroeconomic Analysis
Wall Street will be disappointed because the Federal Reserve will maintain high-interest rates throughout 2023. Therefore, market expectations of a decrease in interest rates in the second half of 2023 will vanish due to the high likelihood of a recession. Based on signals from The Fed, we expect the interest rate at the beginning of 2023 to be around 5%. Additionally, in the December 2022 FOMC, The Fed is likely to raise interest rates by 50 bps, followed by two increases of 25 bps in 2023. Throughout the year, the interest rate hovers around 5%.
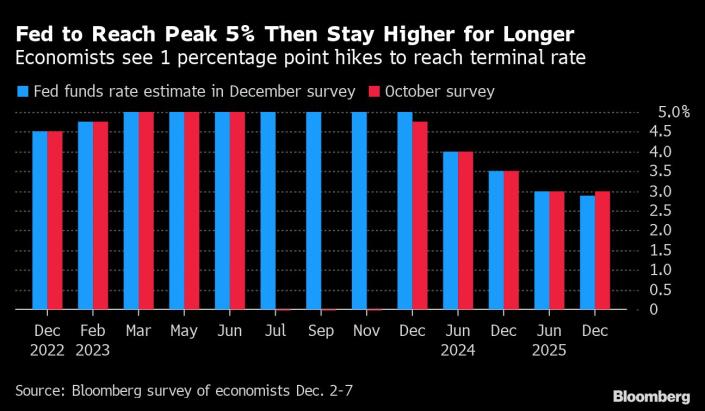
The Fed Chairman has mentioned that higher interest rates are needed for some time to suppress price increases. Looking at the chart below, we can see that the Federal Fund rate is expected to reach its peak next year, where we will see some easing in the following years. Note that we must be cautious as market optimism that inflation has peaked may be misplaced. The US is likely to enter a recession in the middle of next year and the full impact of the Fed’s higher interest rates will be felt at that time.
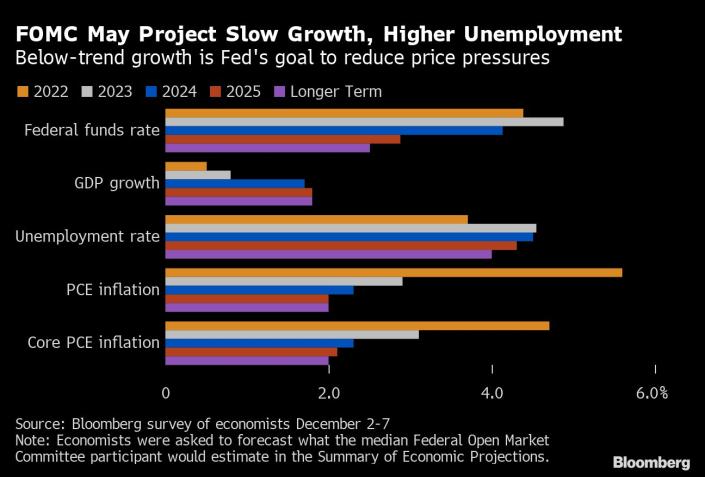
The consensus among economists is that 81% agree that there is a possibility of a US recession, while 76% of them predict a global recession. The question now lies in whether we will see a soft or hard landing. The Fed is working hard to curb inflation and is targeting a soft landing, while the market is anticipating a hard landing with a period of contraction and zero growth.
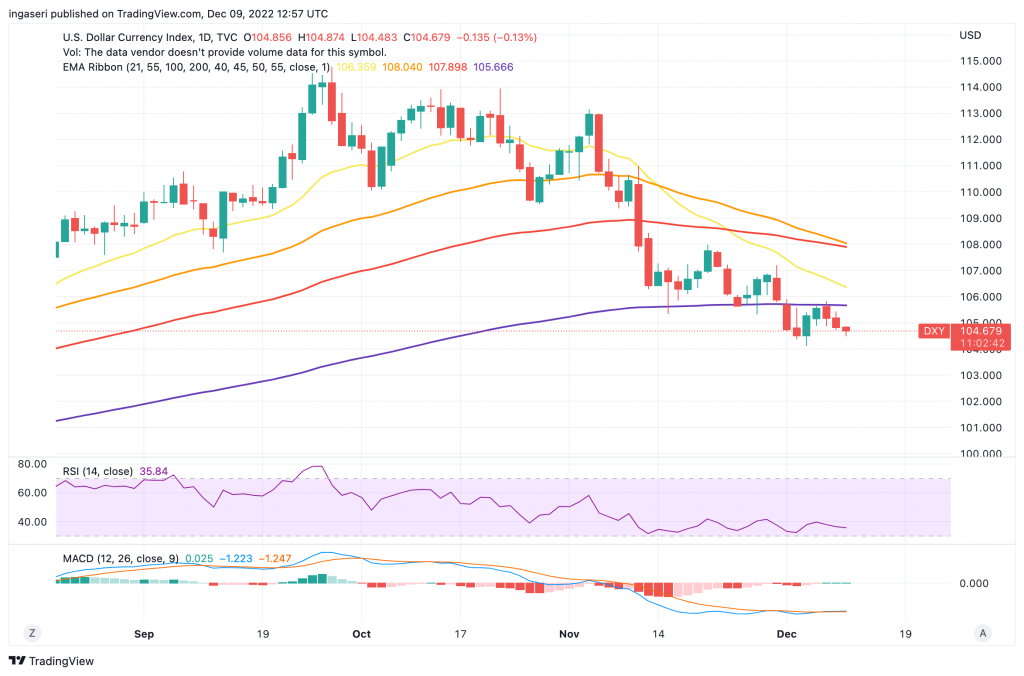
The US Dollar Index (DXY) rose since the start of the week (104,113) and peaked on Wednesday (105,822) before encountering resistance at the 200-days EMA.
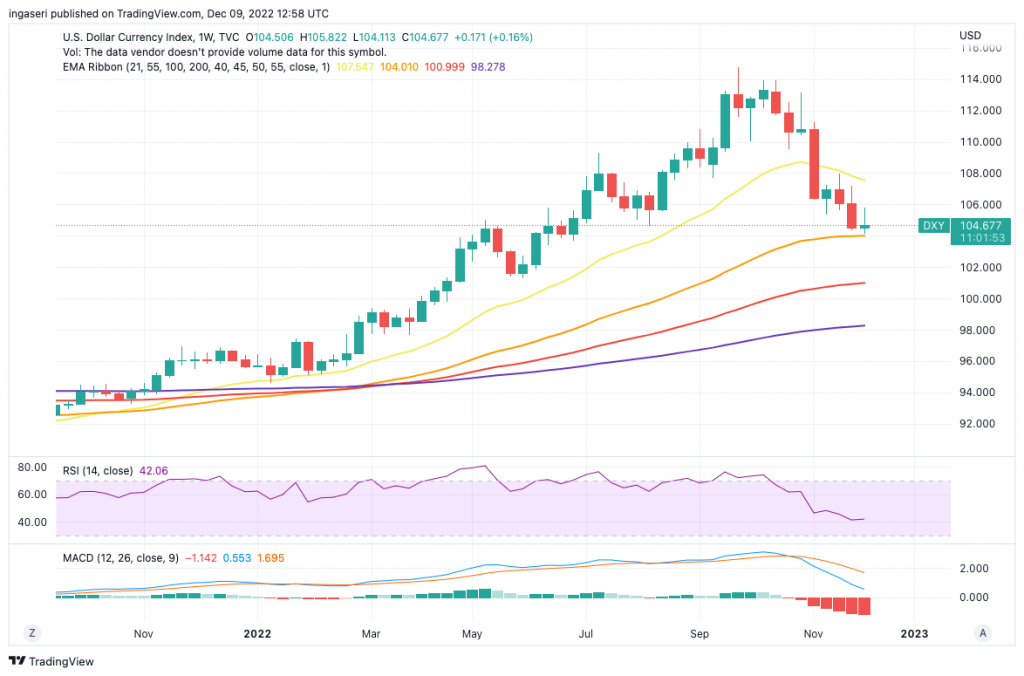
However, on the weekly chart, DXY manages to hold support at the 55-week EMA line. The next weekly candle will be even more pivotal to see whether DXY will experience a further breakdown or reverse its two monthly downtrend.
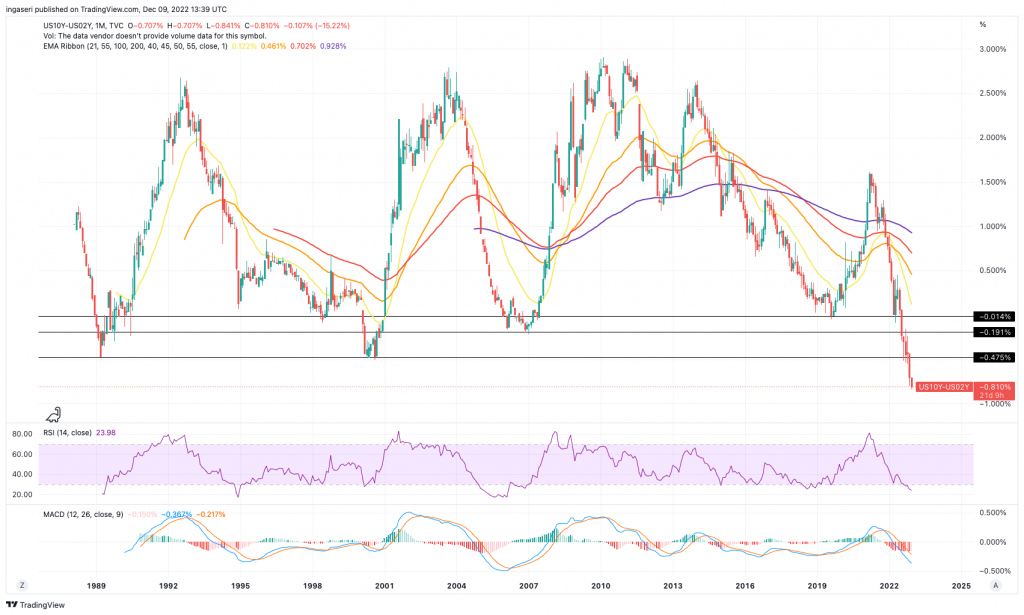
Notice that the 10Y-2Y yield curve experience further inversion to -0,811%, the highest inversion rate since the 1980s.
BTC Price Analysis
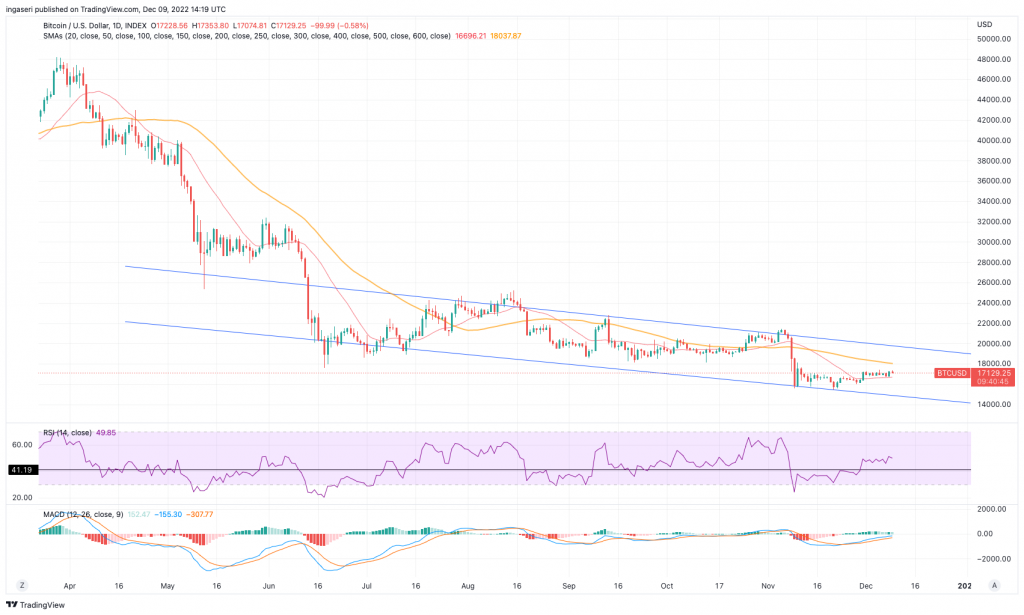
BTC is still in a bullish flag pattern on both the daily and weekly charts. Resistance is at $18,200 and support is at $16,700. BTC seems to still be moving sideways.
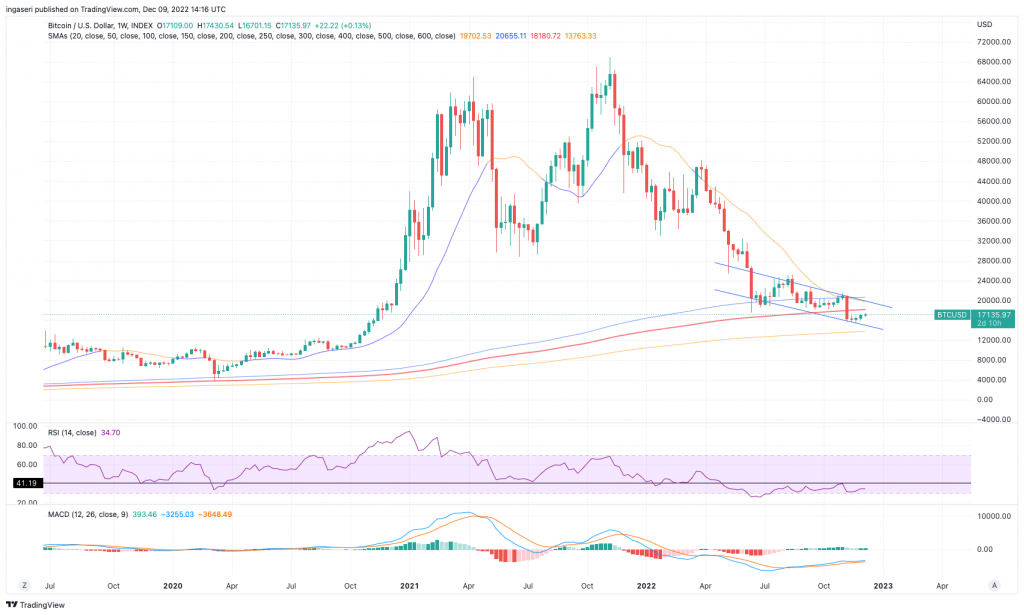
The same applies to the daily price movement, it is predicted that the price will range along the current price pattern. BTC’s price will eventually test the $19,000 (upper limit) again and form another bearish pattern towards the $15,000 level. Considering the overall market sentiment and bearish price potential, rejection from the top trend line and then further correction are very likely to occur.
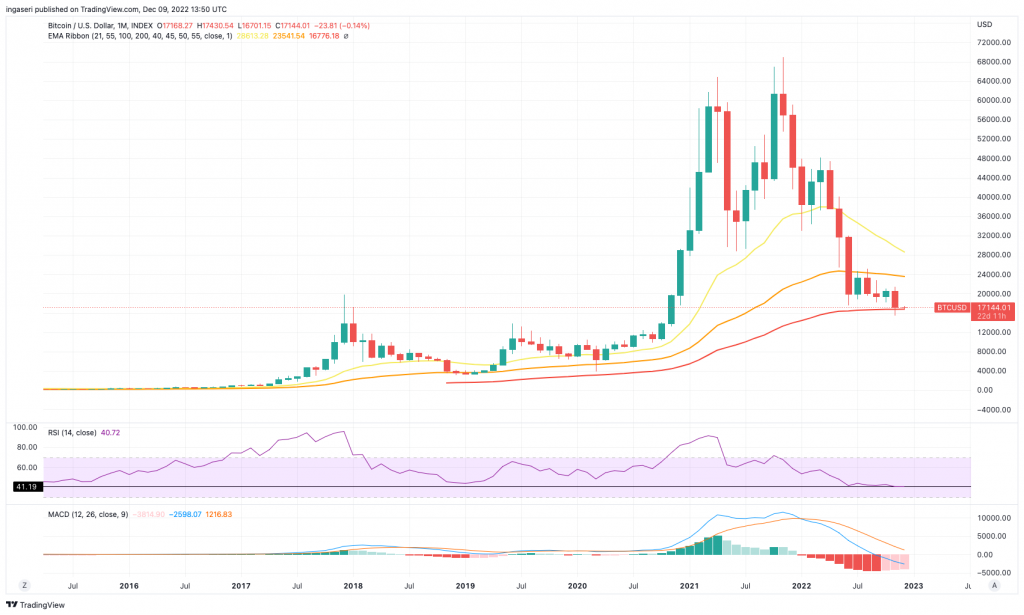
On the monthly chart, we have not seen BTC fall from the EMA 100-month support line as it managed to hold on to it last month. This month’s chart will determine what is to come next year. If we stay above this line and are supported by good macroeconomic policy, there is a possibility of a significant upside in the overall crypto market.
You can read about how to read candlestick charts in the following article “How to Read Candlestick Pattern Easily”.
ETH Price Analysis
ETH is forming a bull flag pattern on its daily chart, there is a possibility of a short-term rally. The resistance is at $1340, the 50-day MA, and the upper limit of the channel is at $1500.
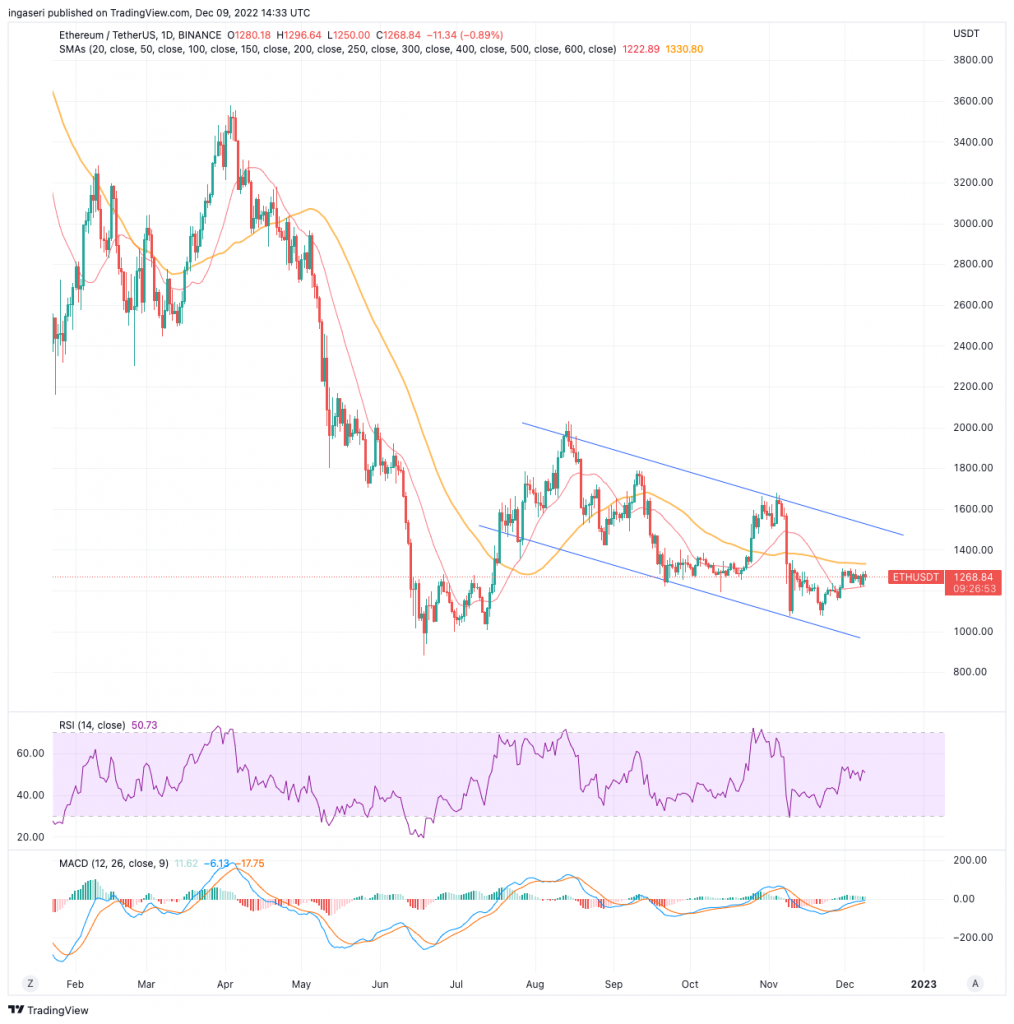
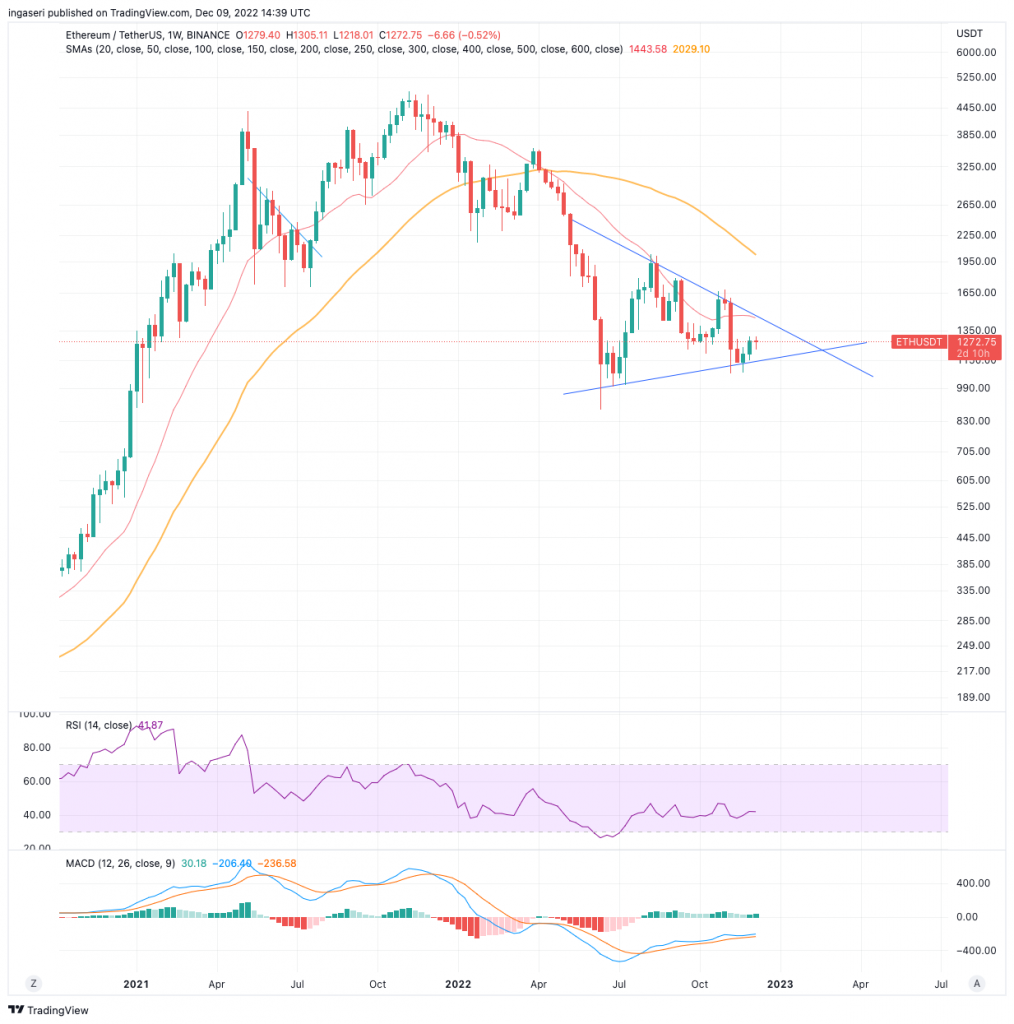
However, in the long term, ETH is still in a bearish pennant pattern. This is in line with what is happening on the daily chart, where we see positive price movement toward the upside. The resistance point is at $1450-$1500, where the price is likely to consolidate and drop again.
On-Chain Analysis
- 📊 Exchange: As the exchange reserve continues to fall, it indicates lower selling pressure. Net deposits on exchanges are high compared to the 7-day average. Higher deposits can be interpreted as higher selling pressure.
- 👨🏻💻 Miners: Miners are selling holdings in a moderate range compared to its one-year average. Miner’s revenue is in a moderate range, compared to its one-year average.
- ⛓ On-chain Indicator: More investors are selling at a loss. It can indicate a market bottom in the middle of a bear market. Long-term holders’ movement in the last 7 days was lower than the average. They have the motive to hold their coins. Investors are in a capitulation phase where they are currently facing unrealized losses. It indicates the decreasing motive to realize loss which leads to a decrease in sell pressure.
- 🏦 Derivatives: Short position traders are dominant and are willing to pay long traders. Buying sentiment is dominant in the derivatives market. More buy orders are filled by takers. As open interest decreases, it indicates investors are closing futures positions and the possibility of trend reversals. In turn, this might trigger the possibility of a long/short squeeze caused by sudden price movement or vice versa.
Altcoin News
- 👾 Axie Infinity Launches Decentralized Governance Pilot Program: The Axie Infinity decentralized governance scheme is being realized with the selection of 700 community members who will play a role in Axie Infinity governance. This is the initial step towards increasing the role of community governance in various aspects of the game.
- 🦧 ApeCoin Staking: ApeCoin launch its staking program called ApeStake. Owners of BAYC, MAYC, and BAKC NFTs can stake APE tokens and NFTs. The ApeStake platform offers several staking options.
More News from Crypto World in the Last Week
- 📝 Sam Bankman-Fried to Appear Before US Legislative Body: SBF or Sam Bankman-Fried, has stated that he will appear before the House Financial Services Committee. SBF will finally provide information about the FTX incident after being asked for testimony by Maxine Waters, the head of the committee.
- ☕ Starbucks NFT: The Starbucks NFT platform, Odyssey, has begun its beta phase for selected users before its full launch in 2023. Odyssey is a loyalty program for Starbucks users that rewards various web3 products such as NFTs. The platform is a collaboration between Starbucks and Polygon and is starting to attract a high level of attention from users.
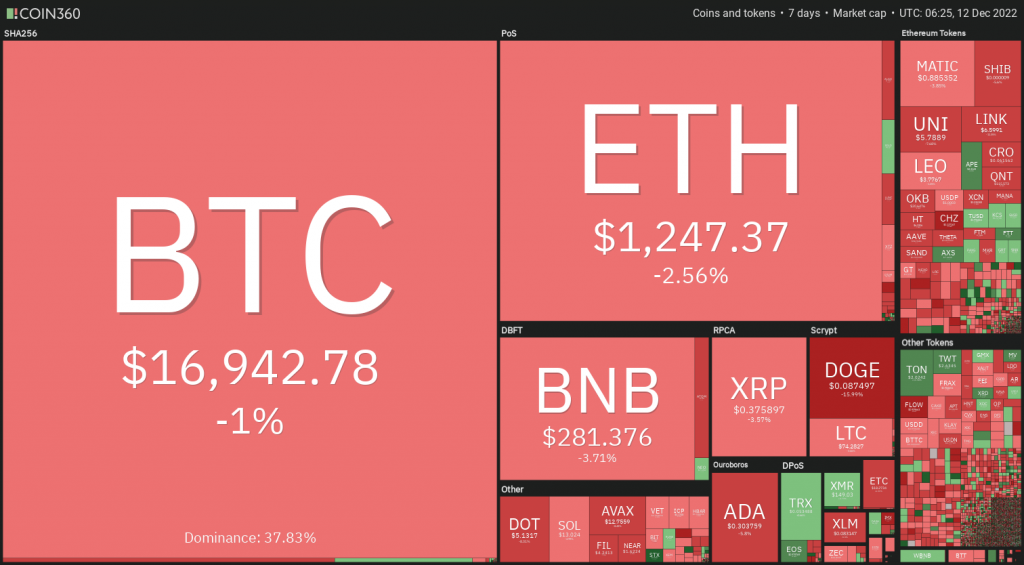
Cryptocurrencies Market Price Over the Past Week
Top Gainers
- Axie Infinity +14,9%
- Trust Wallet (TWT) +8,9%
- Synthetix +8,44%
- ApeCoin +6,53%
Top Losers
- Chiliz (CHZ) -15,48%
- Immutable X -14,53%
- 1INCH Network -13,4%
References
- Axie Infinity, Axie Contributor Initiative Kickoff! – by Axie Infinity, Substack, accessed on 12 December 2022.
- Wu Blockchain, Weekly project updates: 1INCH large unlock, ApeStake, Chainlink Staking v0.1 early access, Substack, accessed on 12 December 2022.
- Liam J. Kelly, Sam Bankman-Fried ‘Willing’ to Testify Before House Financial Services Committee, Decrypt, accessed on 12 December 2022.
- Andrew Hayward, Starbucks Sees ‘Unprecedented Interest’ as Polygon NFT Rewards Platform Launches, Decrypt, accessed on 12 December 2022.
Share
Related Article
See Assets in This Article
SNX Price (24 Hours)
Market Capitalization
-
Global Volume (24 Hours)
-
Circulating Supply
-