Crypto Market Report: Q2 2022

The crypto market goes through the bear and bull market cycles alternately. Unlike other asset markets where each phase can last for years, the cycles of the crypto market move faster. Furthermore, the ups and downs in each phase are much more extreme than in other markets. A popular cryptocurrency can drop as much as 90% in a bear market (Example: Fantom). The crypto market can move so fast, and investors need to be mindful of market trends if they want to make the right decisions. So, to help you, Pintu Academy presents a crypto market report that summarizes essential information from the second quarter of 2022.
Article Summary
- 🪙 In the second quarter of 2022, BTC experienced the worst price movement in more than a decade, and June became the worst month in history, with prices briefly touching $17,600 dollars on June 18th.
- 📉 Layer 1 experienced an average price drop of 50-75%. Avalanche led this decline by around -81% as it was exposed to LUNA and UST assets via the Anchor Protocol.
- 🔻 Like smart contract platforms, the DeFi industry as a whole saw a decline of around 70% in TVL (total value locked) numbers. By July 2022, the DeFi industry’s TVL was only about $70 billion from a high of $250 billion in April 2022. This drastic decline followed the events of LUNA-UST and Celsius.
- 🎮 Although the price of gaming and metaverse crypto assets continues to fall, the blockchain activity in this industry is still very high. The UAW (unique active wallets) figures show a slight reduction in Q2 2022.
- ️⚖️ June 2022 saw a drastic reduction in NFT transaction volume from 1.3 million ETH to around 550 thousand ETH. This 74% drop is the largest volume drop in NFT history.
What Happened to the Crypto Market in Q2?
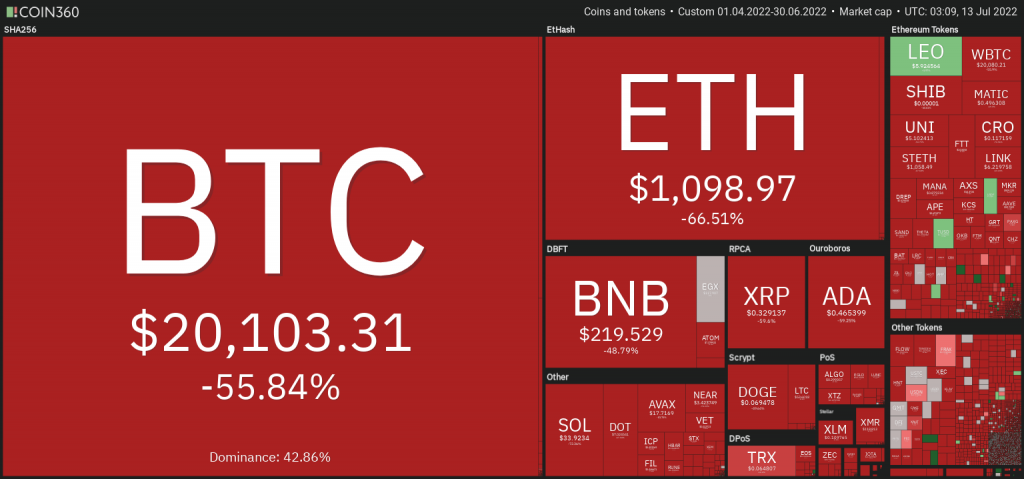
The cryptocurrency market entered the bear market phase in Q2. Some people believe that the crypto market has even entered a bear market from the beginning of 2022. If this assumption was dismissed before, we can no longer deny it. In the second quarter of 2022, Bitcoin had dropped about 70% from the all-time high (ATH) in November 2021 to $20,100 (July 6, 2022). This drastic movement is only possible in a bear market. The crypto market report will explain several reasons for this trend shift.
1. Bitcoin Falls below the 200-Week MA
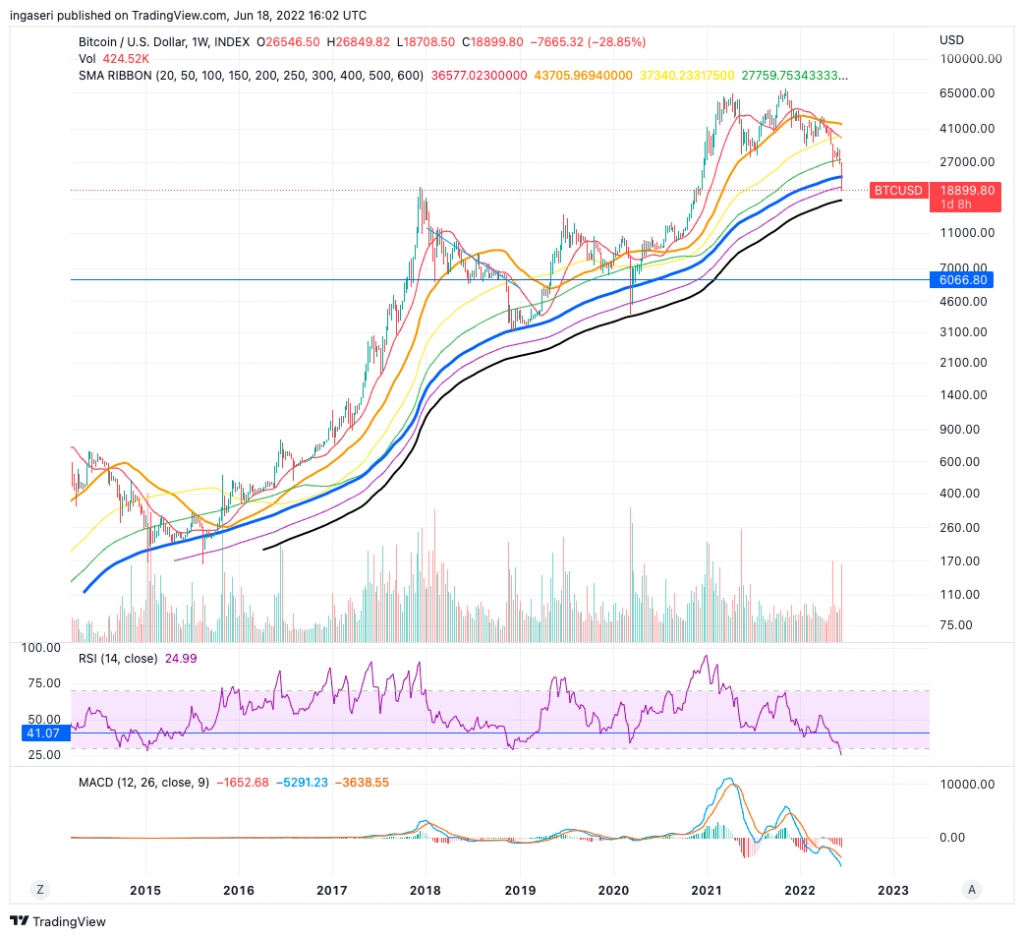
On June 18, 2022, Bitcoin finally touched the Week 200 MA (purple line in the chart above) and broke through it, losing an important support point. Moving Average (MA) is one of the important indicators for reading long-term market trends. The 200-week MA means the average price movements in the last 200 weeks. If you look at historical data, in every major bear market, BTC’s price was at its lowest point when it touched the 200-week MA.
In the space of a week, BTC fell from a price of $30,000 US dollars to briefly touching $17,600 dollars on June 18. This price movement prompted many to say that the crypto market has officially entered a bear market phase.
In this second quarter, BTC showed its worst price movement in more than a decade, and June was the worst month in Bitcoin history. In addition, for the first time since January 2021, the total market capitalization of crypto assets fell below $1 trillion US dollars.
2. Fed Rate Increase
The second quarter is also the time when the Fed raises interest rates again (previously March 2022). The Fed raised its interest rate by 75 bps (basis points) to a range of 1.5% to 1.75%, the largest interest rate increase since 1994. The Fed’s decision was a response to the US inflation rate (CPI) which reached 8.6% in May (the highest in the last 40 years). This increase was also beyond the predictions of some experts who predicted a 50 bps increase. Consequently, this decision caused panic in the stock and crypto markets.
The US inflation rate continued to rise to 9.1% in June, and the Fed is likely to raise interest rates again by 75 bps at the end of July.
3. LUNA & UST
The month of May recorded one of the worst events in the history of the crypto market, namely the collapse of Terra and its two assets, LUNA and UST. Terra is a cryptocurrency with a market cap of $40 billion US dollars in April and was in the top 10 according to Coin Market Cap. In July, its market capitalization value was only $800 million. LUNA fell 99% and stablecoin UST lost its peg value against the US dollar (depeg). Terra suffered a death spiral due to the algorithmic system attached to UST which eventually destroyed its ecosystem.
The LUNA and UST events not only impacted the Terra ecosystem. All crypto networks connected to Terra were affected by this incident, including Avalanche and some DeFi apps. In addition, the UST incident reduced crypto investors’ confidence in DeFi applications leading to a nearly 50% drop in the DeFi industry’s total value locked (TVL) from $222 to $119 billion US dollars.
Also read: What Happened to Terra (LUNA) and UST?
4. Celsius & 3AC Solvency
Celsius is a crypto asset lending platform where users store assets and earn interest. The Celsius platform provides quite attractive interest (3-10%) for cryptos such as SOL, ETH, and AVAX. In May 2022, Celsius has $12 billion in user funds. However, on June 13 Celsius suddenly froze the withdrawal of funds from its platform. Several government institutions explained that Celsius went bankrupt and could not return funds to a number of its users.
3AC or Three Arrows Capital is a crypto asset investment company that invests in several large blockchains such as Solana, Terra, Near, and DeFi protocols such as AAVE. Within the crypto community, 3AC has a fairly good reputation as venture capital and Zhu Su (founder of 3AC) is a community figure whose vocals and opinions are respected. Even so, there is the news of bear market conditions and the LUNA incident brought news that 3AC is facing bankruptcy and has a number of debts that need to be paid.
These two cases show that companies as big as 3AC and Celsius are not even immune from the bear market. In addition, it also emphasizes the importance of risk management because 3AC and Celcius are exposed to various high-risk assets such as LUNA for 3AC, and Celsius which use the DeFi protocol to rotate the assets.
You can watch the video below to find out more on the UST, Celcius-3AC debacle.
Cryptocurrency Market Performance in Q2
Smart Contracts Platform
The entire crypto market as a whole is in a decline, but the smart contract platform got hit particularly hard in this bear market cycle. During Q2 2022, layer 1 smart contracts experienced an average decline of 50-75%. Avalanche (AVAX) leads with around -81% due to exposure to LUNA and UST assets through Anchor Protocol (the largest savings platform in Terra). Fantom ranks second with an -80% drop as a result of Andre Cronje leaving DeFi and a major liquidation in early April. Meanwhile, SOL, DOT, ADA, ATOM, ALGO, and ETH decreased in the range of 65% -70% from Q1 prices.
Data from the price chart shows two events triggering the price decline. Two of those events were the collapse of LUNA in May May as well as news of the freezing of the Celsius funds and the crash of 3AC in mid-June. Bitcoin fell 25% and 30% in the week after LUNA crashed and the Celsius news spread.
However, some crypto assets from the smart contract platform show relatively strong price movements under current market conditions. BNB Chain’s BNB managed to hold on to a -48% drop and Tron’s TRX was, unexpectedly, only a -9% drop.
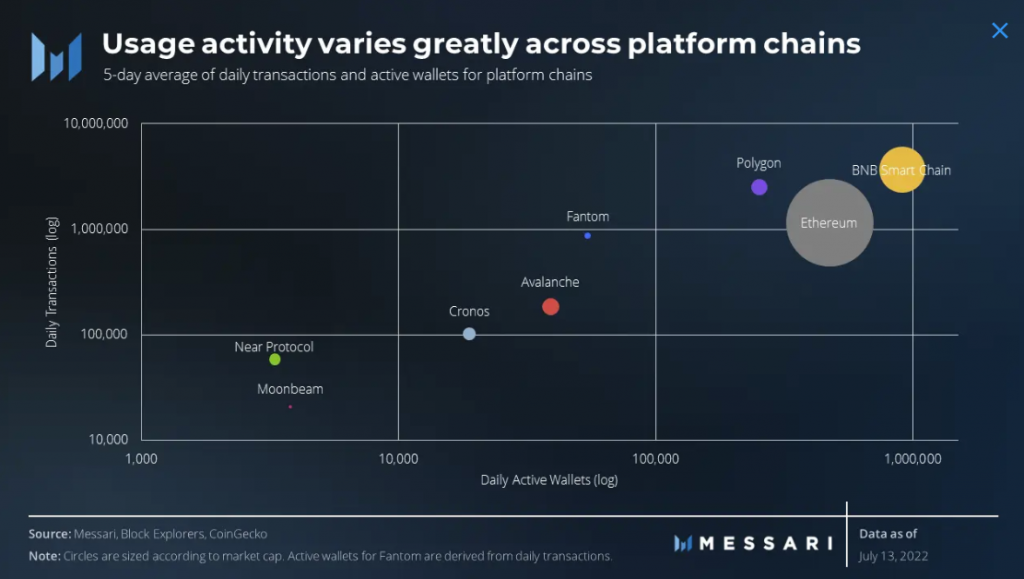
The competition between smart contract platforms continues. The latest data from Messari shows that BNB Smart Chain, Polygon, and Ethereum are the clear winners. These three platforms have the largest user activity among the layer 1 platforms. This shows that there is a living ecosystem application despite the bear market. Fantom, Avalanche, and Cronos follow in the second category as challenger platforms. Meanwhile, Near and Polkadot’s Moonbeam follow in the last category of niche smart contract platforms. Given that Moonbeam and Near have a relatively new app ecosystem, this is not surprising.
Unfortunately, Messari’s research does not include another major blockchain such as Solana, which as we know has an active application ecosystem such as STEPN.
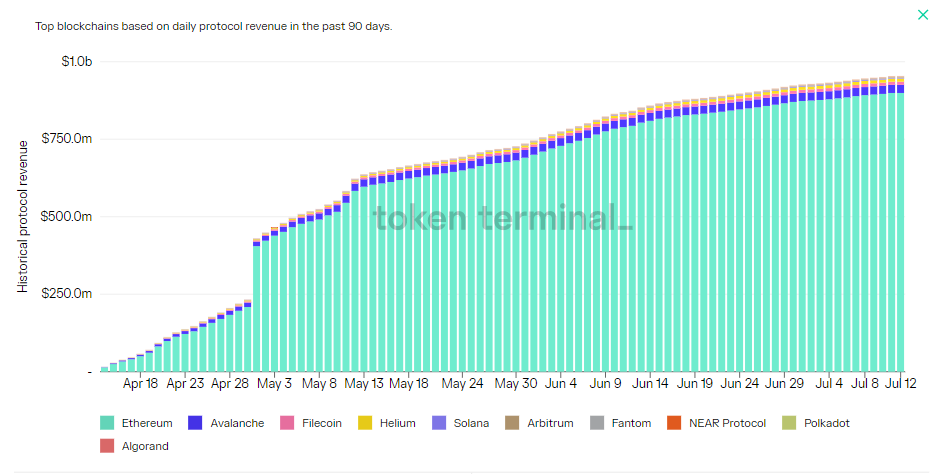
However, the on-chain data on the revenue of each smart contract platform provides another picture. Since early April, the revenue of the majority of smart contract platforms has increased quite steadily with a big jump in early May. The chart above also shows the strength of Ethereum, with a revenue value of 90% of the total revenue of all platforms. The data shows that the majority of L1 platforms still have an active user community even though price movements continue to decline. A sign that the crypto market now has clear uses for its users.
DeFi Industry
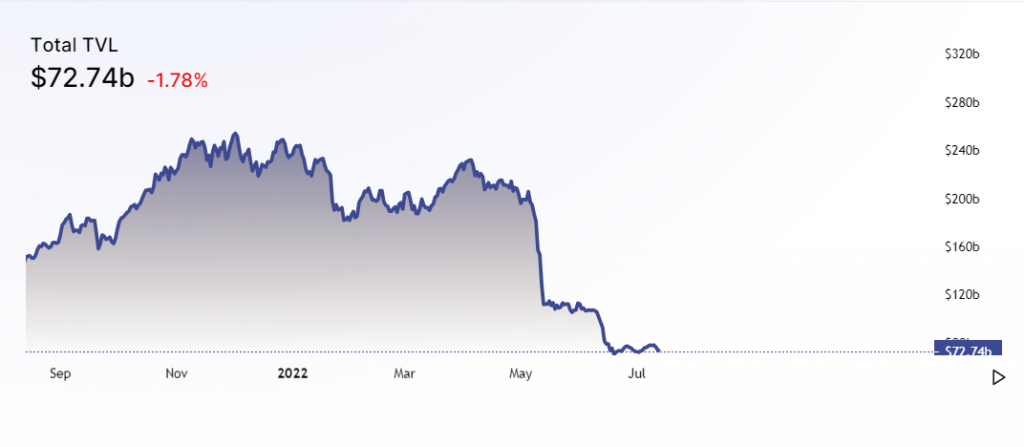
Similar to smart contract platforms, the DeFi industry as a whole saw a decline of around 70% in TVL (total value locked) numbers. By July 2022, the DeFi industry’s TVL was only about $70 billion from a high of $250 billion in April 2022. This drastic decline followed the events of LUNA-UST and Celsius. These two incidents made many investors and DeFi users panic and reduced their exposure to various DeFi platforms, especially those that offer quite large interest.
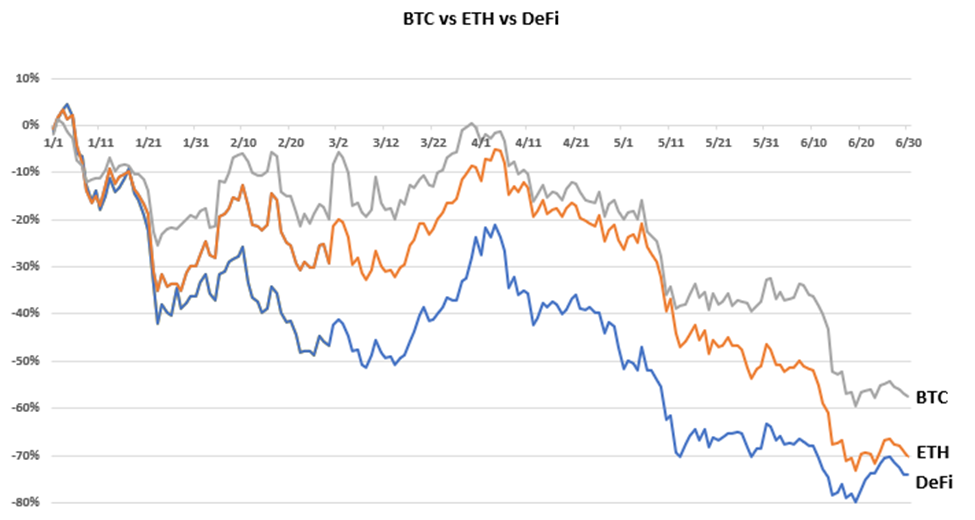
Following the falling TVL figures, the prices of the majority of DeFi crypto (UNI, CAKE, etc.) have also fallen drastically. This drop is even bigger than Bitcoin and Ethereum. In addition, the chart above also shows that there is a tight correlation between the DeFi tokens and the downward movement of BTC and ETH since April 2022.
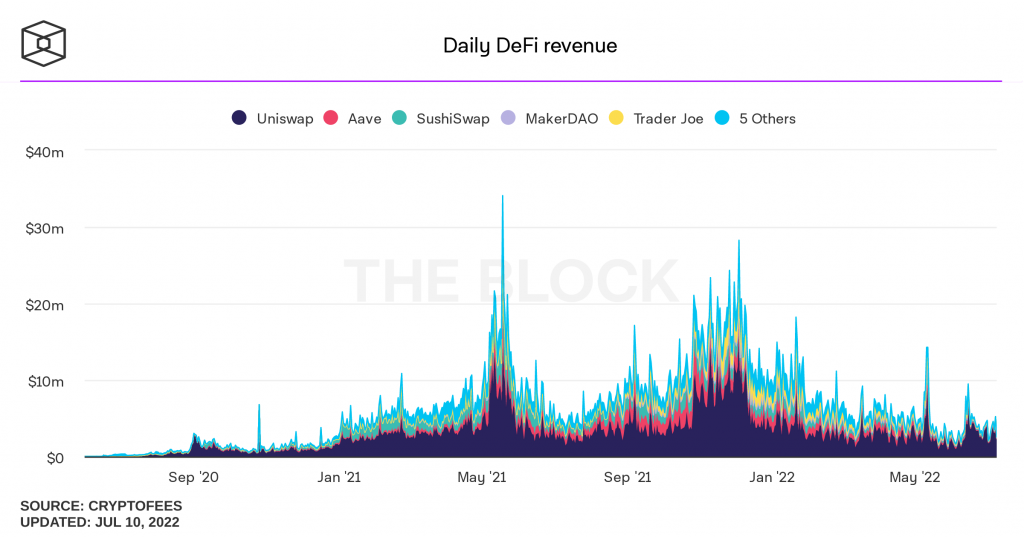
The revenue graph of several DeFi platforms also shows a clear decline in the 2nd quarter of 2022. In fact, this decline clearly started from the beginning of 2022. The May DeFi platform revenue figures are also on par with the beginning of 2021. However, we have seen a slight increase from early June to July 2022.
Metaverse and Gaming
The three largest metaverse and gaming assets namely Decentraland , Sandbox , and Axie Infinity experienced the same magnitude of declines as the majority of crypto assets in Q2. AXS is the biggest loser with a 76% decline because of the Ronin Bridge hack in March 2022. Meanwhile, SAND and MANA fell 69% and 67% in Q2.
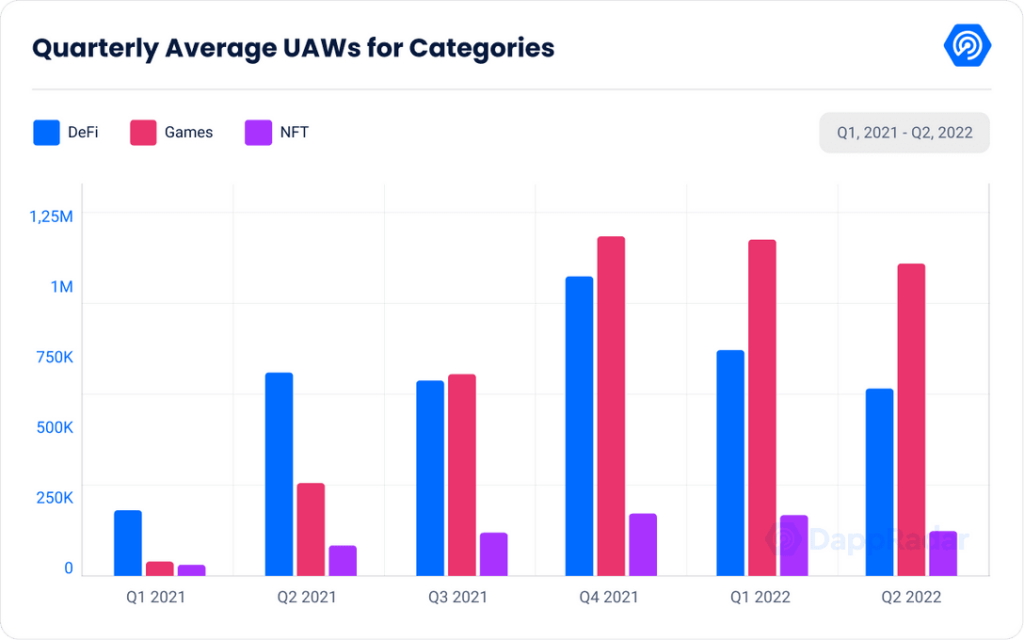
Even though the prices of gaming assets and the metaverse are moving downwards, the blockchain activity of the industry is still very high. UAW (unique active wallets) figures show only a slight reduction in Q2 2022. Gaming activity accounts for around 50% of overall blockchain activity. So, this strong number shows the blockchain gaming industry has an active user base despite the bearish market conditions.
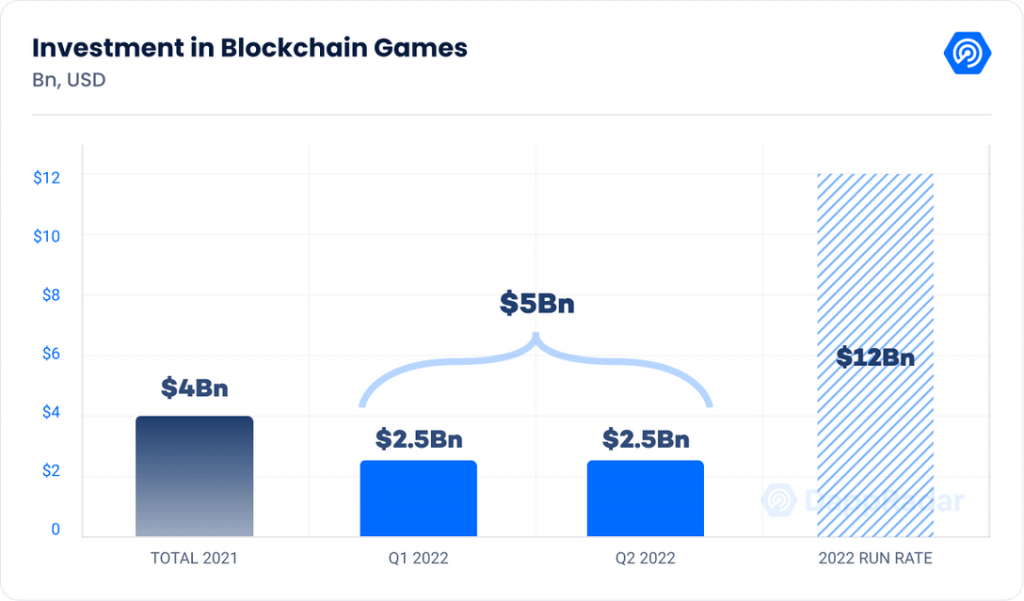
On the other hand, investment in the gaming industry shows strong numbers. The investment figure for the blockchain gaming industry in Q1 and 2 already exceeds the total investment last year. DappRadar estimates total investment for this year to be $12 billion US dollars. In May, A16Z, the crypto investment arm of venture capital Andreessen Horowitz, announced the creation of an index fund specifically for the blockchain gaming sector. The investment is called Games Fund One and is worth $600 million dollars. A16z’s interest in blockchain gaming shows the attraction of the gaming industry despite the bear market.
NFT
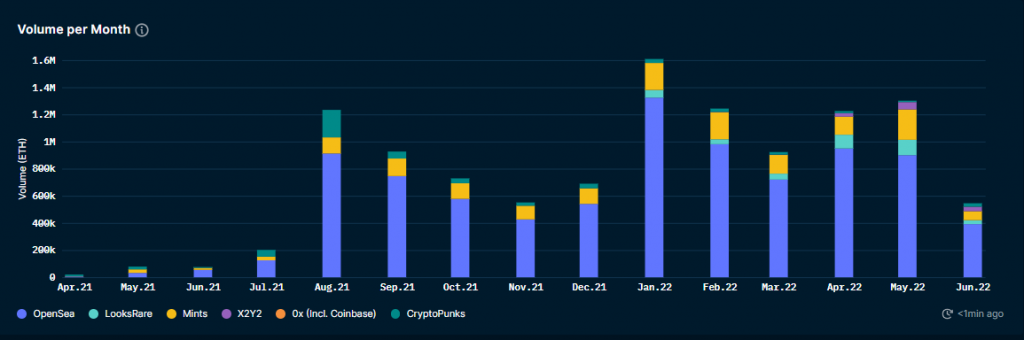
Based on the data above, the NFT industry reached its highest volume in January 2021. This high coincided with the bull market of the crypto market. In Q2 of 2022, the NFT market is showing an increase close to the February figures despite the negative sentiment. However, June 2022 saw a drastic reduction in transaction volume from 1.3 million ETH to around 550 thousand ETH. The 74% drop was the largest volume drop in NFT history.
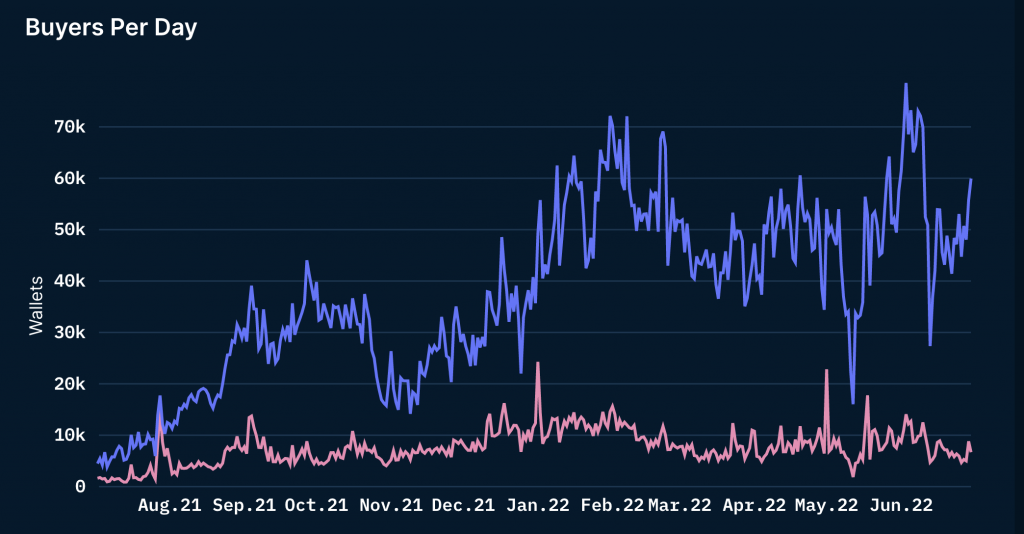
However, the daily buyers’ data provides another perspective on the activity of the NFT industry. New buyers (pink line) started entering the market in June after dropping drastically in May. At the same time, existing users began to make purchases of NFT again at the end of June after a drastic decline in early May and June.
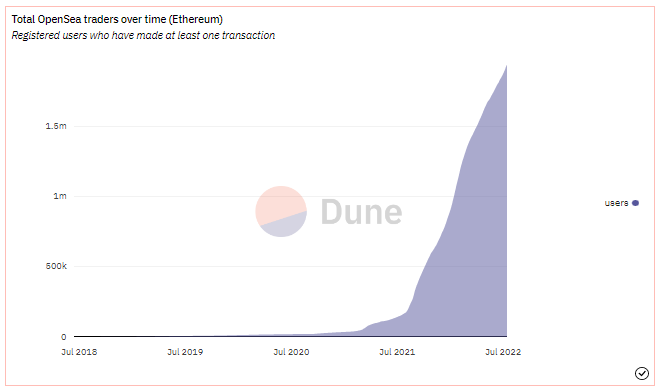
The graph of the number of OpenSea (the largest NFT market platform) users also shows a positive signal. The number of NFT users on OpenSea shows a steady increase even though we are in a bear market. We can also see that the most drastic increase in users occurred in 2021, with total users now already exceeding 1.5 million.
The two charts above provide positive signals that interest and activity in the NFT market are starting to recover.
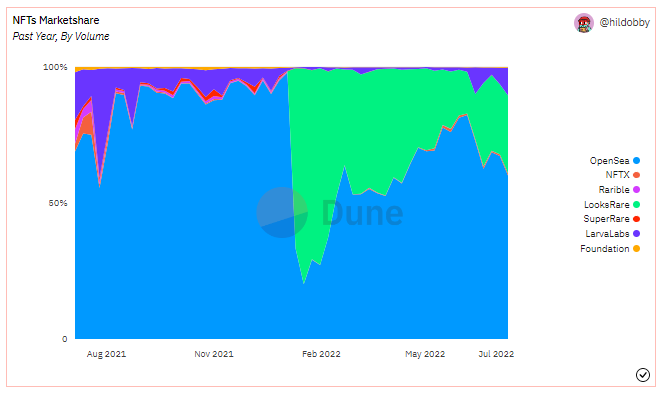
Meanwhile, the competition among NFT’s marketplace platforms is still won by OpenSea. As the largest NFT Platform, OpenSea now accounts for about 50% share of the NFT industry. In fact, this figure is close to 90% by the end of 2021. Looksrare, a community-driven NFT platform, managed to capture over 50% of the NFT market when it launched in January 2022. However, now OpenSea is back to being the largest NFT market with $696 volume in June, representing 67% of the total NFT transactions.
What is next?
Crypto market observations suggest Q3 will be a pivotal moment for crypto assets. The Fed’s rate announcement will occur at the next FOMC on July 26-27. Then, on July 28, the estimated US Gross Domestic Product (GDP) will determine whether the US is in recession. The FOMC in July is expected to raise the Fed Funds rate by 50 or 75 basis points. This series of reports can be used as a reference for predicting macroeconomic conditions that will also affect the performance of the crypto sector.
Read more: Why did the price of crypto drop?
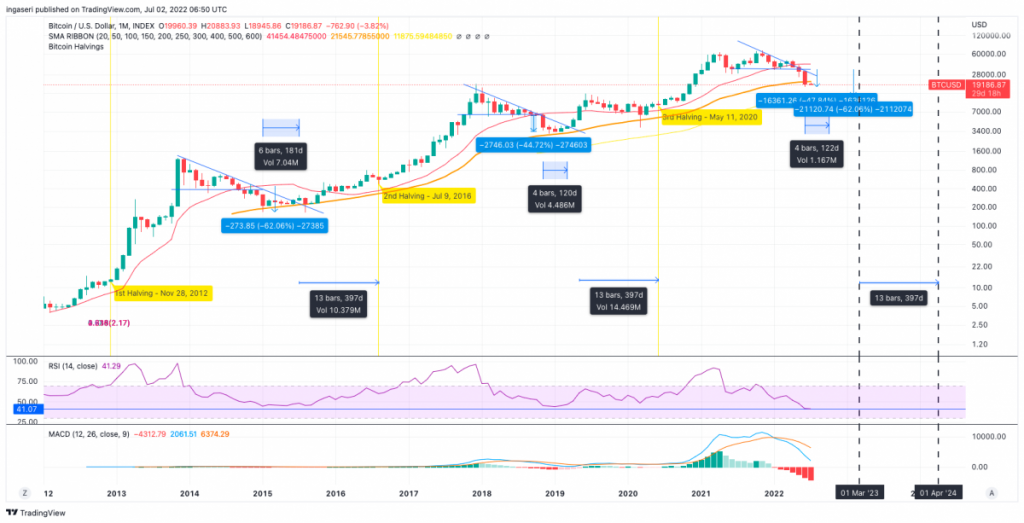
Historically, BTC has usually been below the macro trend line (orange line in the upper chart) for 120-180 days. BTC spent 180 days in that position in 2014 and 120 days in 2018. Therefore, 120 days from June 2022 is October 2022 and 180 days from June is December 2022. So we will most likely see the end of the bear market between October-December 2022. Even so, the global economic climate and macro data such as inflation and the Fed’s policies can have a significant impact on this.
Lastly, the market bottom in October-December also intersects with the completion of the Ethereum merge process which is also predicted to happen in the Q4 of this year. The confluence of these two important points could be the catalyst for the start of a new bull market in 2023 before BTC approaches a halving.
Risk Management
Reflecting on the events of Celsius, 3AC, and several other companies facing bankruptcy in a bear market, risk management cannot be underestimated. The volatility of the bear market will not differentiate between experienced traders and newcomers. Therefore, always be careful in using DeFi platforms, use technical analysis before buying crypto, and manage your risk by not using leverage trading.
All information in the crypto market report is intended to provide education and information, not financial advice.
References
- Kaushik Guduru, Messari Fund Analysis H1’22: Examining Portfolios of Crypto Funds, Messari, accessed on 12 July 2022.
- Crypto Rank, Crypto Market Recap Q2, 2022. The crypto market faced a lot of, Medium, accessed on 12 July 2022.
- Mack Wilowski, Fed Raises Rates by 75 Basis Points at June FOMC Meeting, Investopedia, accessed on 13 July 2022.
- Oliver Knight, How Crypto Lender Celsius Overheated, Coin Desk, accessed on 13 July 2022.
- DefiLlama – DeFi Dashboard, accessed on 13 July 2022.
- James Chung, DeFi Market Commentary | June 2022 | ConsenSys Cryptoeconomic Research, Consensys, accessed on 14 July 2022.
- DappRadar x BGA Games Report – Q2 2022, DappRadar, accessed on 14 July 2022.
- Aurelie Barthere, Navigating Crypto’s Peaks and Troughs: Can We Have A Sentiment Indicator for NFTs?, Nansen, accessed on 15 July 2022.
- MK Manoylov, Monthly NFT trading volumes fell 74% from May to June, The Block, accessed on 15 July 2022.
Share
Related Article


See Assets in This Article
BTC Price (24 Hours)
Market Capitalization
-
Global Volume (24 Hours)
-
Circulating Supply
-