Market Analysis August 8-14: ETH Price Jump Ahead of The Merge and US Inflation Falls to 8.5%
Update 15 Aug 2022 • Reading Time 3 Minute
Reading Time: 3minutes
The latest data from the Consumer Price Index (CPI) shows that consumer price inflation in the United States (US) slowed to 8.5% in July 2022. Meanwhile, ETH prices continued to increase as the implementation of the Merge drew closer.
Pintu’s trader team has collected various important data about the price movements of the crypto asset market over the past week which is summarized below. However, kindly note that all information from this Market Analysis is for educational and informational purposes only, and not financial advice.
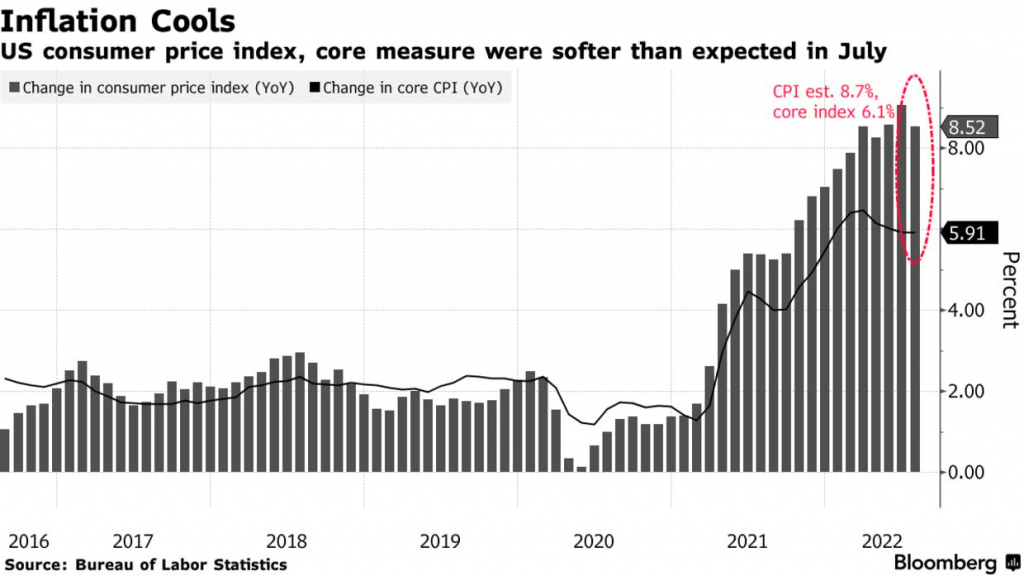
📉 The latest data from the Consumer Price Index (CPI) showed that consumer price inflation in the United States (US) eased to an annualized 8.5% in July.
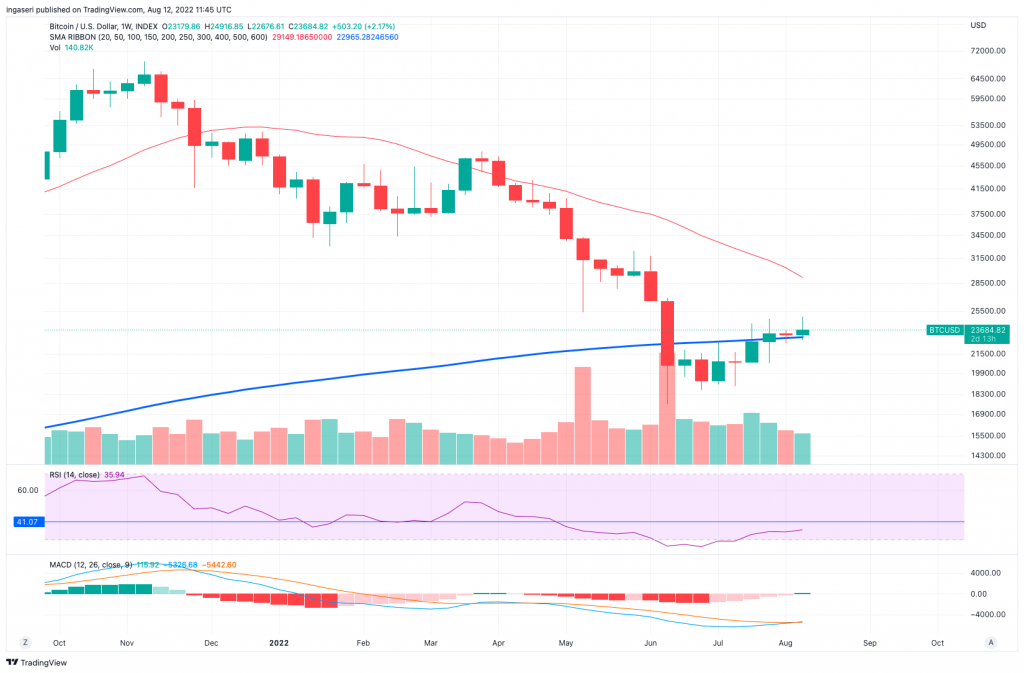
📊 On the weekly chart, BTC is still at the support line of the 200-week MA and is still in the bearish flag channel.
🚀 ETH continues its positive momentum as the Merge implementation approaches. The dominance of ETH has shown a strong momentum (20.6%), which is caused by the price of ETH soaring high.
💡 Crypto Fear and Greed Index is currently at 42, a significant increase for 1 month, from where it previously reached 15.
US Inflation Falls to 8.5%
New CPI data released this week suggests inflation has peaked. The CPI finally pulled back from a 40-year peak in July, as the consumer price index came in cooler than expected. The CPI inflation rate eased to 8.5%, retreating from June’s 9.1% inflation rate.
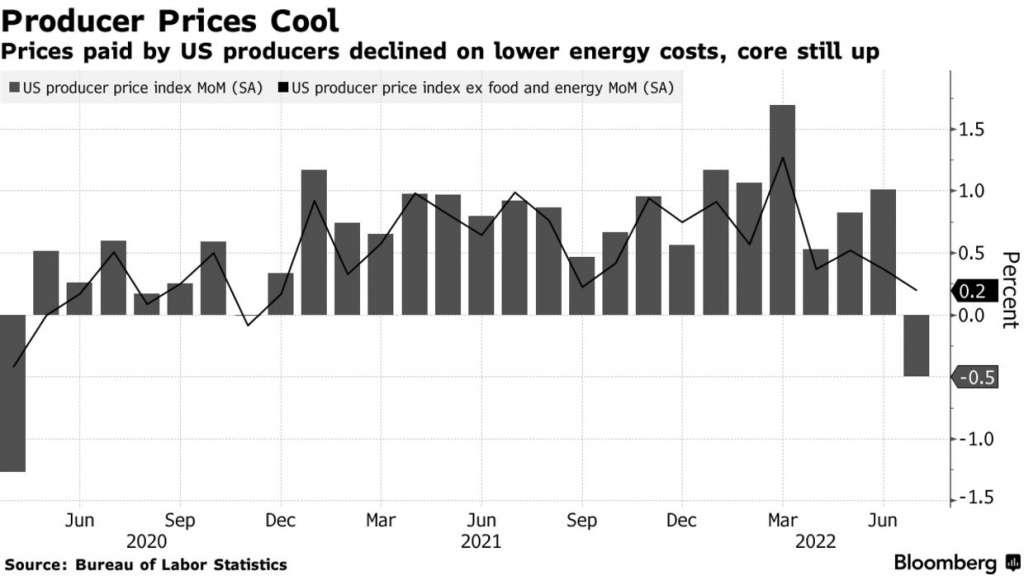
The producer price index, a gauge of final-demand wholesale prices, decreased 0.5% in July due to a slide in energy prices. The year-over-year gain was 9.8%. The annual increase was the lowest since October 2021, and the monthly move was the first decline since April 2020. This is a another sign that price increases are slowing.
BTC Price Movement 8-14 August 2022
BTC has not moved much over the week. The fact that BTC added another support point to the 200-week MA line is encouraging. This is encouraging as the more often we made the support, the more certain we are on the reversal towards the upside.
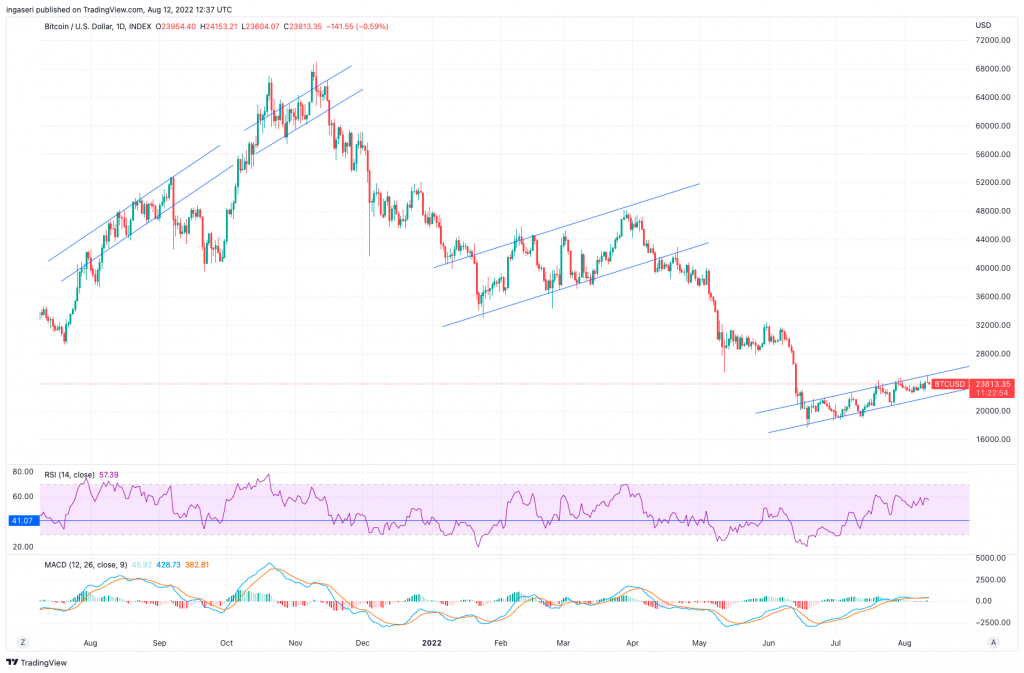
BTC is currently still within the bearish flag channel. Like mentioned previously, in case of a bullish breakout, the 100-day moving average, which currently resides near the $25.5K level, would be the first obstacle before the significant $30K supply zone. In the case of a bearish pattern, an eventual breakdown from the pattern would likely happen.
BTC Dominance has entered the <40% zone. This area has historically been the bottom of the BTC.D. The range of the bottom is between 39-40%. Given the historically accuracy of this support line, not long when we are going to see BTC dominate ETH, most likely before the ETH merge is completed in Mid-September.
Another interesting data that we can study is the monthly return of Bitcoin. Notice that for the upcoming month of September, we have experienced a negative return for 7 out of 9 months previously.
ETH Price Movement 8-14 August 2022
Ethereum has shown positive momentum. Expectations of an imminent switch to proof-of-stake are a significant market driver. As a result, ETHUSD has already recouped all losses since June, rising more than +100% from its bottom in Mid-June.
The next significant milestone for ETH is the psychological price of $2,000, where since April this year, we have broken down below this line. As can be seen on the weekly chart, we are currently attempting to break over this resistance line where we are being refused.
ETH Dominance has been showing strong momentum (at 20.6%) as ETH price spiked high. We can see that after spending much time in the Fibonacci golden pocket area, ETH.D was finally able to break out, only to be resisted by the 0.786 Fibonacci line. This resistance line has been a strong resistance since the previous bull run, as it coincides with ETH’s psychological price of 2k.
DXY Index
The DXY index has fallen and broken off its 21 days EMA support, we are currently supported by the 55 weeks EMA line. As we all know, the DXY index is inversely related to the crypto market, should we see a rise in the DXY, expect the crypto market to reverse.
Crypto Fear and Greed Index
The current Crypto Fear and Greed Index is at 42. We see significant improvement over 1 month, where it previously reached a value of 15 which indicates extreme fear in the market.
on-chain-analysis">On-Chain Analysis
Exchange: As the exchange reserve continues to rise, it indicates higher selling pressure. Exchange net deposits are low compared to the 7-day average. The selling pressure may be lessened as a result of lower deposits.
Miners: Compared to its one-year average, miners are selling their shares in a moderate range. In comparison to its one-year average, Miner’s revenue is in a reasonable range.
On-chain: More investors are selling at a loss. In the middle of a bear market, it can indicate a market bottom. Long term holders’ movement in the last 7days were lower than the average. They have a motive to hold their coins. Investors are still in fear phase, where they are currently with unrealized profits that are slightly more than losses.
Derivatives: Long position traders are dominant and are willing to pay to short traders. As OI increases, it indicates more liquidity, volatility, and attention are coming into the derivative market. The increasing trend in OI could support the current ongoing price trend. Buying sentiment is dominant in the derivatives market. More buy orders are filled by takers.
Altcoins News
🔗Ethereum’s Third and Final Testnet Before The Merge Lives on Goerli: The third and final network test before the implementation of the Ethereum Merge has been successfully completed. Goerli is the last of three public testnet of the Merge. After this, the Merge is expected to be implemented at the end of September. The two previous Merge testnets, Ropsten and Sepolia, have also been successful and have increased the Ethereum community’s confidence that the Merge will happen this year.
⚠ Acala Stablecoin Falls 99 Percent After Hackers Mint 1.3 Billion Tokens: Quoted from CoinDesk, stablecoin from Acala’s decentralized finance platform (DeFi), aUSD, went into a depeg on Sunday (14 August 2022) , and dropped 99% after hackers exploited a bug in the *liquidity pool (*a collection of crypto assets locked in smart contract technology) to print 1.28 billion tokens. Launched earlier this year, the aUSD managed to maintain its value to be comparable to the US dollar until it was hacked last week. After the hack, the price of aUSD fell from around $1.03 per token to $0.009.
More News from Crypto World in Last Week
💵 Bankman-Fried, Sun in Talks to Buy Majority of Huobi Shares: Quoted from CoinDesk, Leon Li, founder of crypto exchange Huobi Global, is in talks to sell a majority stake in the company in a transaction worth $3 billion or so more. Li wants to sell nearly 60% of the company’s stake, and has held preliminary talks with Justin Sun, founder of blockchain network Tron, and FTX, the crypto exchange founded by billionaire Sam Bankman-Fried.
🚨 US Sanctions Tornado Cash Crypto Mixer: The United States Treasury has sanctioned crypto mixer Tornado Cash as well as several crypto wallet addresses associated with the service. This means the protocol and associated smart contracts are now blacklisted, making them illegal for use by the American public. The sanctions follow allegations that Tornado Cash helped conceal billions of dollars in capital flows and money laundering.