March 2, 2026 Market Analysis: Bitcoin Holds Amid Iran Conflict and Macroeconomic Uncertainty

This week’s crypto market analysis will analyze the crypto market, which experienced a volatile week at the end of February 2026. Bitcoin briefly touched a yearly low of around $62,900 before rebounding to the $65,000-$66,000 range. Total crypto market capitalization was stable at around $2.1 trillion, while the Fear & Greed index remained at “Extreme Fear” (11).
Nevertheless, the weekend and early March saw a relief rally: BTC rose up to +4.8% on March 1, Ethereum +7%, and Solana surged +11% to $88-$89. The overall weakness is still influenced by macroeconomics and geopolitics, although signals of long-term accumulation are starting to appear.
Article Summary
- Price Volatility and Asset Consolidation: The crypto market experienced sharp volatility, with Bitcoin touching a low of $62,900. Despite the relief rally for BTC, ETH, and SOL, all three are still stuck in a consolidation phase with no dominant bullish signals.
- Macroeconomic and Geopolitical Pressures: The sell-off was triggered by risk-off sentiment due to US import tariffs and the escalating geopolitical conflict between the US and Iran. These conditions pressured risky assets and prompted investors to temporarily switch tosafe-haven assets such as gold.
- Silent Accumulation by Whale: Amidst the market panic at the”Extreme Fear” level, the on-chain data is showing positive signals. Long-term holders and whales took advantage of the correction to buy tens of thousands of Bitcoins and withdraw them from exchanges.
- ETF Fund Flow Reversal: After recording significant outflows at the beginning of the week, the Bitcoin ETF managed to turn around to record ETF flows of around +$787 million. In addition, the Solana ETF also recorded consistent inflows, signaling the start of capital rotation into the SOL ETF.
Macroeconomic Update
Last week was dominated by US trade policy uncertainty and geopolitical tensions that fueled risk-off sentiment across risky assets, including crypto.
Trump tariffs and the Supreme Court ruling
On February 23, President Trump announced a 15% global import tariff “effective immediately” after the Supreme Court struck down the previous tariff under IEEPA. The administration then implemented a temporary tariff of 10% as of February 24 (Section 122), which was increased to 15%. This raised fears of inflation and a slowdown in global trade.
As a direct result, risk assets (including crypto and tech stocks) were immediately pressured, and BTC fell to $62,900. However, as the tariffs ended up being lower than the expected 15-20%, the market reacted with a “TACO trade”(Trump Always Chickens Out).
US economic data
Revised Q4 2025 GDP fell sharply to +1.4% (from +4.4%) due to the government shutdown. January Core PCE rose 3.0% YoY, CPI slowed to 2.4%, and Industrial Production +0.7%. These data reinforced the Fed’s “higher for longer” interest rate narrative, suppressing expectations of a rate cut for March.
The S&P 500 rose +1.08% and the Nasdaq +1.51% on a weekly basis, thanks to a rotation into “real economy” sectors, but still reflecting uncertainty.
Geopolitics of the Middle East
US-Iran tensions escalated after news of the death of Iran’s supreme leader, Ayatollah Khamenei, accompanied by Iran’s blocking of the Strait of Hormuz. The incident pushed oil prices up, and investors turned to safe havens such as gold, which is back above $5200 per oz. This risk-off sentiment immediately pressured crypto and tech stocks.
Effect on Price
This combination of tariffs and geopolitics led to massive liquidation ($3-4 billion the previous week, including $2.5 billion in BTC futures) and Bitcoin ETF outflows. However, lower-than-expected rates triggered a relief rally later in the week, pushing BTC back to $66,000.
BTC Analysis
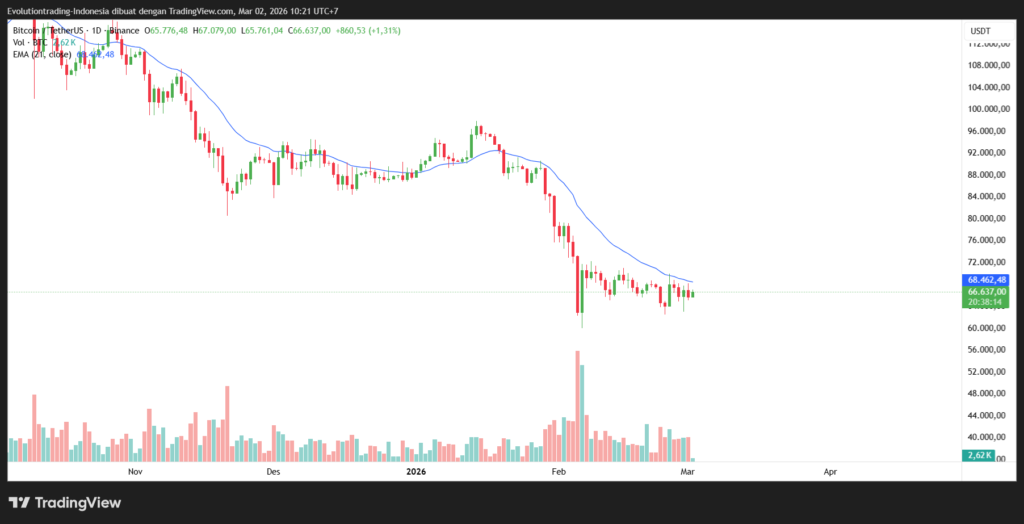
Key price performance: BTC closed last week at around $65,700. Technically, Bitcoin is still not showing any bullish signals and is in its consolidation zone around $62,900-$71,500. Selling pressure is still dominant in Bitcoin, characterized by the formation of a higher low structure and pressure from the 21 EMA on the 1-day timeframe.
ETH Analysis
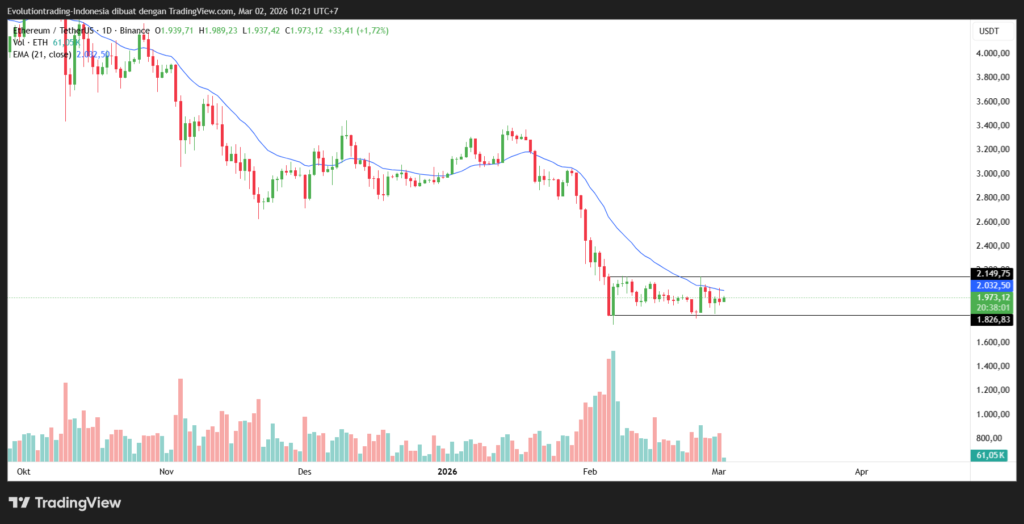
Ethereum is still seen in the area between $1,826-$2,149, which shows that there is no potential for an increase or decrease, but it is still in a consolidation phase.
SOL Analysis
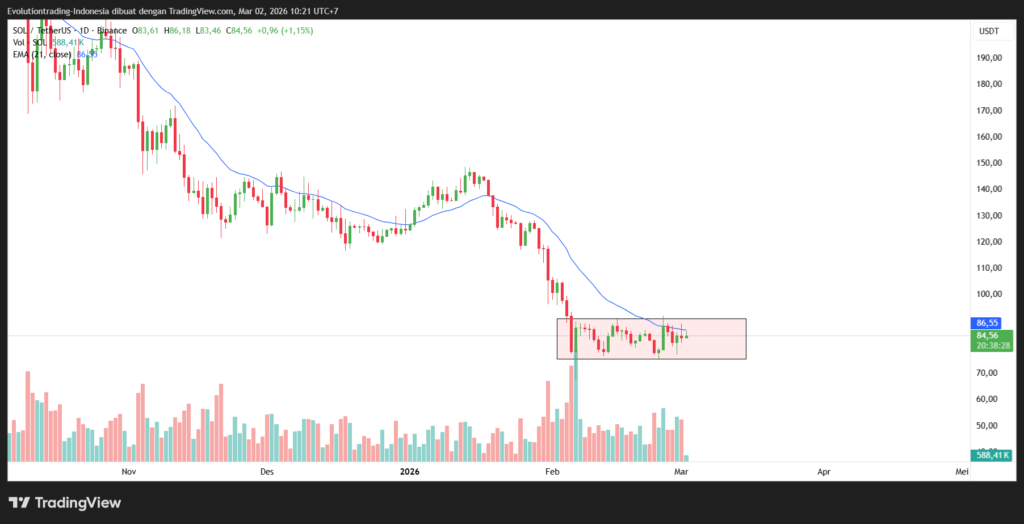
Similar to Ethereum, Solana is also still within its consolidation area between $75 and $90. SOL briefly rose to $89 and looked to be testing the upper area of consolidation. However, the rise was immediately retraced and is now at $82.7 (as of March 2).
On-Chain Update
On-chain data shows the market is in a deleveraging phase with long-term accumulation signals despite low network activity.
Bitcoin: Daily transaction volume fell to a 6-month low (~$20 billion) and active addresses declined, indicating stagnant network utility. Whale & large holders (10-10,000 BTC) accumulated ~15,411 BTC in 3 days. Wallets with more than 10,000 BTC also bought. Long-term holders continue to withdrawcoins from the exchange (low multi-year reserve data).
MVRV: 365-day MVRV at -32% (historical buy zone like 2022 bottom). Realized losses increased, non-empty wallet reached an ATH of 58.4 million.
Funding rate: negative on Binance (predominantly short), open interest down since October 2025, indicating deleveraging without panic selling.
Implications: On-chain shows fundamentals remain healthy (institutional accumulation & LTH, high stablecoin supply). Price declines are more due to macro and deleveraging than bad fundamentals. Weekly RSI oversold (BTC 28, ETH 25), similar conditions to the 2022 bottom.
ETF Fund Flow
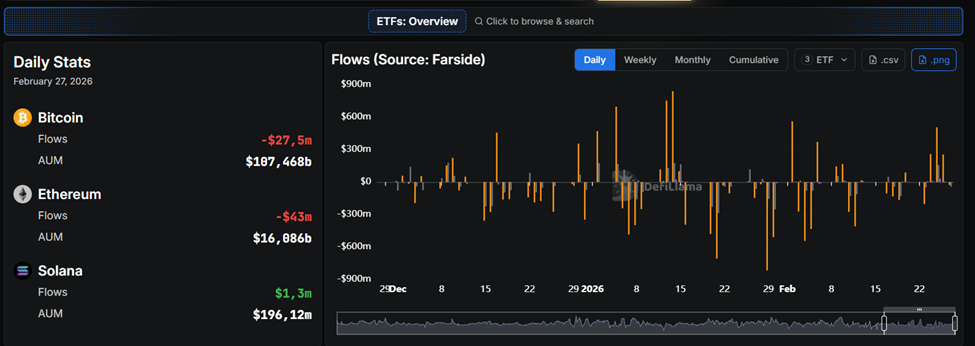
Source: Defillama.com.
Bitcoin ETFs recorded outflows of -$203 million on February 23 (BlackRock IBIT’s largest $116 million), but then inflows of +$1.1 billion for three consecutive days, reversing the trend of 5 consecutive weeks of fund outflows. On a weekly basis, total Bitcoin ETF flows were about +$787 million.
Ethereum ETF also experienced outflows of -$49 million earlier in the week. Interestingly, Solana ETF experienced consistent inflows for 5 days (peak of +$30.9 million), indicating a rotation into altcoins.
Conclusion
Last week, crypto was still pressured by macro (Trump tariffs + Iran tensions) and early ETF outflows, but the late-week relief rally and whale accumulation signaled a potential bottoming process.
Next week will be determined by the US Non-Farm Payrolls data (March 6) and the ECB decision. If economic data is weak or tariffs ease, the relief rally could continue towards $70,000 for BTC.
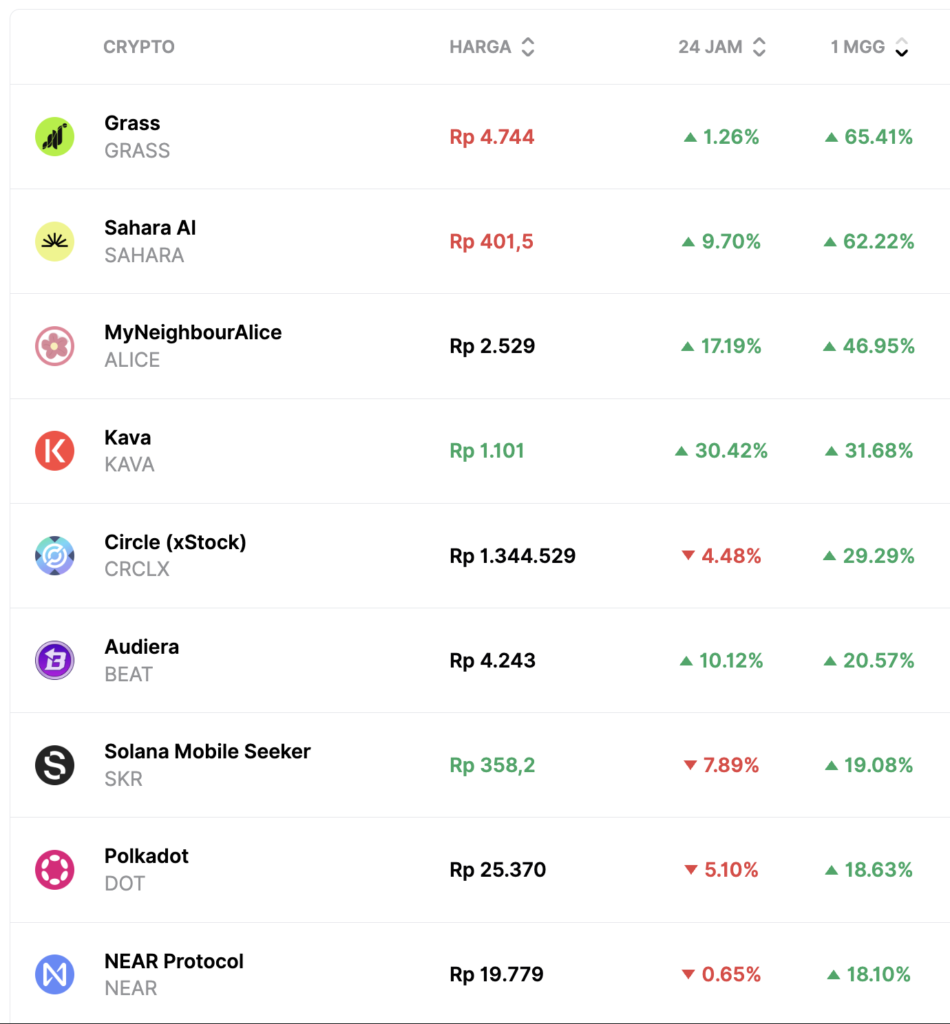
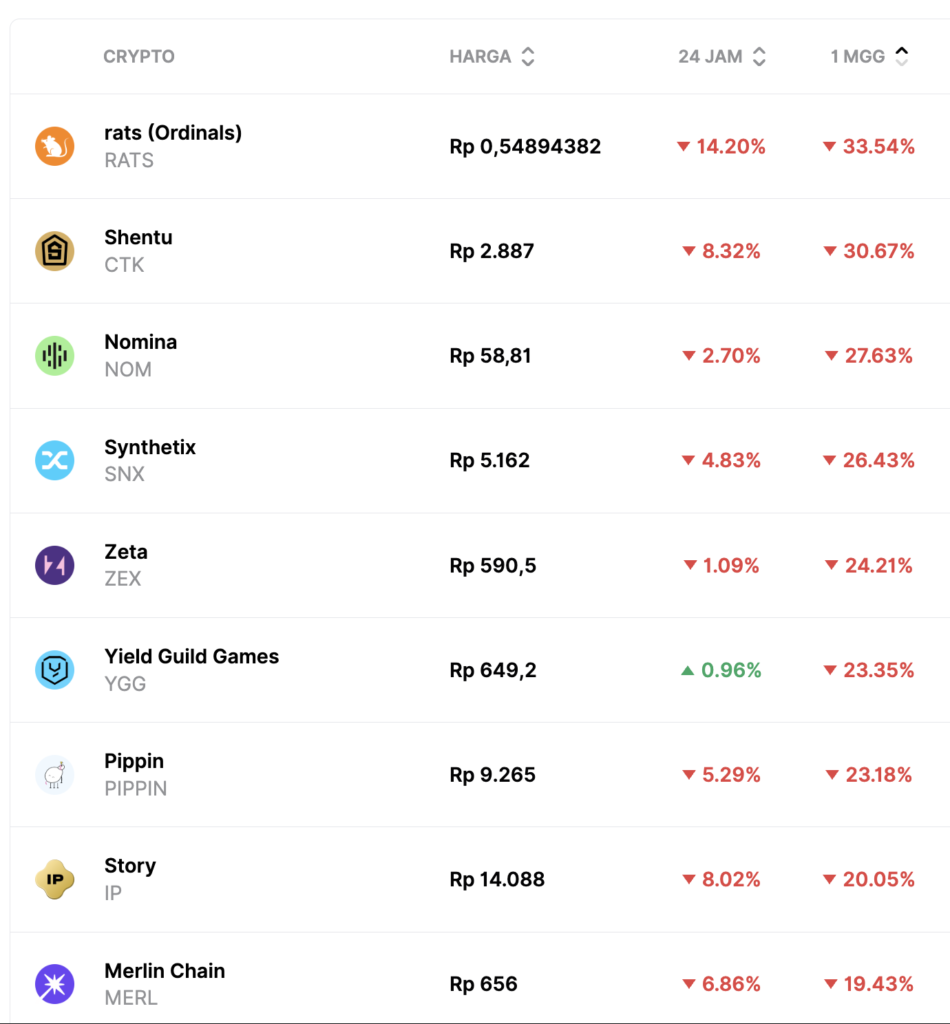
Weekly Winners and Losers
Share
Related Article


See Assets in This Article
0.4%
2.0%
0.0%
BTC Price (24 Hours)
Market Capitalization
-
Global Volume (24 Hours)
-
Circulating Supply
-