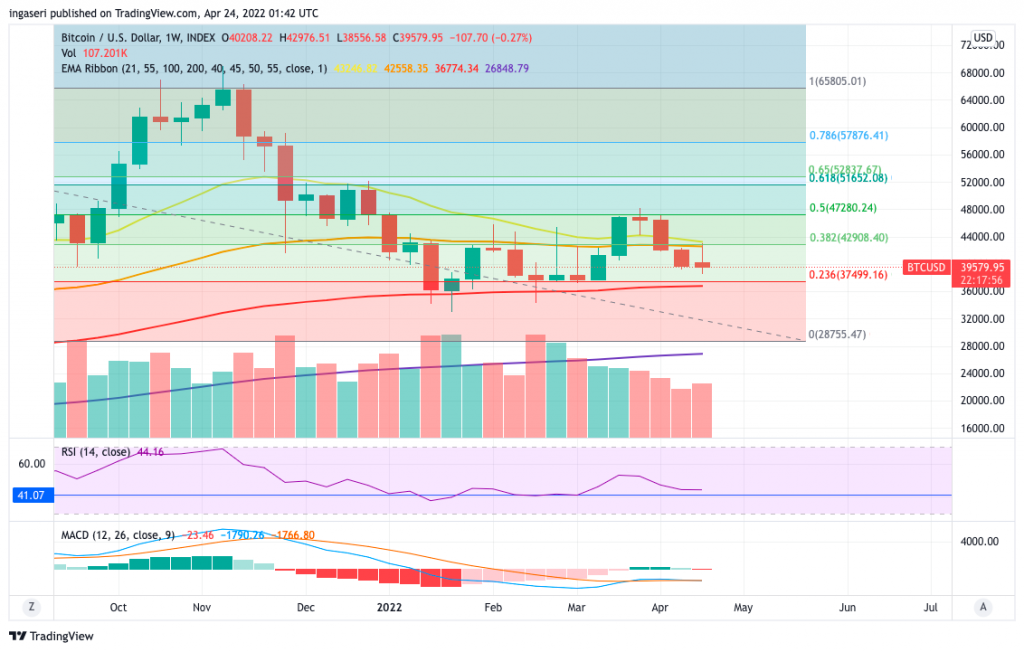
Last week (17-23 April) was the second week BTC tried to break out of the 55-week EMA resistance line (43,000 US dollars), but was still rejected. The last candle we saw on last week’s chart shows the Gravestone Doji*. This could mean buyers are trying to push to new highs during the session, but bears are pushing the price action down and closer to the opening price at the end of the session.
💡 Gravestone doji is a bearish reversal candlestick pattern that forms when the open, low, and close prices are all close to each other with a long upper shadow. The long upper shadow indicates that the early bullish gains have been eclipsed by the late-session declines, which often occur right before a long-term bearish trend.
With the last candle rejected, this provides validation of the chart pattern that the price may continue to decline in the longer term. Week-on-week volumes have been relatively stable, with a slight increase. The RSI is also still sideways, with a resistance level in the range of 42,600-43,300 US dollars.
However, in short-term analysis, BTC could move sideways, with a price range of 40,000-43,000 US dollars. A reminder that the 43,000 US dollar level corresponds to a bull market EMA (21 week EMA). BTC needs to recapture this EMA to confirm bullish momentum.
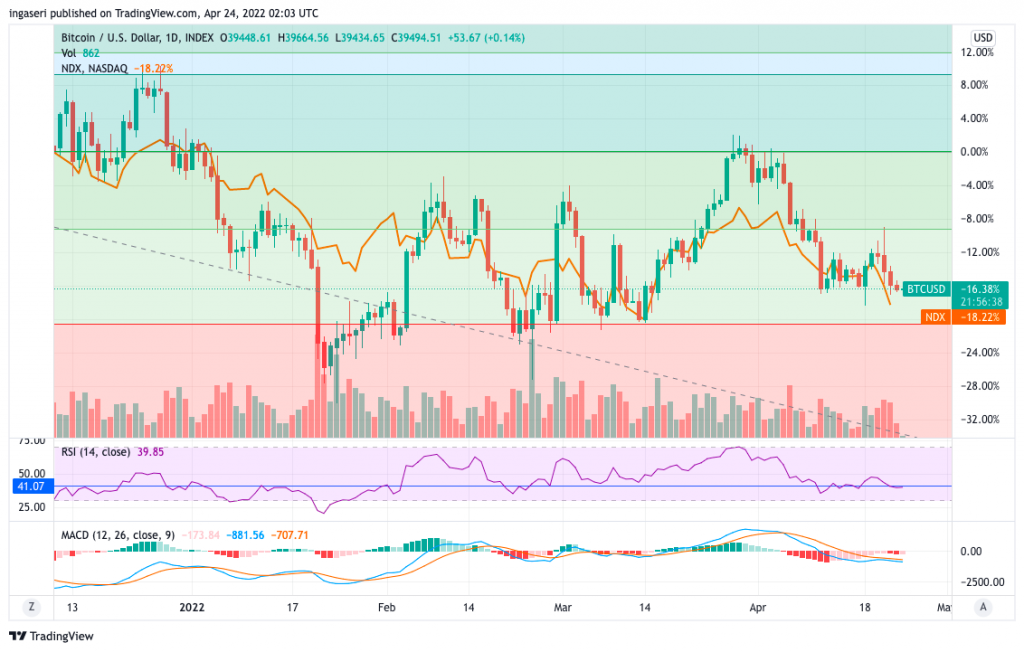
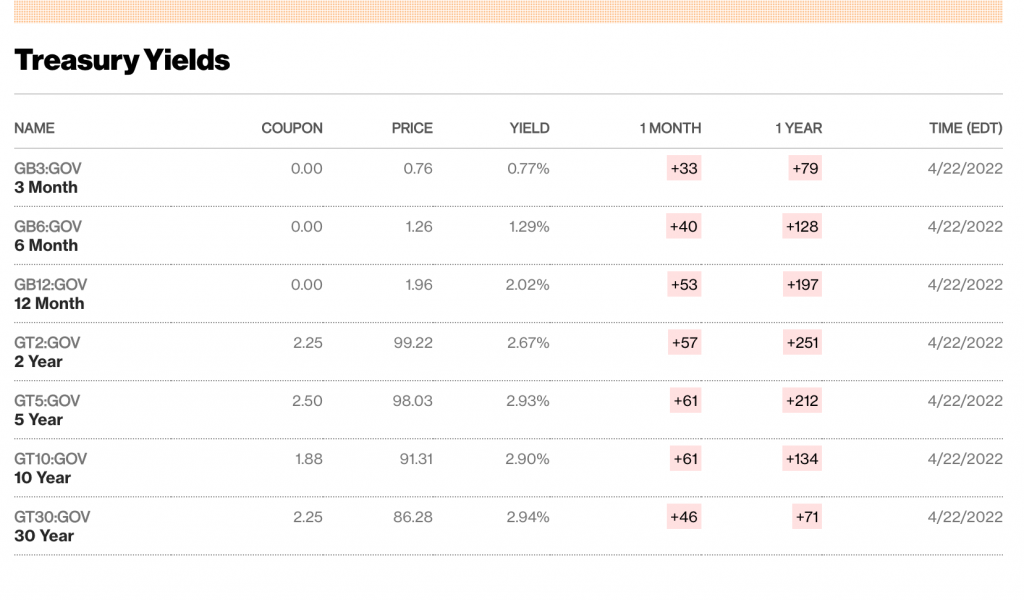
BTC price movements have been increasingly correlated with US equities this year, in particular, the Nasdaq. With the sell-off of tech stocks, BTC will face the same risk-off pressure from the market. With treasury yields increasing, stock valuations will be compressed as the risk-free rate commonly used to calculate discounted cash flows becomes higher. Until we see tech stocks rebound, it will be difficult for BTC to bounce back, at least for the foreseeable future.
💡 An increase in treasury yields could slow the rally in technology and other growth stocks as investors worry about eroding long-term cash flows for these companies.
blockquote>
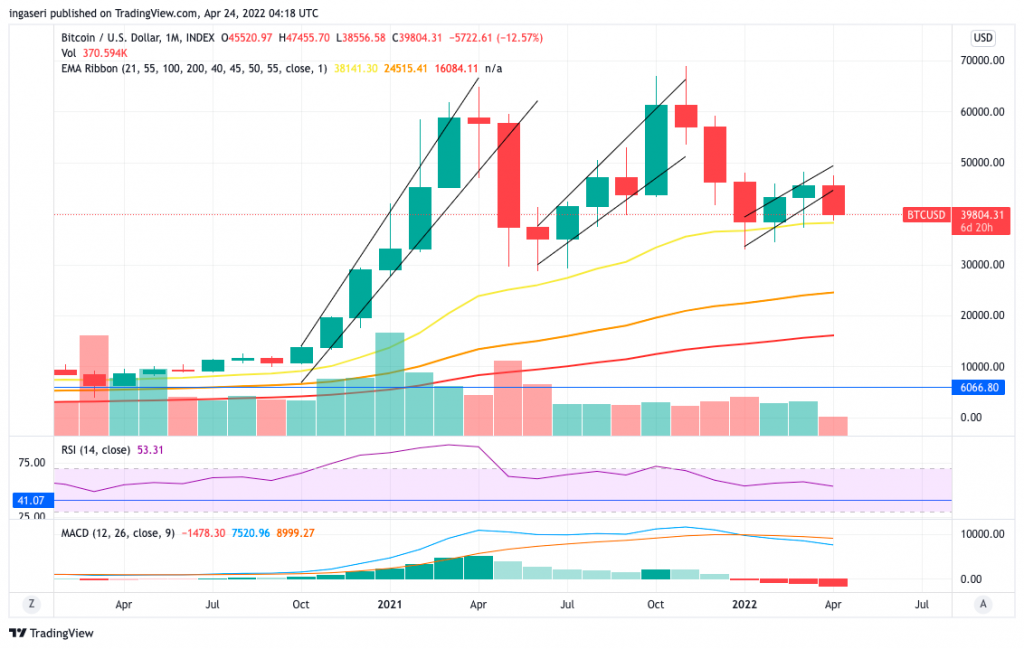
On the monthly chart below, you can see the formation of a bearish flag channel. The support level is at 38,000 US dollars, which is the 21-month EMA. If BTC closes below this level, and there is confirmation for next month that it has become a resistance level, then we have to be careful.
Ether Price Movement 17-23 April 2022
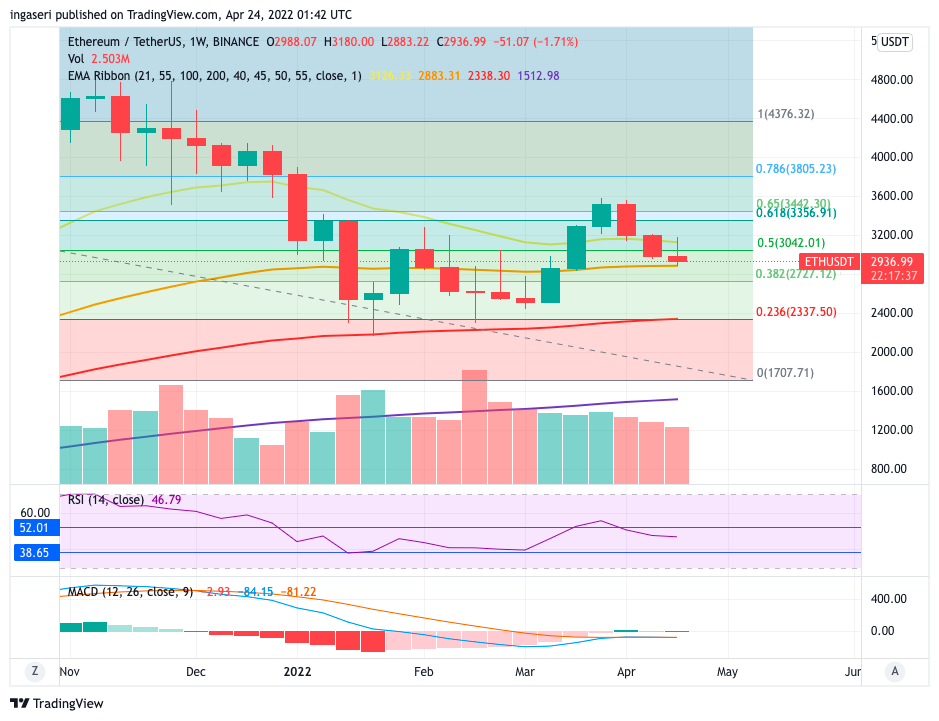
Meanwhile, ETH candle is between the 21 to 55 week EMA, which act as resistance and support, respectively. Support is at the level of 2,880 US dollars, while resistance is at the level of 3,150 US dollars. ETH was unable to surpass the resistance level of 3150 and bears quickly took over the market.
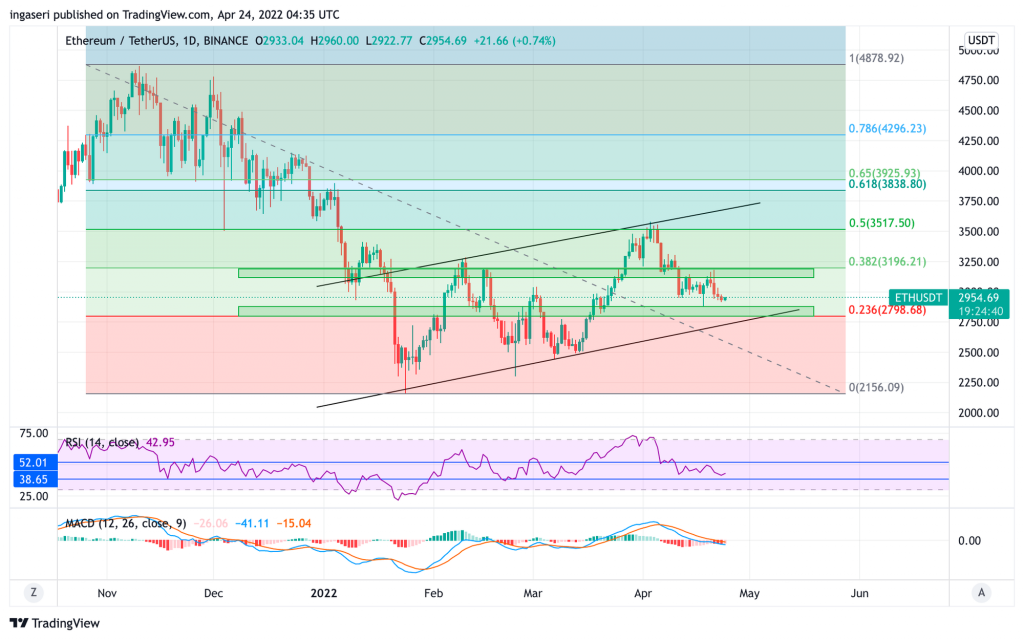
On the daily chart below, it can be seen that the ascending channel formation (starting from mid-January 2022) continues. Note that the sideways market price of ETH ranges from 2,800 to 3,200 US dollars. Above and below the sideways market price would be a good time to sell and buy, respectively.
What else is there to watch out for in the crypto market in the past week?
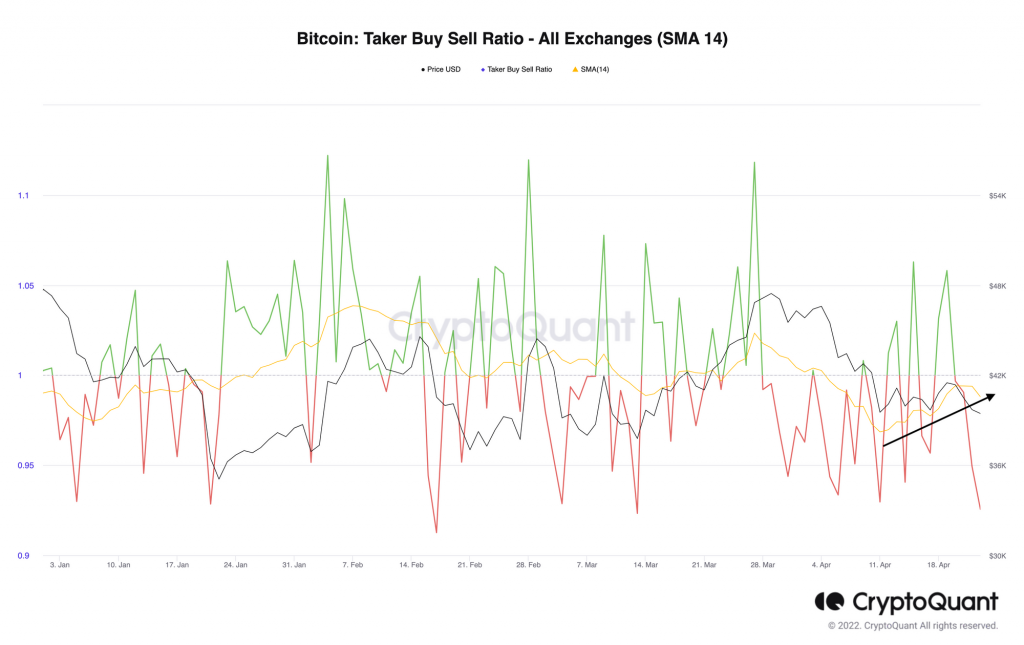
📈 The short-term buying and selling ratio has been on an upward trend since April 10. This means there is more buying volume than selling volume for BTC. Usually, when the trend of this ratio is up then the price of BTC usually responds by moving up. However, the current BTC price has not responded to the increase in purchases. If this ratio continues to increase, then the price of BTC has the potential to rise.
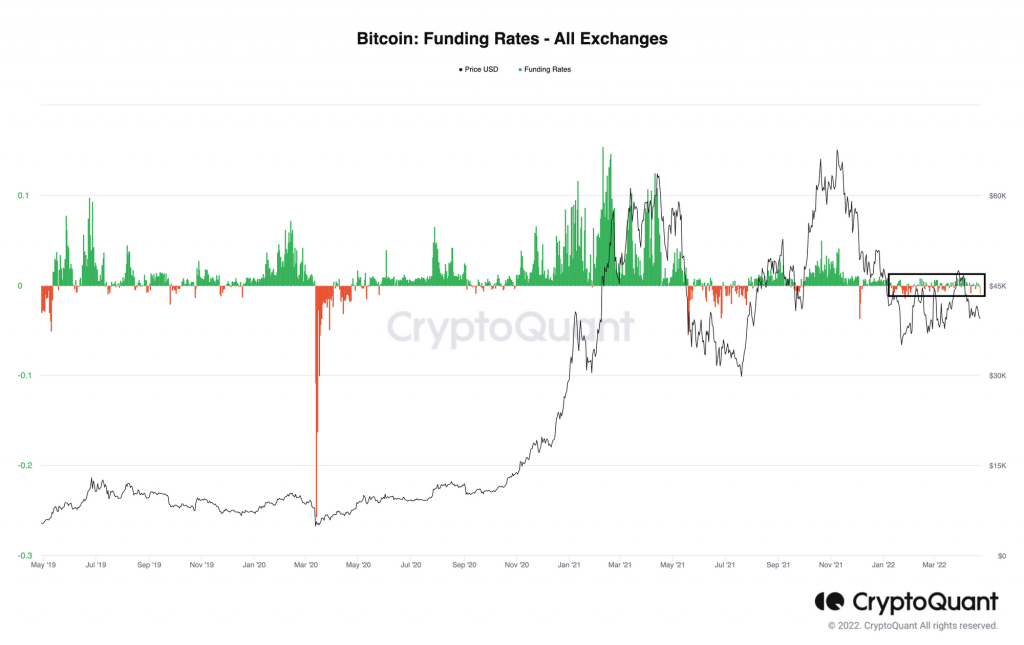
📊 Another interesting point to note is since the beginning of this year, funding rates have been awfully stable. The higher the absolute value of the funding rate is, the more aggressive the traders are. However, the current absolute value of the funding rate has been hovering near zero, which means traders are not aggressive under the prevailing economic conditions.
⚠ The FOMC meeting will take place on May 3-4. The Fed Chair stated that a 50 bps rate hike would be discussed at the May meeting. He emphasized that returning inflation to the 2% target is the main policy at this time. Expect more market volatility in the coming week.
Altcoins News Update
🚀 Yuga Labs leaked the launch date for the BAYC-inspired metaverse project Otherside and announced that the project’s official Discord server is now open. Following the announcement, the APE token price jumped nearly 28% in one day to reach more than US$17 per token on April 20.
More Important News from Crypto World Last One Week
🖼 Coinbase Launches NFT Marketplace: Citing Cointelegraph, marketplace Coinbase’s Non-fungible Token (NFT) has officially launched in beta. In a press conference last week, Coinbase vice president of products and ecosystems, Sanchan Saxena, said that Coinbase’s NFT marketplace design would be a cross between social media platforms and other NFT marketplaces like OpenSea.
👟 Nike Releases Digital Shoe: Quoted from Decrypt, Nike has released its first digital metaverse sneaker, the Ethereum-based RTFKT x Nike Dunk Genesis CryptoKicks. The sneaker giant acquired NFT company RTFKT Studios in December last year.