Market Analysis May 22nd 2023: BTC Continues Sideways, Exhibits Significant Resistance at 100-Week Exponential Moving Average

For two consecutive weeks, the crypto market has remained in a sideways movement. However, the presence of recession concerns and the potential failure of the United States government to raise its debt ceiling may generate negative sentiment. The direction of the market remains uncertain. For a comprehensive analysis of the market, please refer to the detailed review below.
The Pintu trading team has gathered critical information and analyzed the general economic situation and the crypto market’s movements over the past week. However, it should be noted that all information in this Market Analysis is intended for educational purposes, not as financial advice.
Market Analysis Summary
- 🛒 U.S. consumers consistently elevate their retail spending amidst strong indications of an impending recession as predicted by the New York and Cleveland Federal Reserves. This scenario is accompanied by a decline in jobless claims and an uptick in the U.S. Dollar Index.
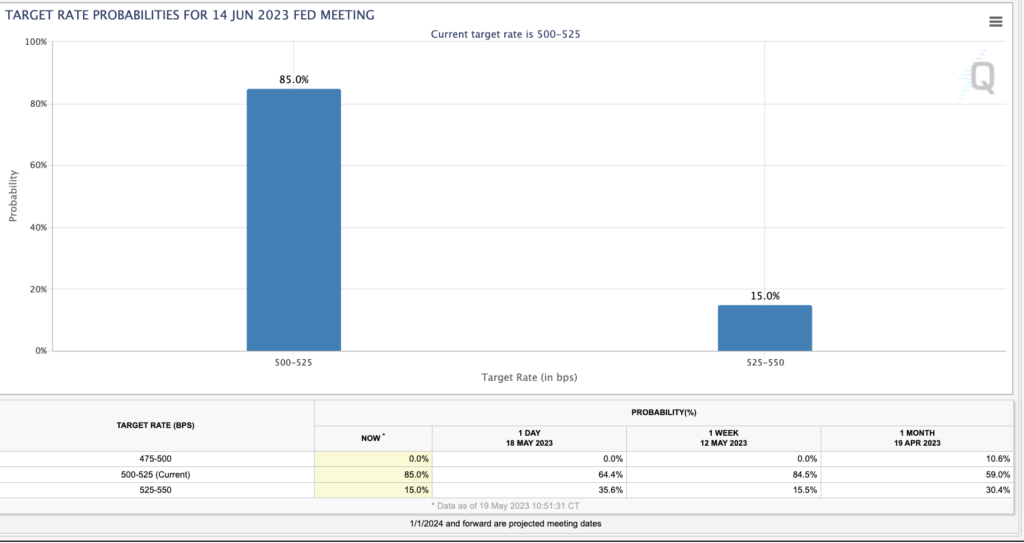
- 👀 President Joe Biden and the Chairman of the United States Congress, Kevin McCarthy, plan to raise the federal government’s debt ceiling, which is predicted to potentially impact market prices. The probability of an interest rate hike in June has decreased from 35.6% to 15%.
- 📉 The crypto market experiences lateral movement, with BTC and ETH sustaining above the 100-week Exponential Moving Average (EMA) resistance. However, ETH has outperformed BTC in the past three weeks.
Macroeconomic Analysis
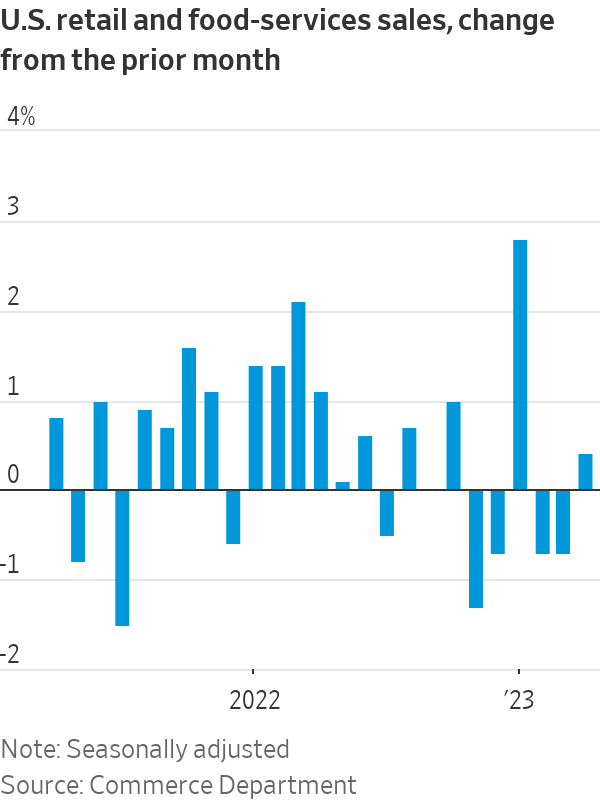
US consumers have shown sustained resilience as retail sales rose in April. This is the first positive growth in three months amid the challenges of high inflation and rising interest rates. Data from the U.S. Department of Commerce showed that retail sales rose 0.4% month-over-month (MoM) in April, versus a consensus of 0.8% and a previous reading of -0.7%. Most of the increase was due to strong online shopping activity.
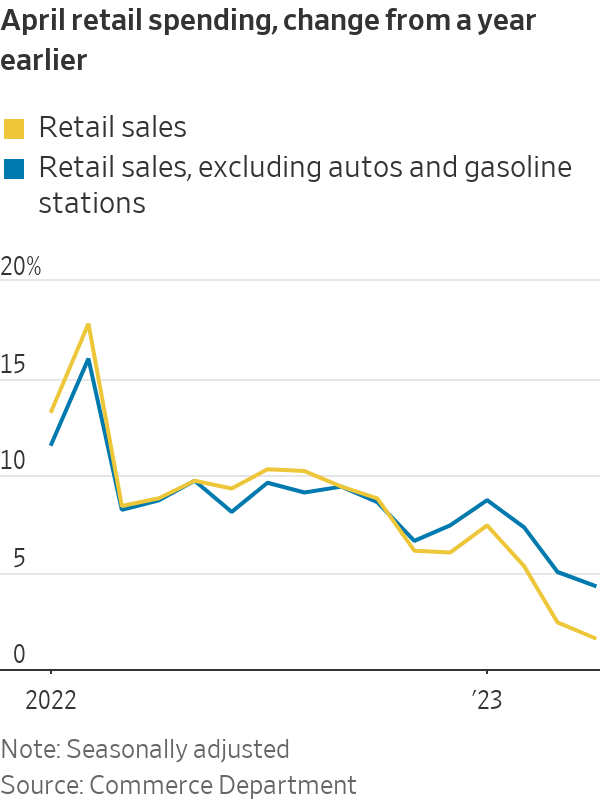
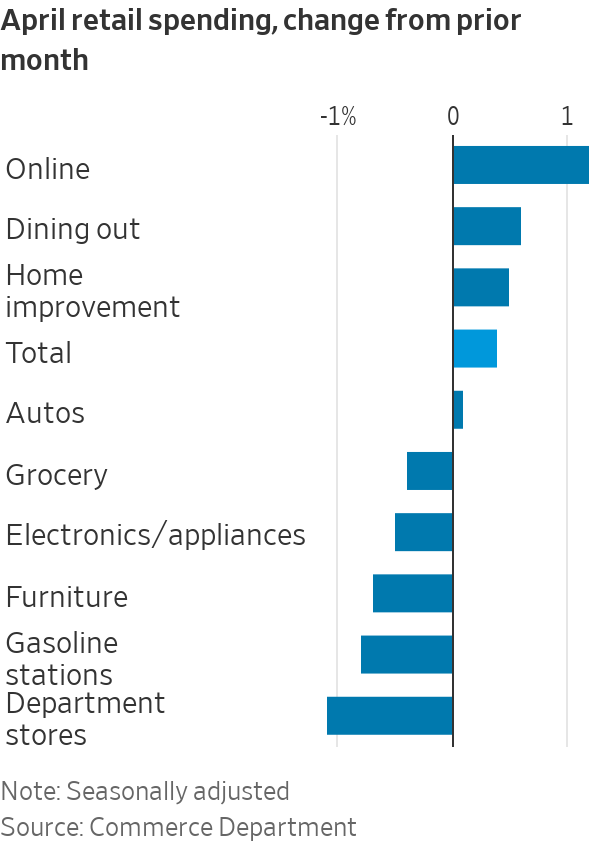
Excluding gas and automotive sales, the positive retail sales performance was 0.6% MoM vs. consensus of 0.2% and -0.5%, respectively. This indicates a relatively strong performance in retail sales. However, most of the growth in retail sales is still concentrated in smaller categories such as Internet sales, general merchandise stores, and building materials and home furnishings stores, which are up. Meanwhile, larger retail categories have experienced lower sales.
Another retail sales sector to watch is food services. According to the data, restaurant sales rose 0.6%, marking the second consecutive monthly increase. The increase in restaurant sales indicates a healthy economy.
The increase in sales and consumer spending plays a crucial role in driving economic progress, and the level of retail sales serves as an important indicator of consumer shopping habits. This positive growth signifies a recovery in the retail sector, which experienced a decline for four months through April 2023. Growth in the consumer retail sector indicates a positive outlook for the economy, suggesting that consumer activity is functioning normally and contributing to economic activity.
However, uncertainty remains as to whether consumers will maintain their current spending patterns in the face of rising inflation and interest rates. For consumer spending to remain stable in the retail sector, it must be supported by a resilient labor market and steadily rising incomes. Conversely, stable spending patterns can be disrupted in the event of an economic recession.
When forecasting recessions, one of the indicators is the 10-2 year yield curve, which has been inverted since last July. However, it is worth noting that there have been instances of 2-year/10-year inversions in the past that were not followed by a recession.
Historically, one of the more reliable indicators has been the spread between the yields on 3-month and 10-year Treasury notes, which provided certainty before inverting in the fall of last year.
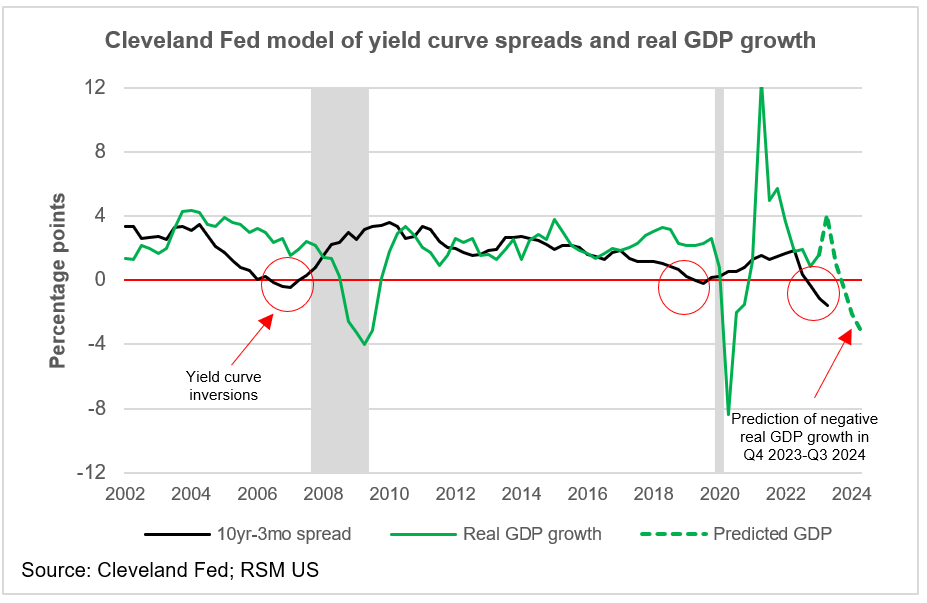
The yield curve models of the New York Federal Reserve Bank and the Cleveland Federal Reserve Bank point to a potential recession within the next 12 months. The New York Fed’s model indicates a 68% probability of a recession, while the Cleveland Fed’s model indicates a slowdown in GDP growth in the second half of this year, accompanied by a 75% probability of a recession within 12 months.
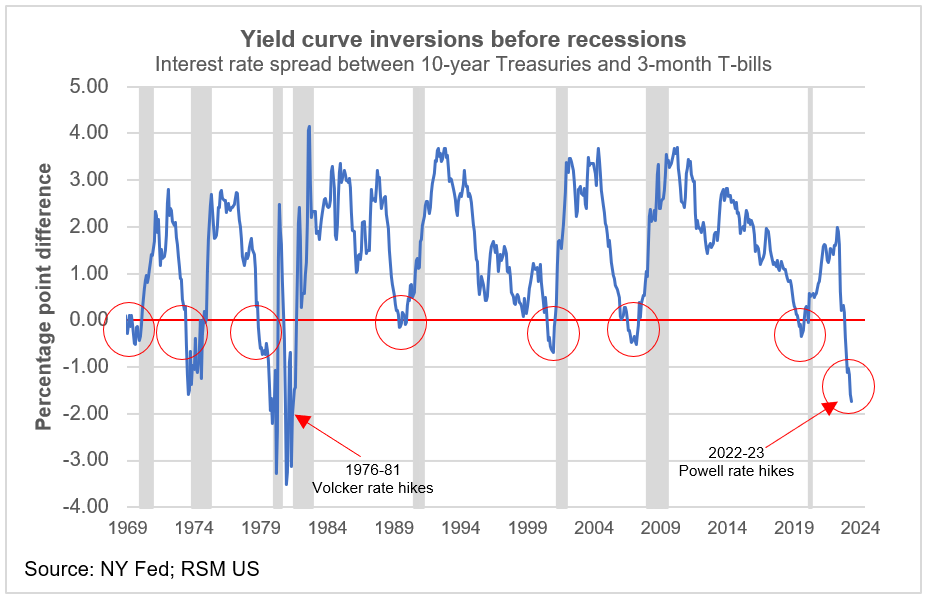
Recessions are closely linked to the Federal Reserve’s (Fed’s) interest rate policy. When the Fed raises the federal funds rate, it can influence expectations of an economic slowdown, leading to increased risk in securities, higher borrowing costs and tighter financial conditions, as we have seen over the past year. There is typically a lag of about nine to twelve months in the transmission of monetary policy to the economy. The reluctance to borrow or lend ultimately contributes to slower economic growth.
Historically, such inversions have occurred prior to every recession in the post-war era. Looking at the data, the three-month Treasury bill rates as of May 12 stood at 5.20%, while the 10-year bond yields were at 3.45%. The significant 175 basis point difference (on an equivalent basis) strongly suggests an impending recession.
However, we do not believe that the current economy is in or approaching a recession (yet). Looking at the data, the current unemployment rate of 3.4% is remarkably low. These data point to a strong labor market with many job openings. The high number of job openings means that the economy is still capable of creating employment opportunities.
In April, 225,000 jobs were added. In addition, with inflation easing and real incomes rising, the economic recovery continues to gain momentum, suggesting a soft landing for the U.S. economy after a year of contractionary measures by the Fed.
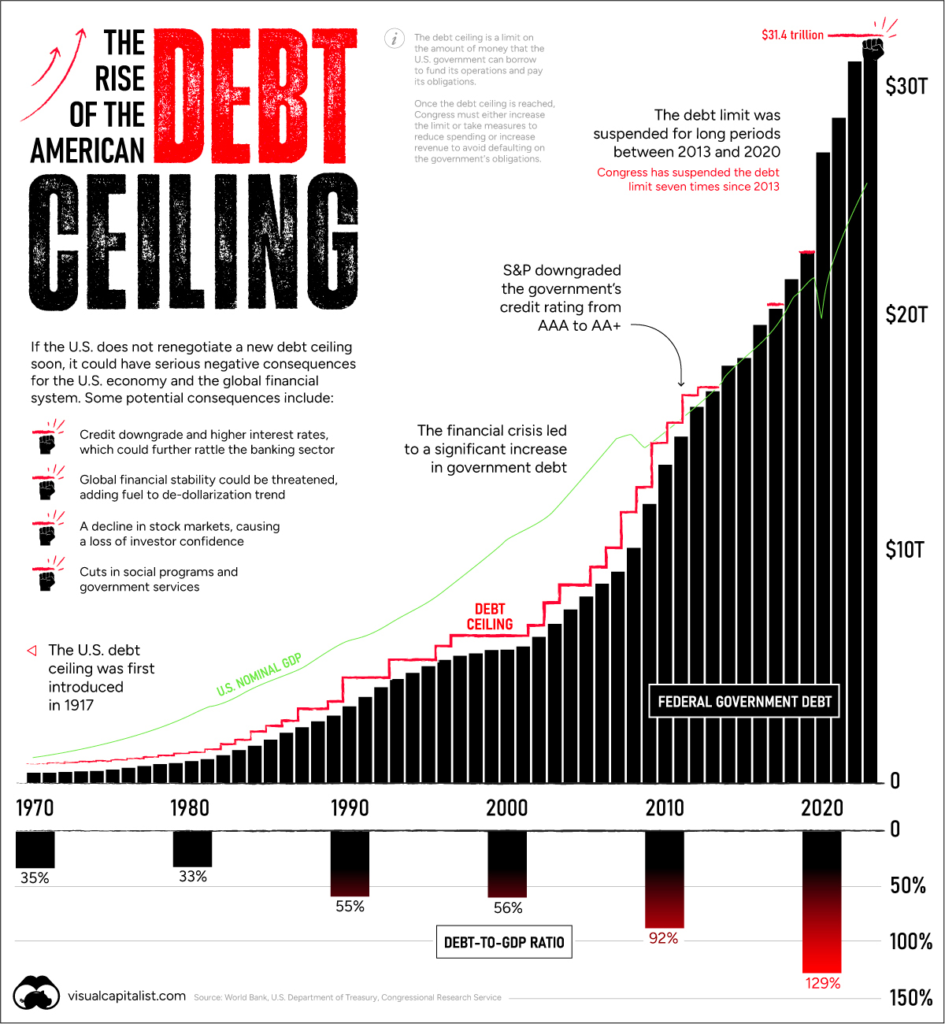
Optimism about the economic recovery hinges heavily on the government’s ability to avoid defaulting on its debt and on the banking system’s successful risk management in dealing with the consequences of the bursting of the zero-interest rate lending bubble.
On Friday of last week, talks on raising the debt ceiling stalled. The day before, however, President Joe Biden and Republican Congressional Leader Kevin McCarthy expressed a strong commitment to quickly negotiate an agreement to raise the federal government’s $31.4 trillion debt ceiling. The goal is to avoid a potentially devastating default that could have severe economic consequences.
Traders have adjusted their expectations for Federal Reserve (Fed) action following reports of a stalemate over the debt ceiling. The probability of a quarter-point rate hike in June fell from 35.6% to 15% in one day. Conversely, traders are now pricing in an 85% chance that Fed policymakers will keep rates between 5% and 5.25% next month.
The debt ceiling developments are having a more significant impact on sentiment than Fed Chairman Jerome Powell’s comments. While Powell suggested that the benchmark interest rate target may not need to be raised significantly due to banks tightening credit, traders focused more on the debt ceiling news.
As a result, all three major U.S. stock indexes fell, and Treasury yields, such as the 2-year and 10-year rates, also fell on the debt ceiling news.
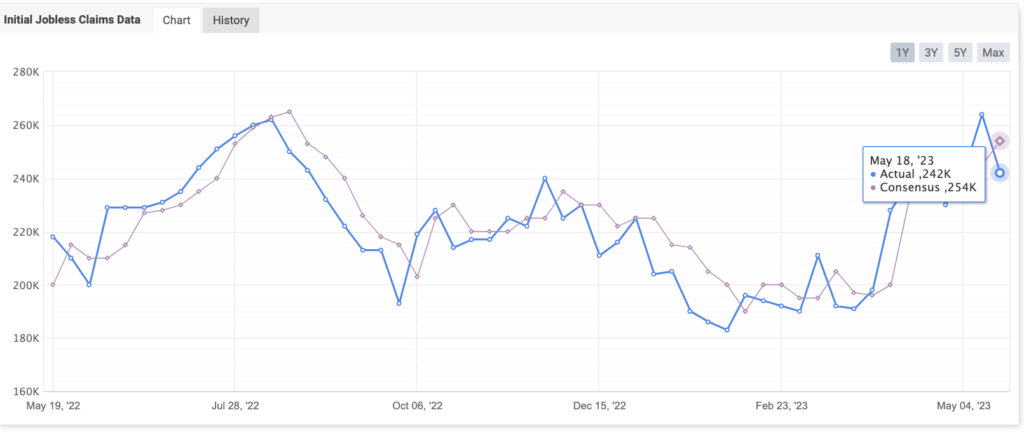
Moving on to the weekly data released by the U.S. Department of Labor (DOL) on Thursday, initial jobless claims for the week ending May 13th came in at 242,000. This figure represents a decrease from the previous week’s total of 264,000 and falls below the market’s expectations of 254,000. Additionally, a more stable trend is indicated by the four-week moving average, which reached 244,250, a decrease of 1,000 from the previous week’s unchanged average of 245,250.
In the week ending May 6, continuing claims decreased by 8,000 to 1.799 million, below the market consensus of 1.818 million. This reading marks the lowest level in nine weeks. The four-week moving average for continuing claims was 1,812,500, a decrease of 15,500 from the previous week’s revised average.
BTC & ETH Price Analysis
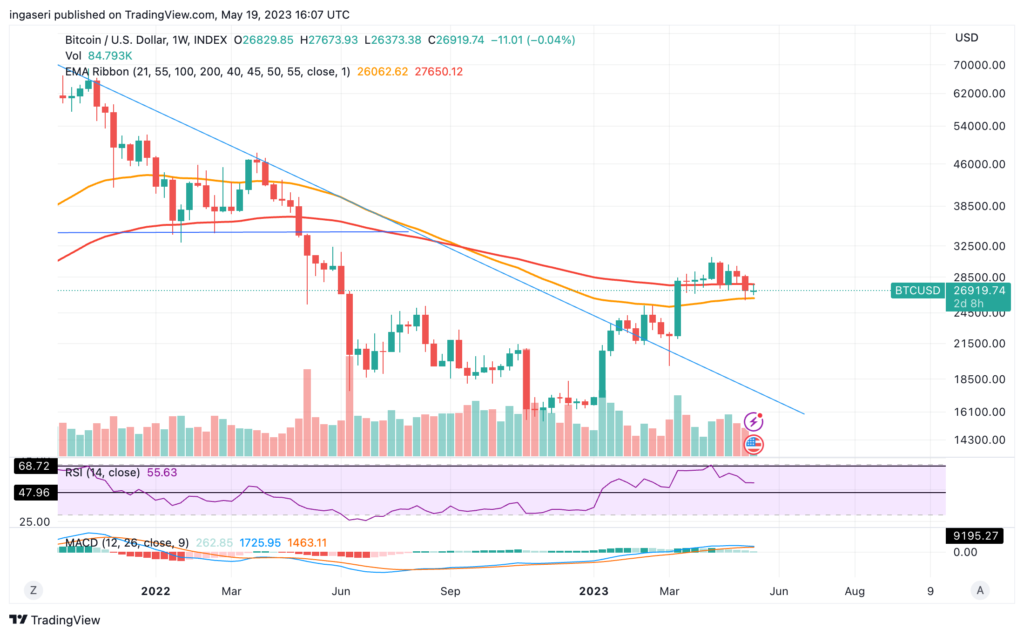
In response to last week’s market conditions, BTC continued to trade sideways throughout the week, forming a doji candlestick on the weekly chart. During this sideways phase, it is important to note that BTC has established its 100-week exponential moving average (EMA) as a strong resistance, with a potential close below the $27,800 level. Therefore, confirmation is needed on two possibilities. First, whether this sideways pattern will continue, or second, whether there will be a deeper correction in the coming weeks if BTC remains below its resistance line.
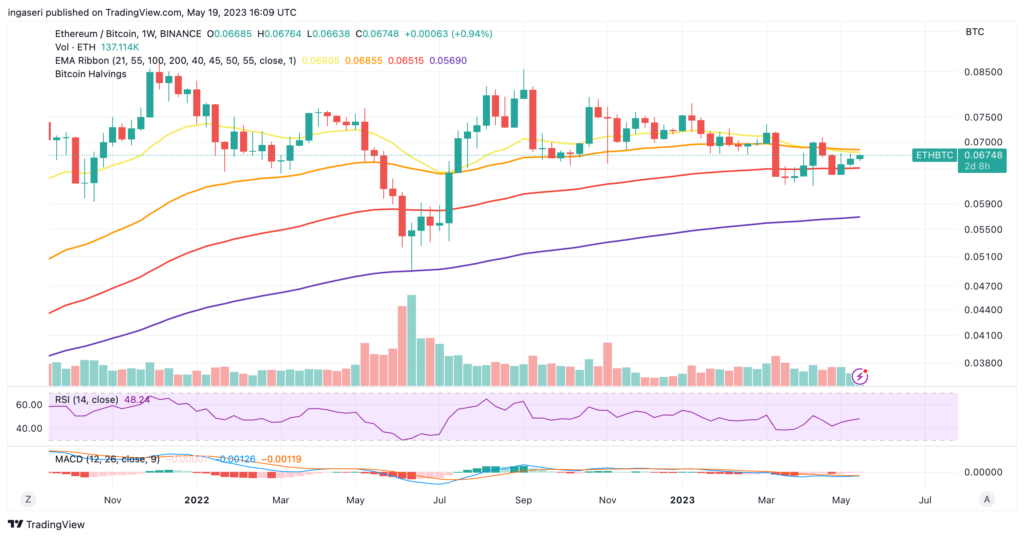
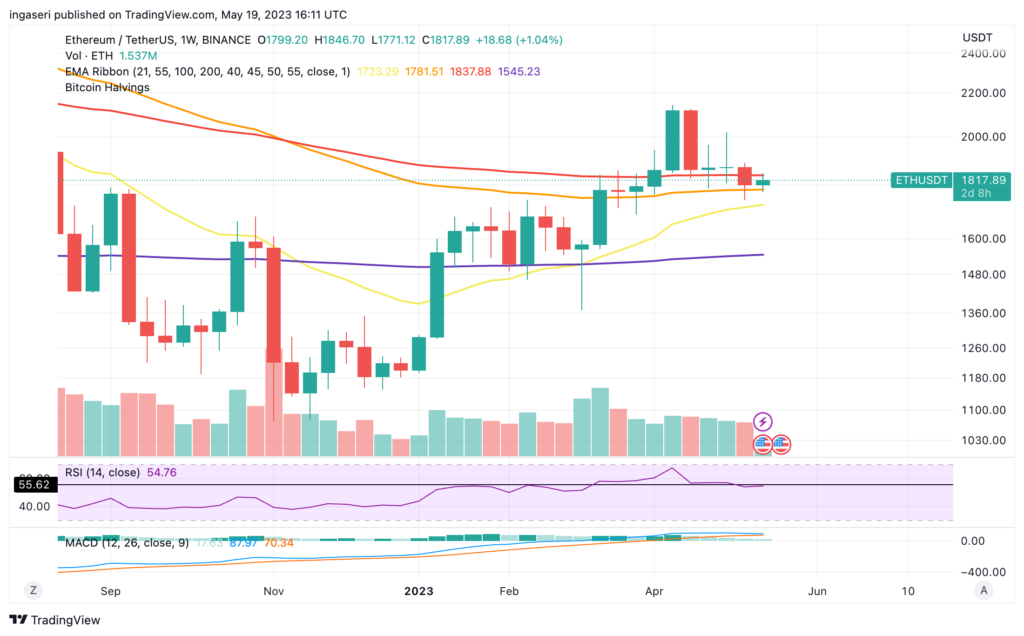
Contrary to BTC, ETH has been outperforming for three consecutive weeks. However, traders still need to be cautious about the price of ETH as it currently sits between the 55-week and 100-day EMAs. In general, the market is expecting more sideways price action in the crypto market until the U.S. debt ceiling issue is resolved. However, if the U.S. fails to raise its debt ceiling, it is advisable to be prepared for a downturn.
On-Chain Analysis
- 📊 Exchange: As the exchange reserve continues to rise, it indicates higher selling pressure. Net deposits on exchanges are low compared to the 7-day average. Lower deposits can be interpreted as lower selling pressure.
- 💻 Miners: Miners’ are selling more holdings compared to its one-year average. Miner’s revenue is in a moderate range, compared to its one-year average.
- 🔗 On-chain: More investors are selling at a profit. In the middle of a bull market, it can indicate a market top. Long term holders’ movement in the last 7days were lower than the average. They have a motive to hold their coins. Investors are in an anxiety phase where they are currently in a state of moderate unrealized profits.
- 🏦Derivatives: Long position traders are dominant and are willing to pay to short traders. Buying sentiment is dominant in the derivatives market. More buy orders are filled by takers. As open interest decreases, it indicates investors are closing futures positions and possibility of trend reversals. In turn, this might trigger the possibility of long/short-squeeze caused by sudden price movement or vice versa.
- 🔀 Technicals: RSI indicates a neutral condition. Stochastic indicates a neutral condition where the current price is in a moderate location between the highest-lowest range of the last 2 weeks.
News About Altcoins
- Tether strengthens its Bitcoin portfolio by allocating 15% of its net operating profit. Tether has announced that starting in May 2023, the company will regularly allocate 15% of its net operating profit to the purchase of bitcoin. Previously, in its Q1 report, Tether revealed that it already had approximately $1.5 billion in bitcoin reserves, which represents 1.8% of its asset reserves.
- Optimism Unveils Bedrock Mainnet Upgrade for Enhanced Ethereum Scalability and Efficiency. Optimism, a layer-two scaling solution for Ethereum, is set to launch its mainnet upgrade called “Bedrock” on June 6th. Bedrock aims to enhance the scalability and efficiency of the Ethereum network, offering faster transaction processing and reduced gas fees.
News from the Crypto World in the Past Week
- The staking yield for ETH has surpassed 8.79%, reaching an all-time high record. According to data from Token Unlock, the annual ETH deposit yield has reached an all-time high of 8.79%. This record-breaking yield comes after the implementation of the Shanghai upgrade, which saw 3.99 million ETH deposited into ETH2.0 contracts, while 2.72 million ETH were withdrawn.
Cryptocurrencies Market Price Over the Past Week
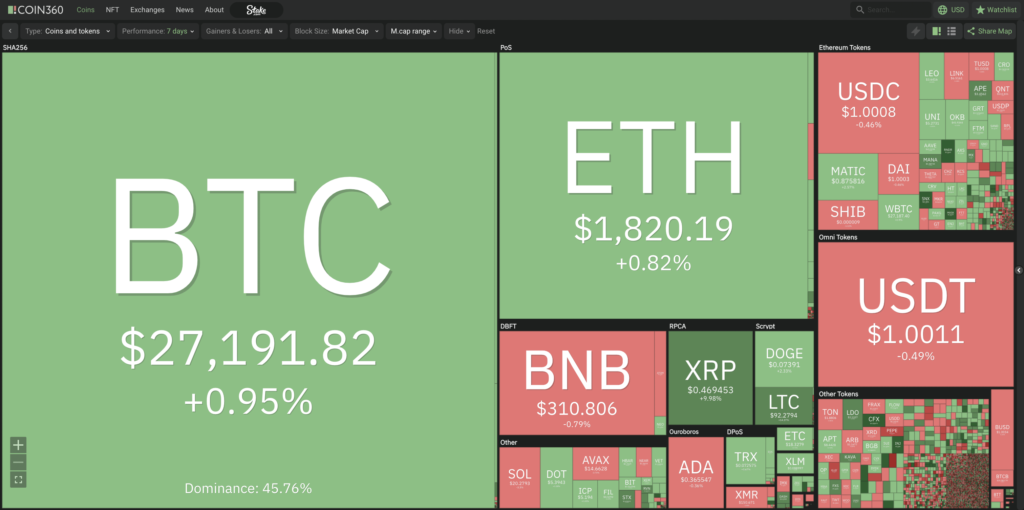
Cryptocurrencies With the Best Performance
- Injective Protocol (INJ) +21,15%
- Synthetix (SNX) +18,06%
- Litecoin (LTC) +14,78%
- Lido DAO (LDO) +13,08%
Cryptocurrencies With the Worst Performance
- Solana (SOL) -2,73%
- THORChain (RUNE) -2,65%
- Quant (QNT) -2,47%
- Theta Network (THETA) -1,87%
References
- Tether, Tether to Further Strengthen Reserves Through Purchase of Bitcoin with Realized Net Operating Profits, Tether.to, accessed on 21 May 2023.
- Token Unlocks, Ethereum Shanghai Unlock, Token.unlocks.app, accessed on 21 May 2023.
- Brian Quarmby, Optimism’s major ‘Bedrock’ upgrade set for June 6, accessed on 22 May 2023.
Share