Market Analysis 14 January 2023: BTC Rallies as US Inflation Rate Drops

The inflation rate in the United States shows positive signs. The FOMC meeting has the potential to reduce interest rates in February. With positive inflation, the Crypto market has been rallying for the past week. As usual, the Pintu trader team has collected a variety of important data about the crypto market in this market analysis. However, you need to note that all information in this market analysis aims at education, not financial advice.
block-heading joli-heading" id="article-summary">Article Summary
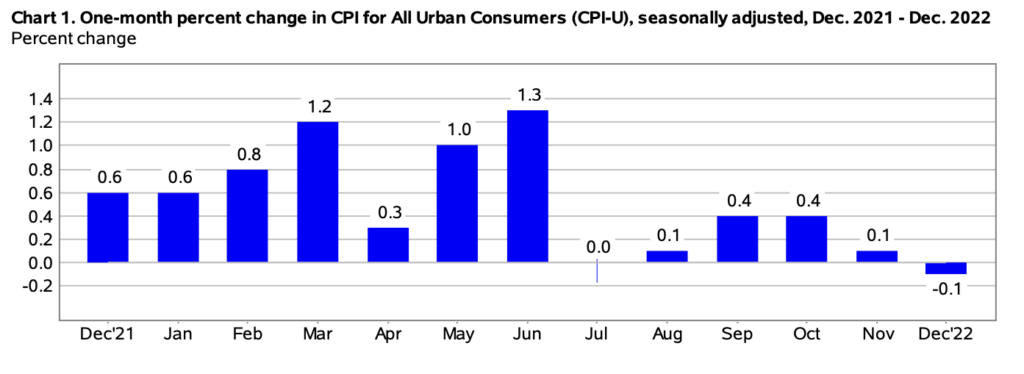
- 📉 The inflation rate has fallen for six consecutive months in December as seen in the Consumer Price Index of the Labor Statistics Bureau explains that the price in December dropped 0.1% compared to November, the first price decline since May 2020.
- 🏦According to CME Group, the market agreed that FOMC is likely to reduce interest rates by 25 points percentage compared to last month (50 points).
- 📈 BTC shows a strong price movement after inflation data is released. Bitcoin managed to rise above MA 300 weeks after being below it for 8 consecutive weeks.
- 💰 Seeing RSI, there is a significant possibility of a rally if BTC manages to survive RSI 41 and exceeds the number 52.
- ⚖️ ETH shows a strong number, up by 19.5% for a week. ETH also managed to rise above the EMA line 200 weeks after surviving for almost 10 weeks below. Then, ETH also has the potential to increase if it succeeded in penetrating the RSI 52.
Macroeconomy Analysis
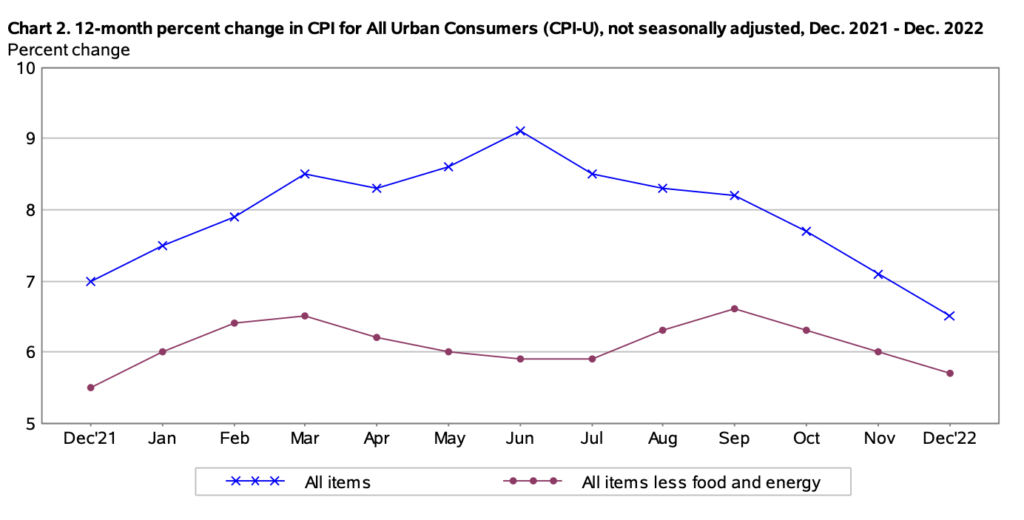
The inflation rate fell for six consecutive months in December, as shown by the Consumer Price Index (CPI). The Labor Statistics Bureau has recently released inflation data, showing that the price of December 6.5% was higher than the previous year and fell 0.1% compared to November, which marked the first price decline since May 2020. The annual price rise is located at the lowest level since October 2021.
Nevertheless, inflation still exists above the typical number and the economy still faces the risk of fluctuations that can cause prices to rise again. However, this data gives hope that the Fed’s efforts to control inflation, especially the job market, will improve in 2023. This shows that the interest rate hikes by The Fed succeeded in reducing an overheated economy back to its stable level.
Another important indicator that must be considered is the monthly PPI (Producers Price Index) data which will be released on January 18.
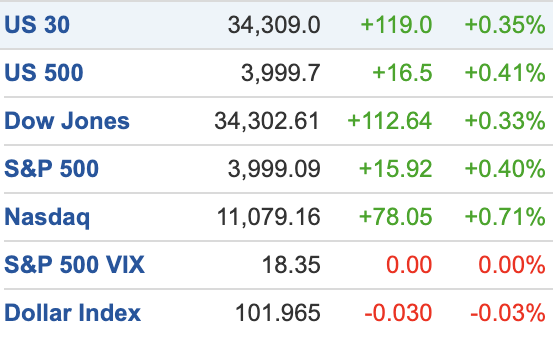
The equities market closed slightly higher on the inflation data release. The Dow Jones industrial average rose nearly 112 points or 0.3 percent. Lastly, the S&P 500 was up 0.4 percent, and the Nasdaq was up 0.7 percent.
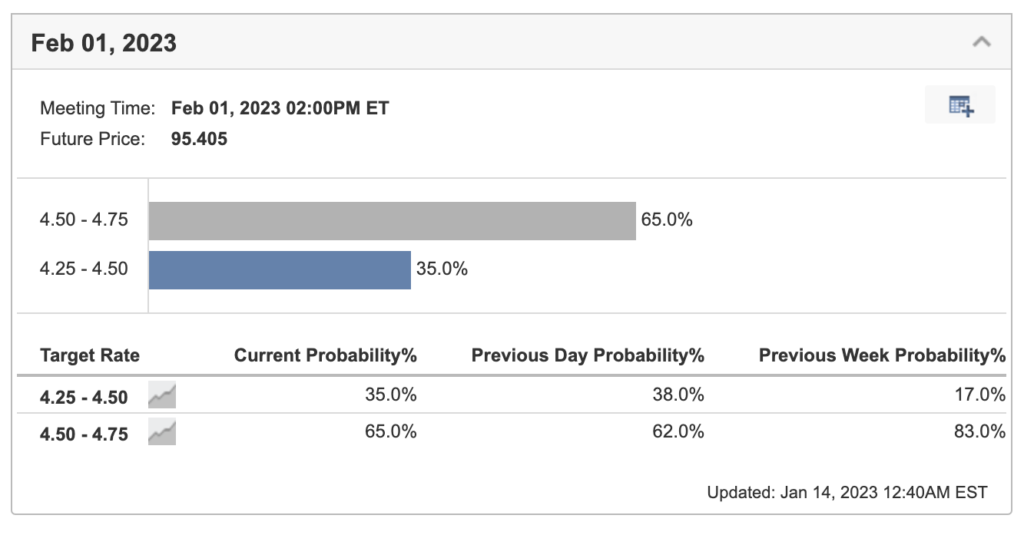
According to CME Group, markets are currently expecting a high likelihood (65%) that the Federal Open Market Committee (FOMC) will decrease the interest rate by 0.25 percentage points on February 1st (from 50 points in December 2022). Additionally, it’s expected that there will be another quarter-point decrease in March, followed by a pause in rate changes, before potentially decreasing the rate by as much as 0.5 percentage points before the end of the year.
bitcoin-price-movement">Bitcoin Price Movement
BTC rebounds sharply because of CPI data. On the weekly chart, BTC rises above the MA 300 weeks resistance line after spending 8 weeks below it. BTC is then resisted on the 250 weeks MA. On RSI, we have exceeded the value of 41, which historically became a potential platform for greater price movement to the upside. Another similarity is RSI 52, passing this number will potentially give us a significant upward movement.
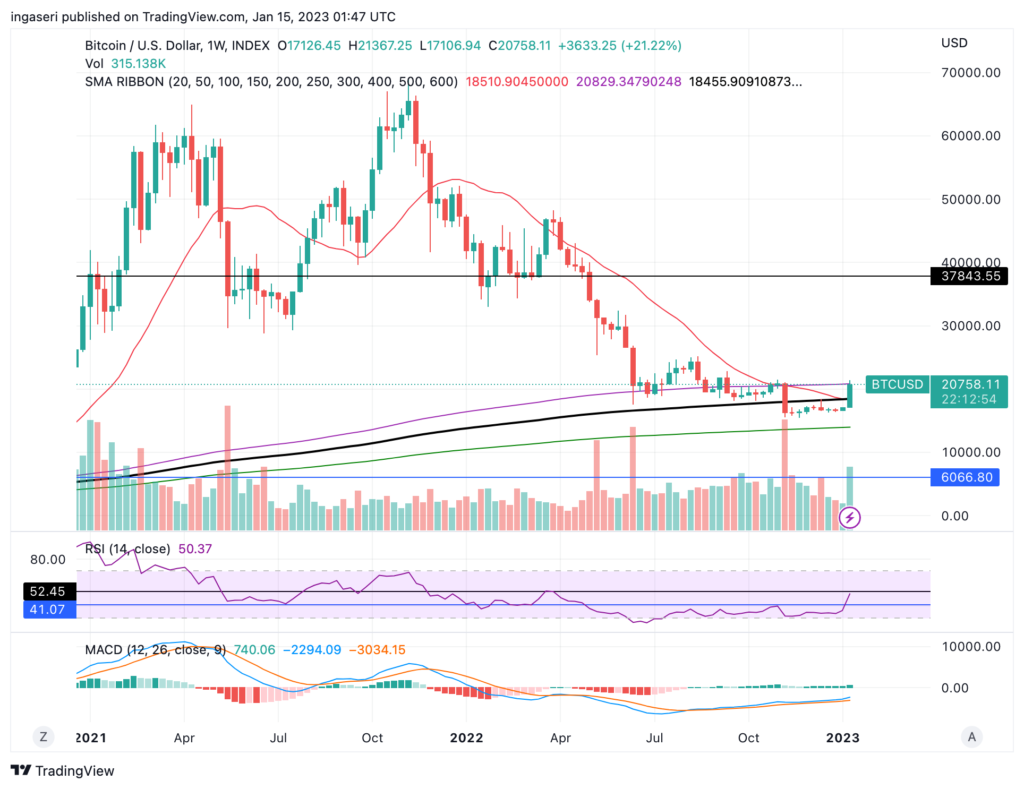
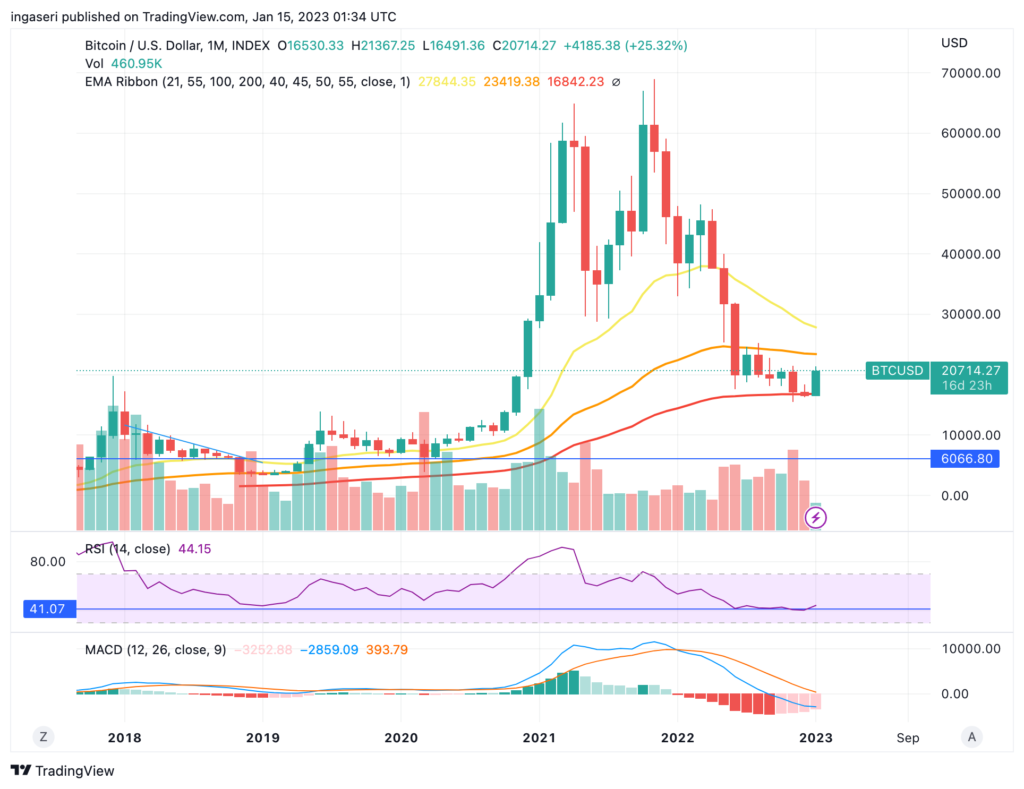
In the monthly graph, BTC rises above the 100-month EMA support line. Initially, BTC was below the line and is looking for a potential breakdown. One of the strong indicators that validate the assumption that we have reached the bottom is the monthly candle closure. If we close above this support line, most likely we have reached the bottom.
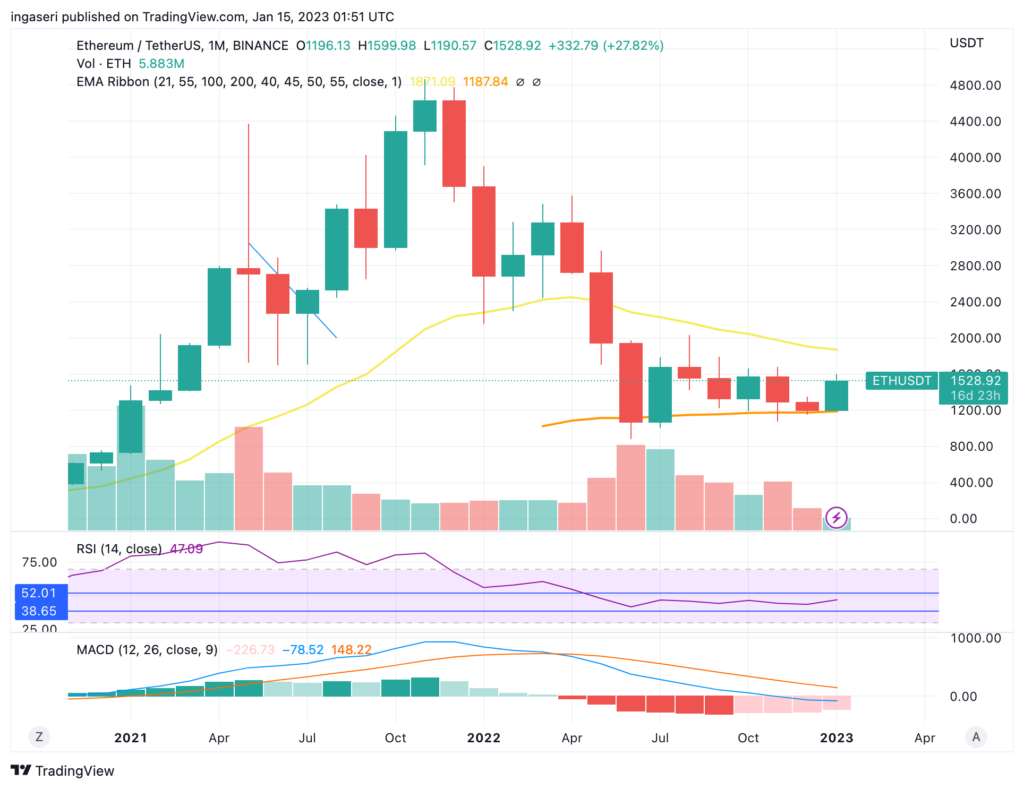
Ethereum Price Movement
In the weekly chart, ETH has risen 19.5% in a week. ETH also shows a sign of strength by rising above the 200-weeks EMA after trading below it for almost 10 weeks. We need further confirmation with the closing of the weekly candle above the line. Additionally, RSI 52 is also an important indicator to confirm we have the potential for a strong upside movement.
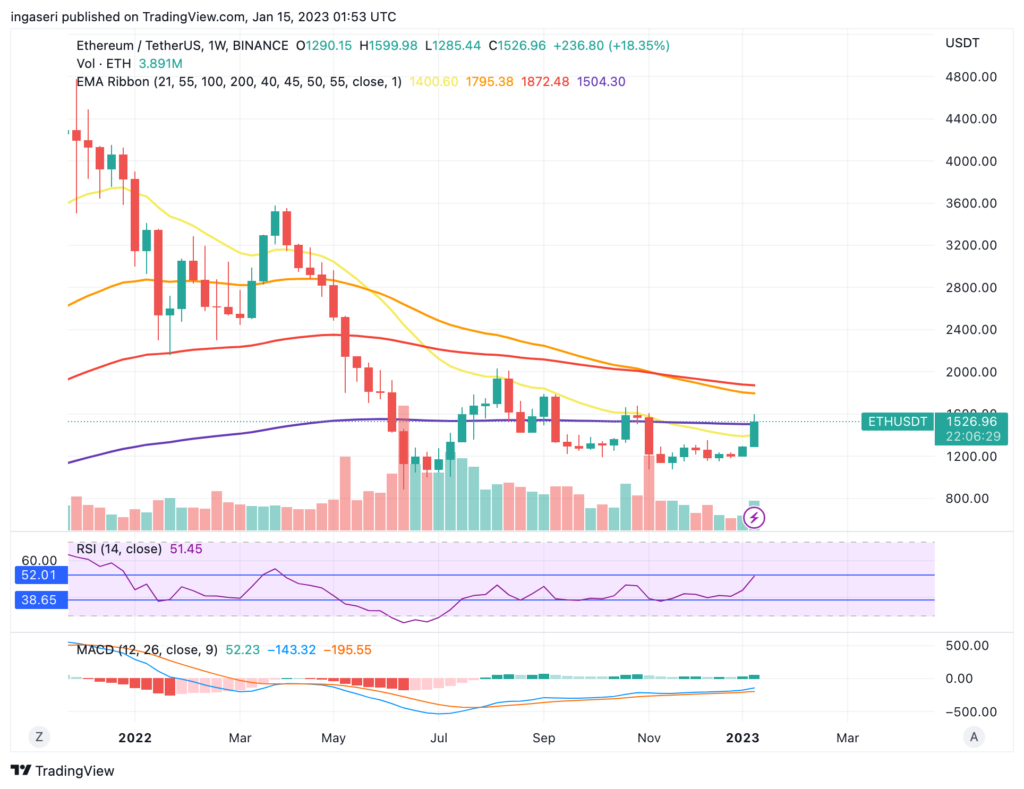
In the monthly chart, we can see ETH has made EMA 55-month support. To find out that this is valid support, we need the monthly candle to close above this line.
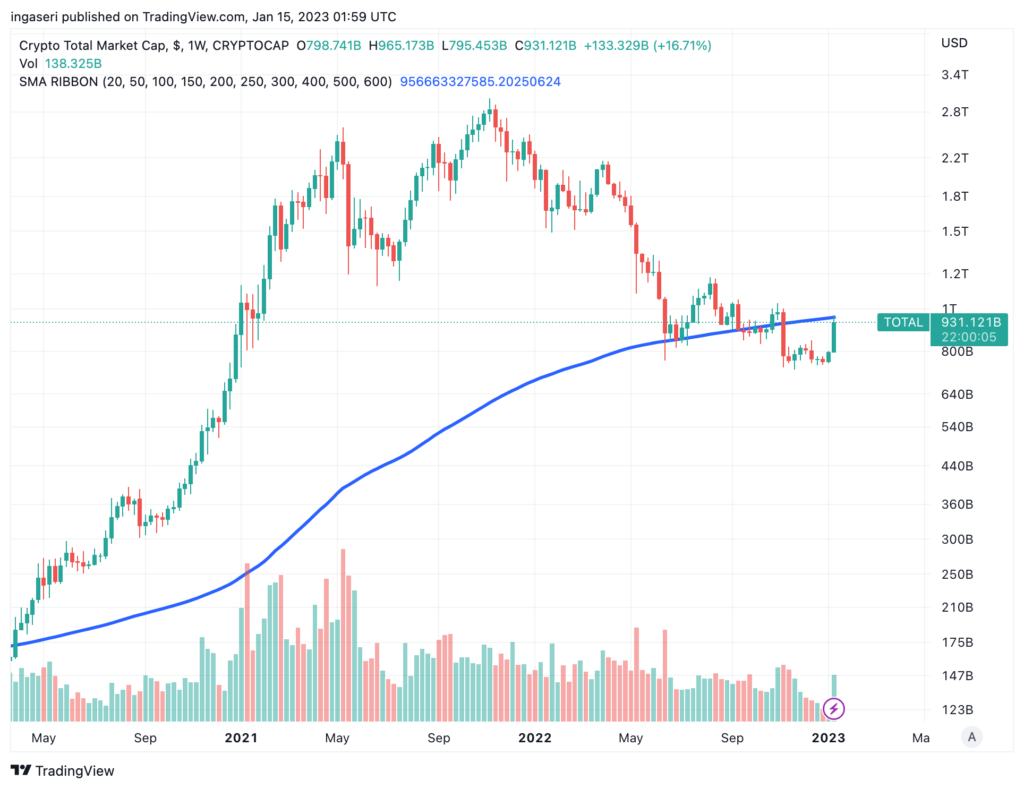
Analysis of Crypto Market Capitalization
Although there is a strong momentum after inflation data was released, the total crypto market cap still failed to pass the 200-week MA. We need further confirmation and a confluence of indicators to ensure that we have reached the bottom.
On-Chain Analysis:
- 📊 Exchange: As the exchange reserve continues to fall, it indicates lower selling pressure. Net deposits on exchanges are high compared to the 7-day average. Higher deposits can be interpreted as higher selling pressure.
- 💻 Miners: Miners’ are selling holdings in a moderate range compared to its one-year average. Miner’s revenue is in a moderate range, compared to its one-year average.
- 🔗 On-Chain Indicators: More investors are selling at a profit. In the middle of a bull market, it can indicate a market top. Furthermore, long-term holders’ movement in the last 7 days was lower than the average. They have the motive to hold their coins. Investors are in a fear phase where they are currently with unrealized profits that are slightly more than losses.
- 🏦Derivatives: Long-position traders are dominant and are willing to pay short traders. Selling sentiment is dominant in the derivatives market. Additionally, more sell orders are filled by takers. As open interest increases, it indicates more liquidity, volatility, and attention are coming into the derivative market. The increasing trend in open interest could support the ongoing price trend.
- 📉 Technicals: RSI indicates an overbought condition where 99.00% of price movement in the last 2 weeks has been up and a trend reversal can occur. Stochastic indicates a neutral condition where the current price is in a moderate location between the highest-lowest range of the last 2 weeks.
Read also: Introduction to Technical Analysis in Cryptocurrency
Altcoin News
- Ethereum Shanghai Upgrade: The Core Ethereum Developers explained that the Shanghai upgrade will be launched on schedule in March. This update enables withdrawal features for ETH staking. With Shanghai, all ETH that has been locked since The Merge can be withdrawn (worth $ 22.7 billion).
- Polygon Hard Fork: Polygon announced that they would do a hard Fork on January 17 to handle the gas spikes and chain reorganization (which occurred because some nodes reached consensus at different times). Polygon is a platform for several large Dapps such as Uniswap.
More News from Crypto World in the Last Week
- SEC Demands Gemini and DCG: Securities and Exchange Commission (SEC) US demands Genesis and Gemini on charges of selling illegal and unregistered securities through the Gemini Earn product. The crypto community’s views on this are divided. Some agreed that the failure of Earn Gemini products is proof that programs like this must be prohibited while others questioned why the SEC only charged Gemini now when customers are already at loss.
- Bulgaria police ambushed the Nexo office: Bulgarian police searched several places related to Nexo, one of the crypto lending platforms in the country. Bulgaria officials searched 15 addresses related to the Nexo office because Nexo was allegedly related to terrorism financing. Nexo’s representation explained that they would cooperate with the authorities and this search did not affect users.
- FTX managed to recover $ 5 billion in funds: Andy Dietderich, one of FTX’s lawyers said that they had succeeded in recovering $5 billion in cash and Liquid cryptocurrencies. Dietderich also explained that FTX plans to sell non-strategic investment assets worth $4.6 billion to recover users’ funds.
Crypto Market Price Over the Past Week
Cryptocurrencies With the Best Performance
- Aptos (APT) +129%
- Solana (SOL) +81,73%
- Ethereum Classic (ETC) +69,22
- Optimism (OP) +61,93%
References
- Sander Lutz, Ethereum Developers Say Shanghai Upgrade Remains on Track for March, Decrypt, accessed on January 2023.
- Vishal Chawla, The Block: Polygon eyes hard fork in January to address reorgs and gas fee spikes: Exclusive, The Block, accessed on 16 January 2023.
- Jason Nelson, SEC Hits Genesis, Gemini With Securities Law Violations for Gemini Earn Program, Decrypt, accessed on 16 January 2023.
- Aleksandar Gilbert, Bulgarian Police Raid Nexo Office, Defiant, accessed on 16 January 2023.
- Zhiyuan Sun, FTX has recovered over $5B in cash and liquid crypto, Coin Telegraph, accessed on 16 January 2023.
Share