Introduction to Technical Analysis in Cryptocurrency
Investing and trading require a clear understanding of the various aspects of the coin or stock that you want to buy. One of the ways to determine the value and trend of an asset is by using technical analysis. So, what is technical analysis? Why is it so important to choose a crypto asset? This article will explain various things about technical analysis.
Article Summary
- Technical analysis is an analytical method that uses mathematical indicators to predict the future trend of an asset based on previous price movements. The basic principle of technical analysis is Identifying trends and patterns of an asset.
- Asset prices are a reflection of various information including global events, news about the asset, and how market participants value the asset. Then, every price movement experienced by the asset is part of the broad market trend.
- Some of the important elements of technical analysis are reading candlestick charts, determining support and resistance levels, creating trend lines, and using technical indicators. All of these elements can help you make a comprehensive and accurate technical analysis.
What is Technical Analysis?
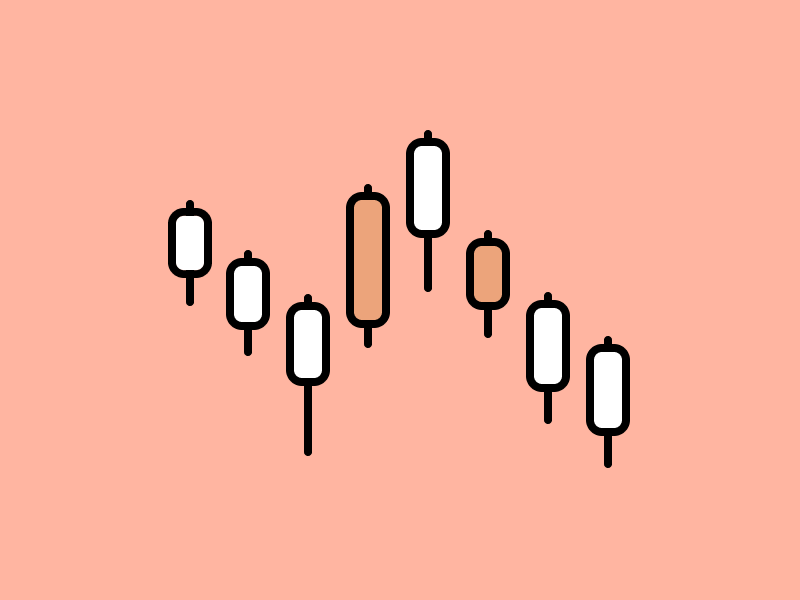
Technical analysis is an analytical method that uses mathematical indicators to predict the future trend of an asset based on its past price movements. The basic principle of technical analysis is identifying trends and patterns of movement of an asset. In general, these trends are repetitive, so you can use them to buy assets at the right time and price.
Why is technical analysis important? An investor ideally buys an asset at a low price and sells it at a higher price in order to make a profit. Performing technical analysis is one way to identify the trend of the asset to determine when to buy it.
The price chart is not just a simple number made into a line. A price chart represents investors behavior and interest in an asset from time to time.
However, we need to understand technical analysis does not have 100% accuracy. Everyone has their own choice of analytical tools and indicators so they usually come to different conclusions. However, we can understand some of the basic principles and essential elements of technical analysis to produce accurate analysis.
Basic Principles of Technical Analysis
- History tends to repeat itself: This assumption is based on humans as market participants who are influenced by various psychological factors. These psychological factors tend to influence our behavior when faced with certain situations. In the long term, our behavior as market participants tends to repeat itself and form a certain pattern.
- The price of an asset is a reflection of various factors: This principle assumes that the price of an asset already reflects all factors and information related to it. Thus, the current price is a reflection of various information, including global events, news about the asset, and how market participants value the asset.
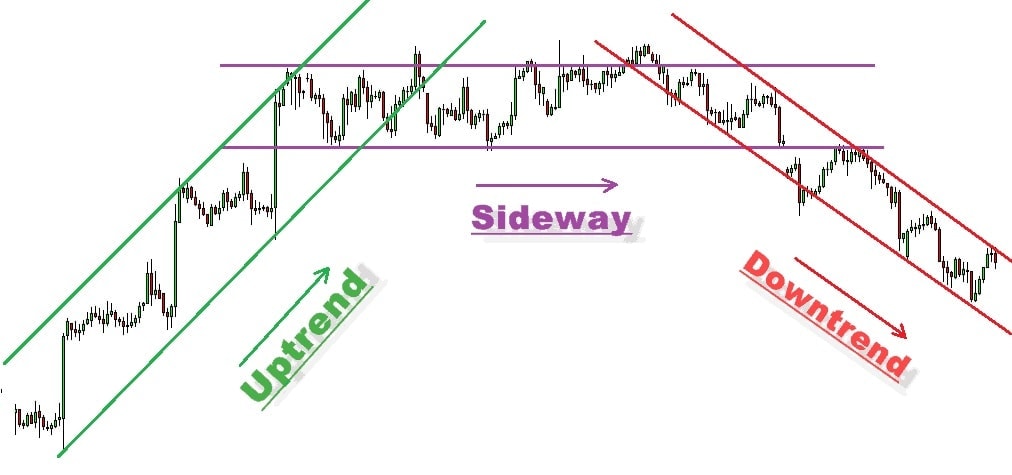
- The price moves as part of the market trend: The price of an asset moves following the broader trend of the market. In the case of Bitcoin, its price movements are a reflection of crypto market trends that have a major impact on other crypto assets. Understanding market trends can prevent FOMO behavior and panic selling when the market experiences a drastic decline or price increase.
- 3 stages in a trend: According to Dow theory, every major trend will go through 3 stages, which are accumulation, uptrend, and distribution stages. The accumulation stage is the initial phase where investor confidence in assets is still low, but some ‘smart’ investors have started to accumulate assets in anticipation of an uptrend. The uptrend is the stage where the asset is going up, and investors/traders start to notice. Finally, the distribution stage is a sign that the trend is about to end and early investors start selling assets.
Several Important Elements of Technical Analysis
1. Reading Candlestick chart
The candlestick price chart is one of the most frequently used charts by investors and traders because it provides a lot of detailed information about the price of an asset. First, you can change the time of the chart to form minutes to weekly candles. This is useful for see long or short-term trends. There are several important elements that you need to understand in a candlestick chart:
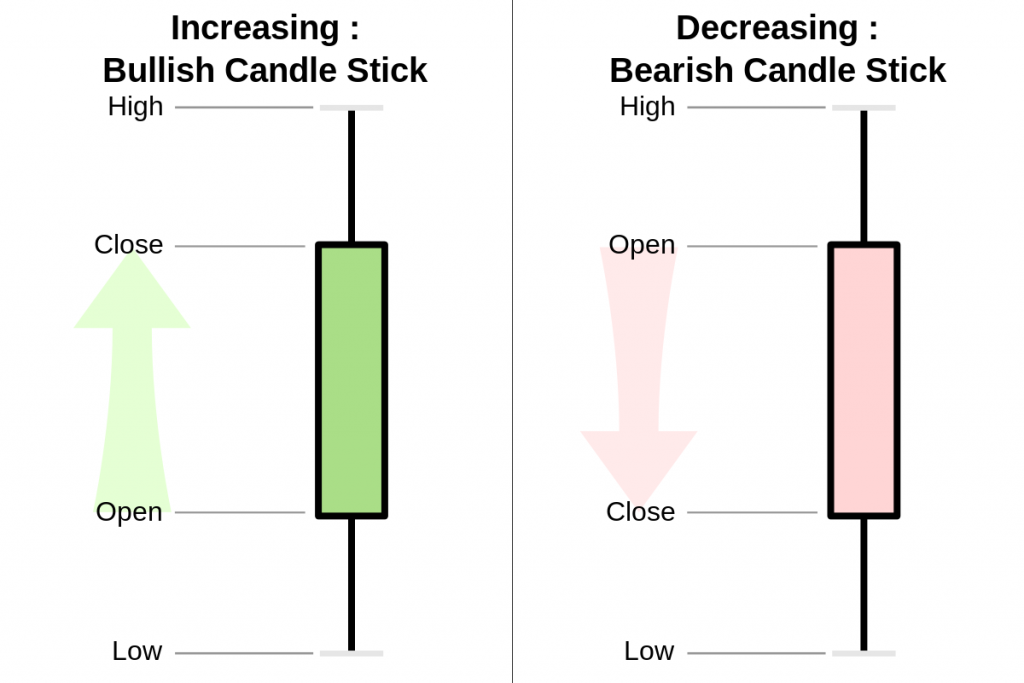
- Open and close: The opening and closing prices are represented by the ‘body’ in the form of a thick bar inside each candle.
- High and low prices: The highest and lowest prices are represented by a thin line commonly referred to as a ‘wick’.
- Red candle: A red candlestick represents a price decrease. In this candle, the closing price is below the bar while the top candle body represents the opening price.
- Green candle: A green candlestick represents a price increase. In this case, the closing price is at the top of the bar while the bottom candle body indicates the opening price.
2. Determining Support and Resistance Levels
Support and resistance are the two most important terms that need to be understood in technical analysis. These two levels basically signify the price point at which an asset reaches its bottom price and the peak price. At support, buyers will start to enter and buy the asset. On the other hand, resistance is where a lot of people sell the asset. However, these price points constantly change as the asset undergoes an upward or downward trend.
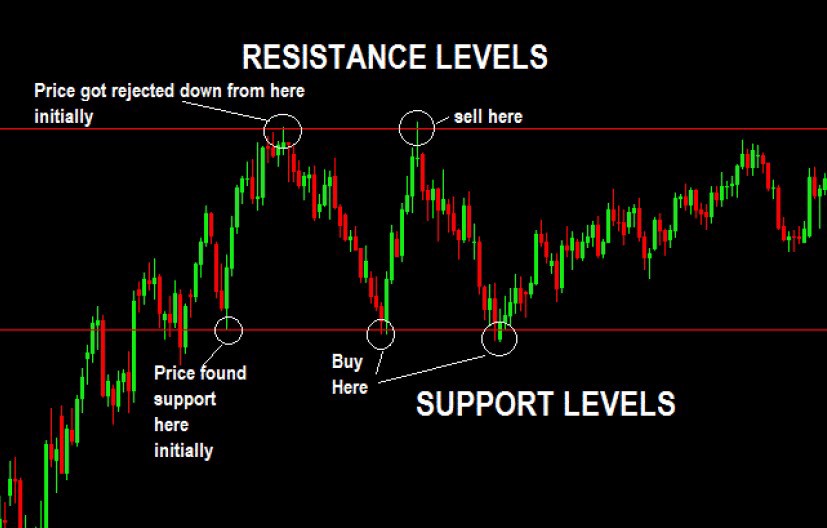
Round numbers like $1, $100, $1000, or $5000 often become strong support or resistance levels because of a psychological factor. In a trend, these two levels are important signals that we need to pay attention to. The bullish trend is a situation where the asset continues to penetrate several resistance levels to reach a higher price. On the other hand, a bearish trend is where the asset continues to fall through support levels in the process of forming a ‘bottom’ or a price floor.
To understand more on how you can use support and resistance, read this article: Determining support and resistance.
3. Drawing Trendline
Trend lines are one of the basic techniques that most investors and traders use to identify trends in price charts. A trend line is basically a line that connects several high or low-price points (or support and resistance points). A trendline is the most basic tool to determine a trend.
In addition, it is also used to see trend changes when the price of crypto assets moves below or rises above the line. Below is an important example of a fakeout when the price initially blows past the trend line but continues its downtrend.
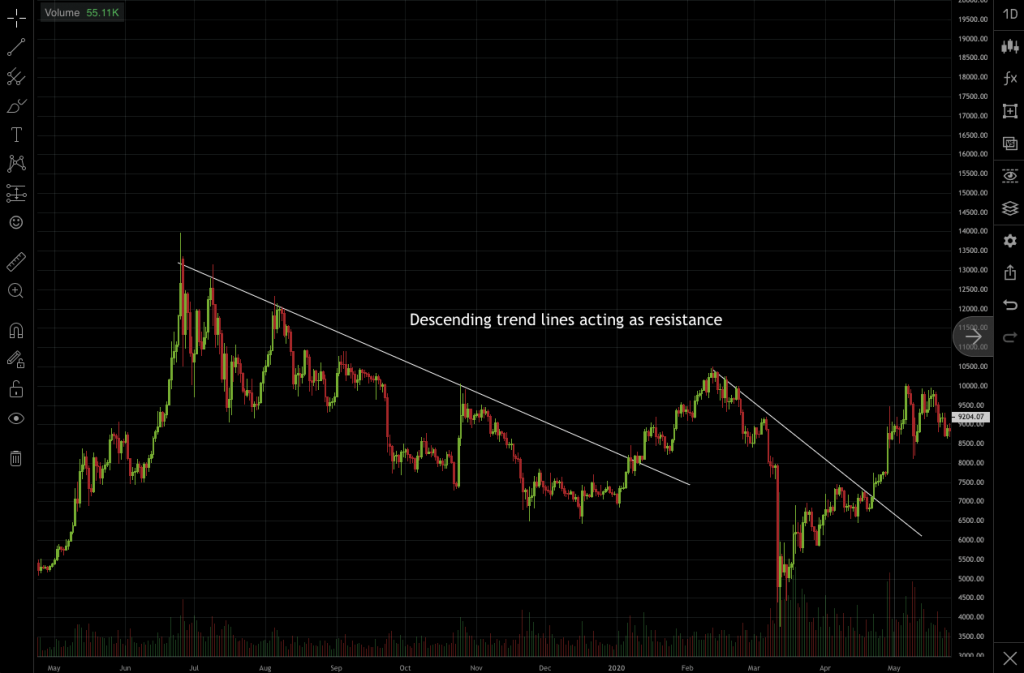
Trend lines in the BTC price chart show a downtrend. Source: Brave New Coin
An accurate trend line is a line that touches several important prices, whether it is a low or high point. In addition, the direction of the trend line depends on the trend pattern you want to determine. Even so, trend line analysis should be accompanied by technical indicators that will help you get additional information.
An accurate trendline can help you predict the direction of the asset. It is one of the most basic aspect of technical analysis
4. Understanding Technical Indicators
Technical indicators are mathematical calculations to identify trends and predict the price of an asset. Most investors and traders also use these indicators to select crypto assets based on their price movements. In addition, some of these technical indicators can provide you with information to determine support and resistance levels, find out short-term trends, and also see price patterns.
Some of the most frequently used important technical indicators:
- EMA: Exponential Moving Average (EMA) or exponential moving average is an indicator that shows the movement of asset prices when averaged over a certain period of time. EMA gives higher weight to newer prices so it provides accurate information on asset price movements.
- RSI: Relative Strength Index (RSI) is a price momentum indicator that uses a 0-100 number measurement. It signifies asset momentum, indicating whether an asset is in a downtrend or uptrend.
Identifying Chart Patterns
One of the benefits of conducting technical analysis on cryptocurrencies is the ability to identify chart patterns. These patterns can give you information to sell or buy an asset before a drastic price movement occurs. In addition, identifying patterns is also useful for traders who want to make profits through scalping or day trading.
Several patterns in crypto
- Cup and handle: A bullish price pattern forms a cup and a handle. This pattern starts with a decline in price forming the letter U, reverses, and forms a bullish pattern that pushes the price upwards.
- Falling wedge: A Falling wedge is a bullish reversal pattern when the price continues to decline and reaches a point where it will reverse and break through the resistance point. One way to identify this pattern is to look at the correlation between prices and increasing volume.
- Rising wedge: Rising wedge is one of the bearish reversal patterns, which is marked by a price increase to the point where it reverses, experiences a decline in price, and breaks through a support level. Like a falling wedge, you can see a correlation between price and a steadily decreasing volume.
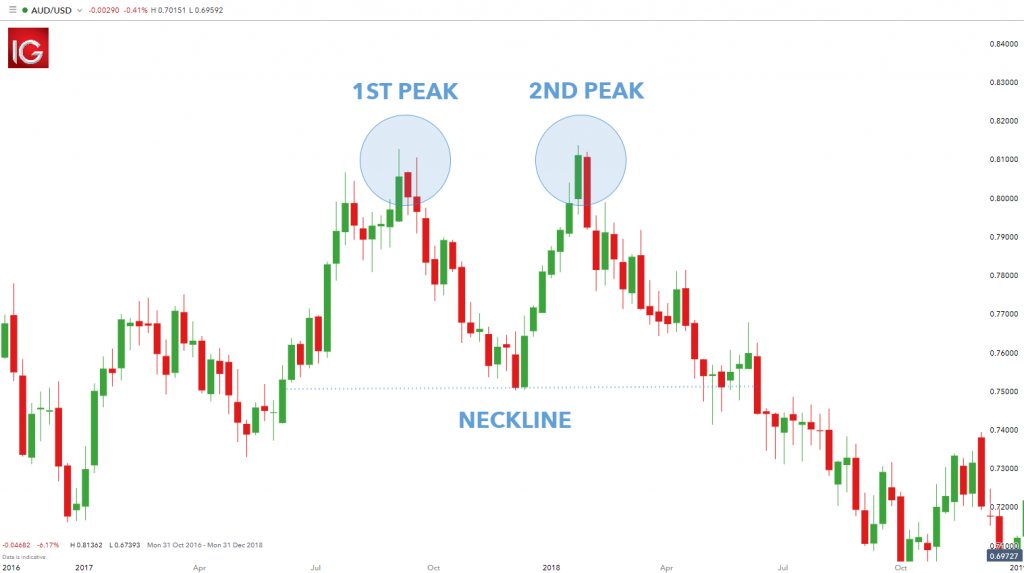
- Double top: The double top pattern is a bearish reversal pattern where the price forms two ‘top’ hills and then experiences a downward price change.
Buying Cryptocurrencies on Pintu
You can start investing in cryptocurrencies by buying them in the Pintu app. You can trade BTC, ETH, and SOL in spot and futures directly on Pintu and Pintu Pro. Here are the key advantages of Pintu Pro:
- Comprehensive trading tools such as charting
- A wide variety of order types
- Real-time order book
- Portfolio tracker to monitor your assets
- Lower trading fees
- Open long or short positions with leverage up to 25x
Pintu allows you to trade both Futures and Spot in one place, making it practical and efficient.
Here’s how to trade Crypto Futures on Pintu Futures web:
- Open https://pintu.co.id/en.
- Click the button Futures in the upper center.
- Click Trade Futures on Desktop.
- Then, click register or login if you already have an account.
- Trade BTC and other cryptocurrencies.
Click the following link to access Pintu Pro via desktop or app.
You can also learn more about crypto through the various Door Academy articles, which are updated every week! All Pintu Academy articles are for educational purposes, not financial advice
References
- Brian Nibley, Crypto Technical Analysis: What It Is & How to Do One, SoFi, accessed on 4 March 2022.
- Technical Analysis 101: The Best Technical Indicators for Crypto and Stocks, CoinMarketCap, accessed on 4 March 2022.
- Ekin Genç, Technical Analysis Explained: Elementary Concepts In Trading Cryptocurrency, Decrypt, accessed on 7 March 2022.
- Crypto charts 101: How to read cryptocurrency charts, Coin Telegraph, accessed on 7 March 2022.
- Cory Mitchell, How to Trade the Cup and Handle Chart Pattern, The Balance, accessed on 8 March 2022.
- James Chen, Double Top Definition, Investopedia, accessed on 8 March 2022.
- Larry Swing, Tales From the Trenches: The Rising Wedge Breakdown, Investopedia, accessed on 8 March 2022.
Share
Next Article

For decades, investors and traders are always looking for various ways to identify assets for profits. From analyzing price charts, company balance sheets, and market macro conditions. Warren Buffet, one of the iconic successful investors, uses fundamental analysis as one of the pillars in determining which assets to chooses. Now, fundamental analysis has become one […]