Market Analysis Feb 27-Mar 5: BTC Moves Sideways, Ukraine Buys Military Equipment with Crypto

Bitcoin (BTC) Price Movement
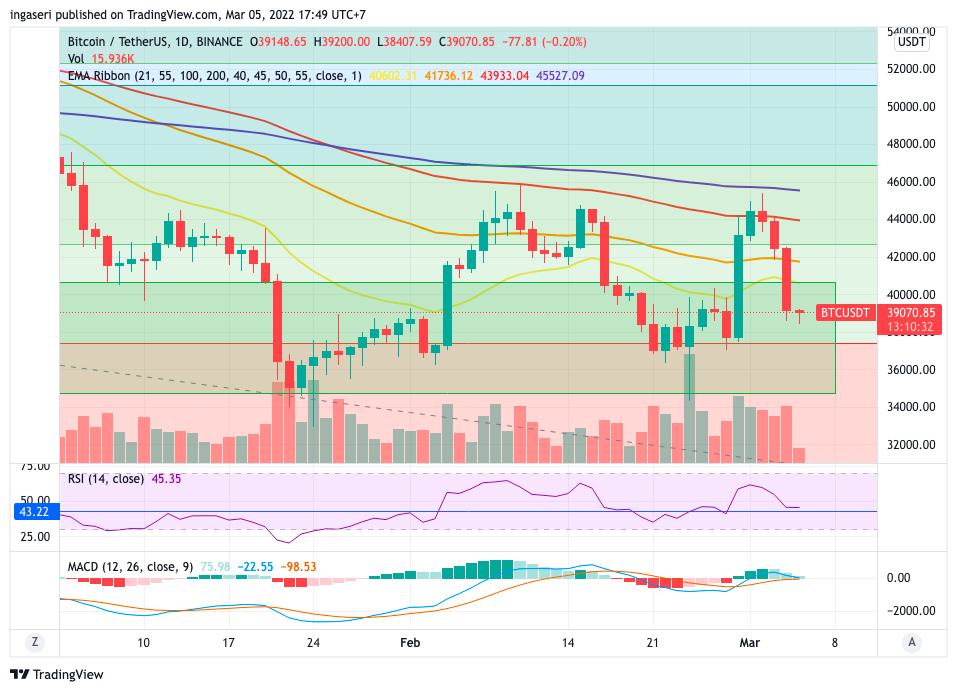
On February 28th, BTC increased significantly, creating the largest bullish candle (15%) in the past year. Looking at the price movement, one can see the positive market reaction, which pushed BTC to the 21-day EMA line, then to the 55-day EMA, and barely broke through the 100-day EMA before being rejected and forming resistance.
After hitting resistance at 44,000 US dollars on Thursday (March 3, 2022), we can see a reversal of the next two candles until BTC is below the 21-day EMA, and the price is back between 34,000-40,000 USD.
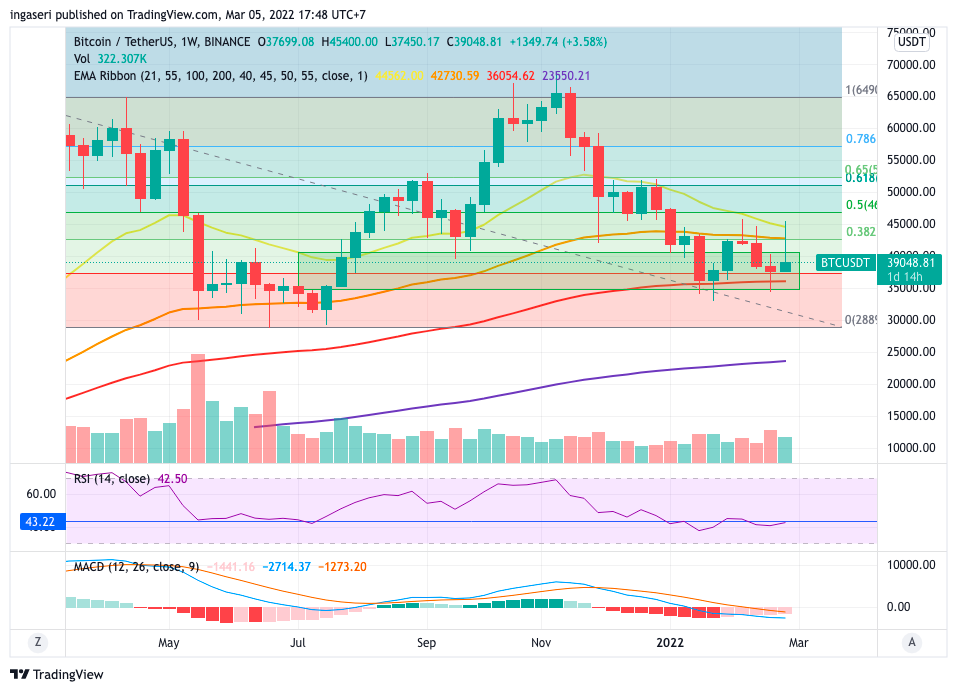
On the weekly chart, BTC broke through the 55 and 21 weeks EMAs, before finally settling in the area of the 55 and 100 weeks EMAs. It also represents a sideways market state, with most market participants not ready to sustain longer and sustainable accumulations in the short term.
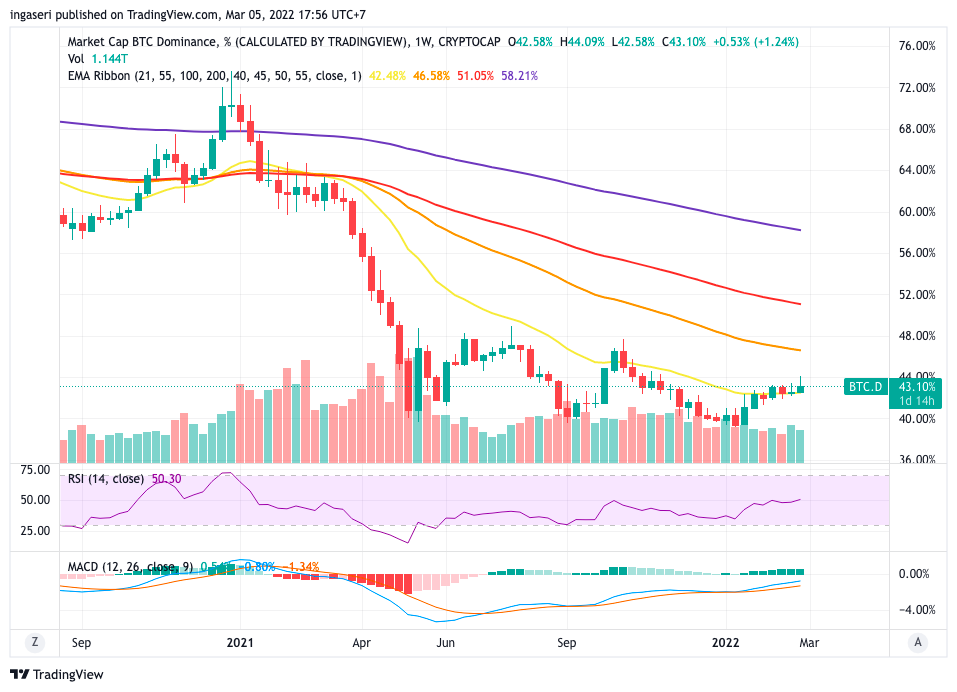
Looking at bitcoin’s dominance in the chart below, it can be seen that BTC has finally broken through resistance and held support at the 21-week EMA for 3 weeks in a row. It is seen that the beta for altcoins is higher (compared to BTC). This means that holding BTC will be a safer choice than altcoins when the market is moving sideways.
block💡 What is beta? Beta is a measure of the volatility of the portfolio compared to the market as a whole. A beta close to 1 indicates that the volatility of the crypto asset is at an average level, and its movements are mostly in line with the market. A beta greater than 1 indicates that the asset’s volatility is above average.
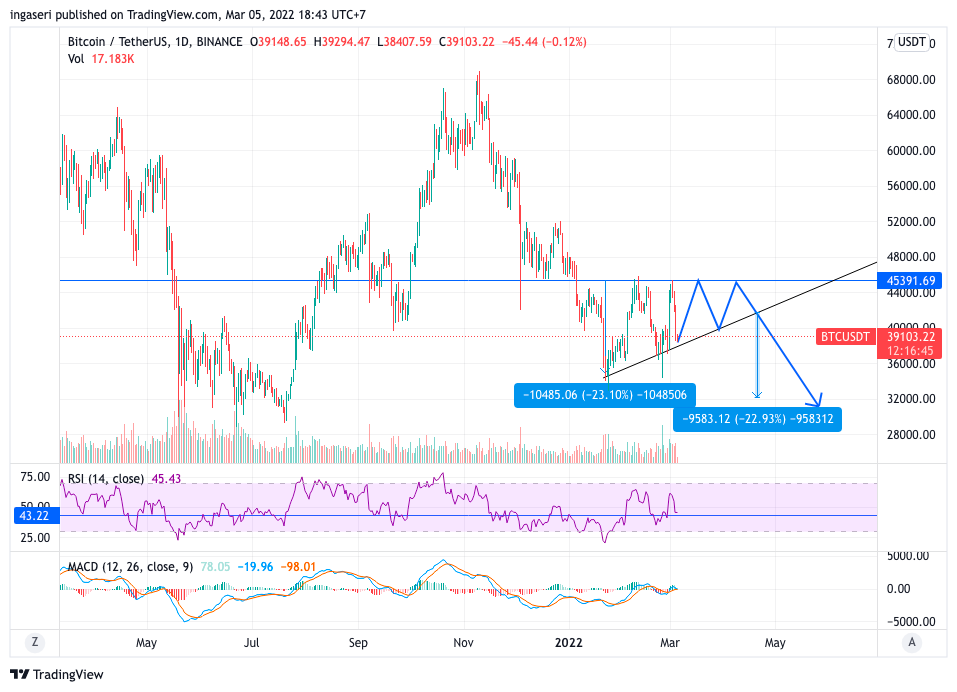
One of the most talked-about mid-term price action TA analysis for bitcoin currently is the descending triangle continuation pattern on the daily chart. Notice that in the chart below, the descending triangle pattern has been found and if validated, it could be a continuation of the already downward pattern or in the event of a failure, expect a powerful reversal pattern.
Read also: How to Diversify Crypto Portfolio: Risk Management Amid Market Volatility
What else is there to observe from BTC in the past week?
- Increased leverage ratio: Although we have seen the price drop below the 40k, we still have yet to see a further decrease of leverage ratio. In fact, the 28 February rise has made the leverage ratio rise significantly. The current situation can be described as follows: though the market sentiment is weak and moving sideways, the ever high leverage ratio indicates that there is still market hopes-expectation for a bullish turnaround.
- 📉 Bitcoin mining difficulty dropped for the first time this year: Bitcoin mining difficulty drops for the first time this year. Note that the higher the difficulty of network mining, the more secure the network is. Also, the difficulty of mining new units depends on the number of miners in the network. Looking at the chart below, throughout the beginning of the year, even when price drops, we have never seen a decline in mining difficulty, until the present situation.
Market analysis conclusion
- 💥 With the Russia-Ukraine war still ongoing and a rate hike by the Fed (United States Central Bank) next month, more volatility is expected in the crypto market, at least in the short term.
- 🚨 The Fed is likely to propose and support a 25 basis point rate hike at the US Federal Reserve’s policy meeting this month. More downside risks are expected for the crypto market following the decision.
Other important news from the crypto world in the last week
- 💵 Ukraine Purchases Military Equipment Using Cryptocurrency: More than 50 million US dollars in cryptocurrencies have been raised since Russia’s invasion of Ukraine on 24 February 2022. According to Bloomberg, a total of 15 million US dollars has been used to purchase military equipment as of March 5, 2022.
- 🔗 Ukraine Cancels Airdrop: The Ukrainian government has canceled the crypto airdrop plan which was previously announced on the government’s official Twitter account. Earlier announcements of the airdrop plan indicated that the purpose of the airdrop was to reward donors who had sent crypto to support Ukraine.
- 👨💻 Andre Cronje Leaves Crypto Industry: YFI founder and Fantom Foundation chairperson, Andre Cronje, has decided to leave the crypto industry. The news was conveyed by his colleague Anton Nell, senior solutions architect at Fantom Foundation, who also took the same decision. Cronje-linked crypto assets, such as FTM and YFI, fell sharply after the announcement. Yearn.finance (YFI) plunged 13% from nearly $20,000 to $17,000. Meanwhile, Fantom (FTM) was down 15% and trading at $1.42 as of March 6, 2022.
Reference
- Sandali Handagama, Ukraine Government Cancels Airdrop Ahead of Scheduled Snapshot, Coindesk, accessed on 6 Maret 2022.
- The Street Staff, What Is Beta? Definition, Calculation & Example, The Street, accessed on 7 Maret 2022
- Olga Kharief, Ukraine Crypto Donations Go to Military Gear; $15 Million Spent So Far, Bloomberg, accessed on 7 Maret 2022
- Ekin Genc, YFI, FTM Tank After Andre Cronje, Anton Nell Claim They’re Leaving Crypto, Decrypt, accessed on 7 Maret 2022.
Share