Market Analysis April 24, 2023: Crypto Market Sees Correction After Weeks of Strong Price Momentum

On the day of Eid, the crypto market experienced correction after continuous growth for three weeks prior. The decline in the crypto market was influenced by issues such as a 0.25-point increase in interest rates, regulations, and an increase in initial jobless claims data. However, many analysts and investors remain optimistic about the long-term potential of crypto. Read the full market analysis review below.
The trader team at Pintu has gathered a lot of important information and analyzed the overall economic situation and the movement of the crypto market over the past week. However, it should be noted that all information in this Market Analysis is intended for educational purposes only, and not as financial advice.
Market Analysis Summary
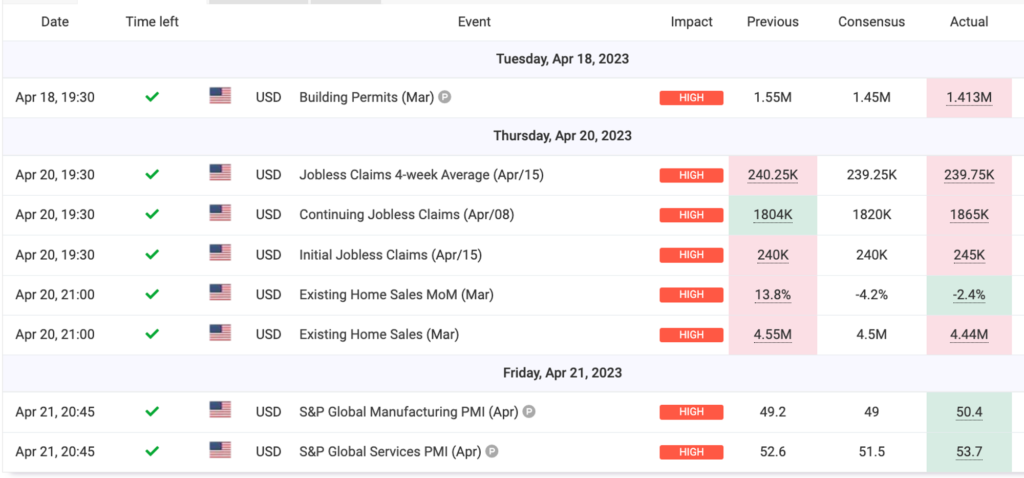
- 📈 The number of jobless claims in the United States (US) increased to 245,000, and the increase in continuing claims exceeded expectations, indicating a decrease in inflation in the labor market. Unemployment claims data resulted in DYX weakening.
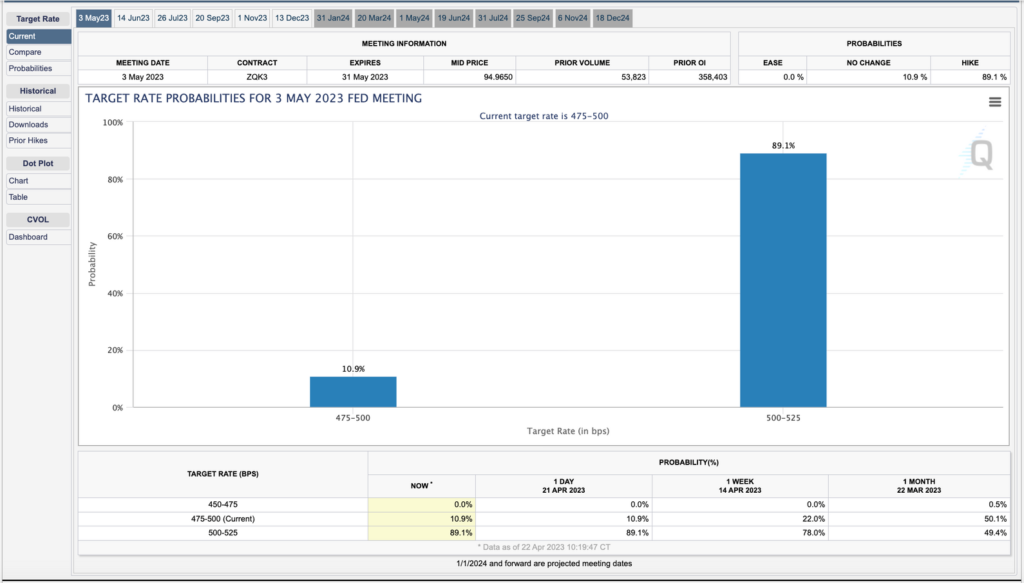
- 🚨 The Fed is predicted to increase interest rates by 0.25 percentage points at the May meeting.
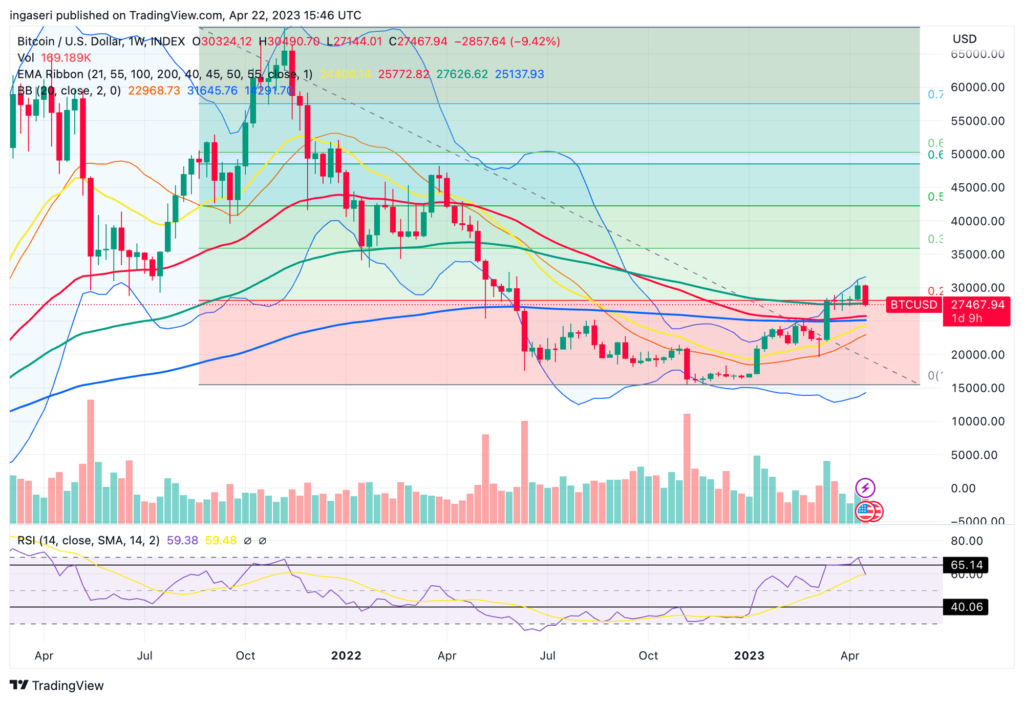
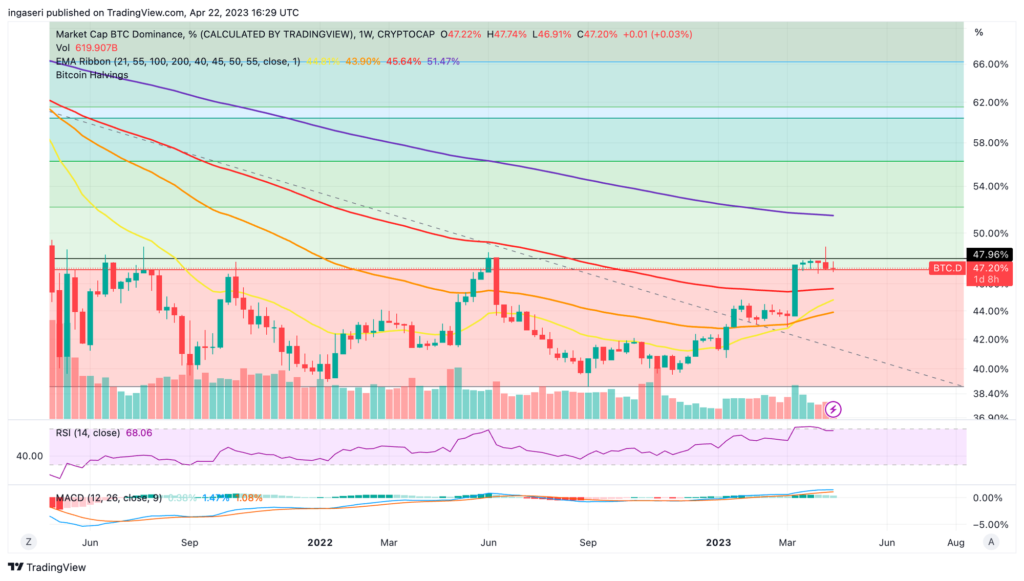
- ⚠️ BTC experienced correction after weeks of strengthening. The price of BTC is still supported by the 100-week EMA, with a historical market dominance of 48%, which means it is at its highest range.
- 🔎 BTC Dominance is historically at its highest range, at 48%. This suggests that the crypto market is heading towards ETH season and Altcoin season.
Macroeconomic Analysis
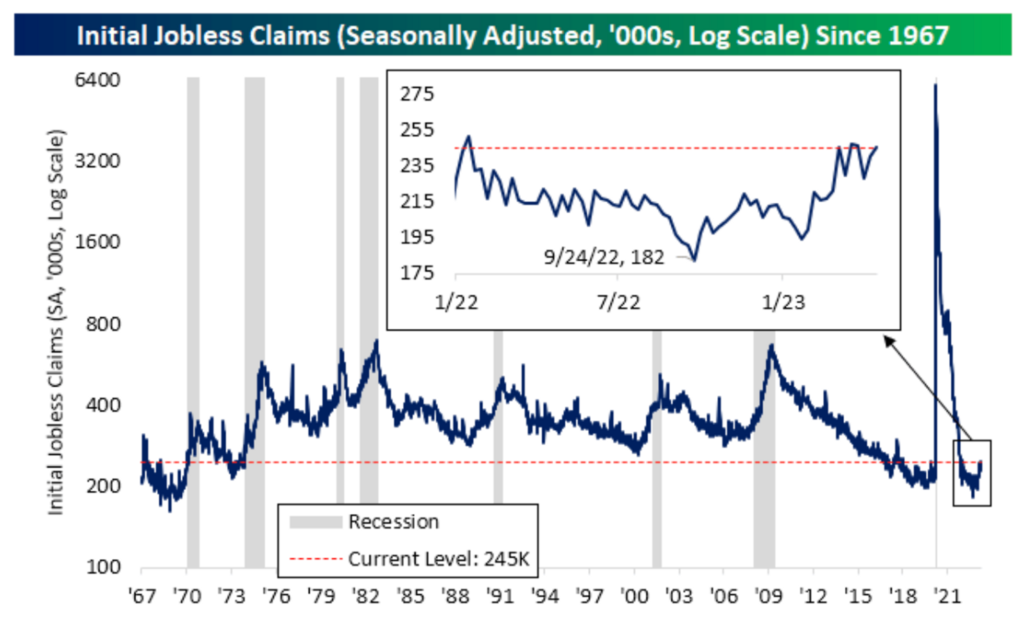
Initial claims for state unemployment benefits rose 5,000 (2.1%) to 245,000 in new claims for the week ending April 15, which is around 12.9% higher than the same period last year. When looking at the 13-week moving average, which is a preferred measure that accounts for weekly fluctuations, there was a slight increase to 227,000, marking the fourth consecutive week above the pre-pandemic average and continuing the upward trajectory since November.
There has been a steady increase in new applications for unemployment benefits over the past three weeks, reaching levels not seen in almost 18 months. This trend suggests that the labor market, which has been a crucial factor in preventing a recession, may be slowing down.
This week’s continuing claims rose to 1.865 million, which was 40K more than anticipated. While initial claims did not hit a new peak despite the rise, the continuing claims increased by 61K, putting the metric at its highest level since late November 2021.
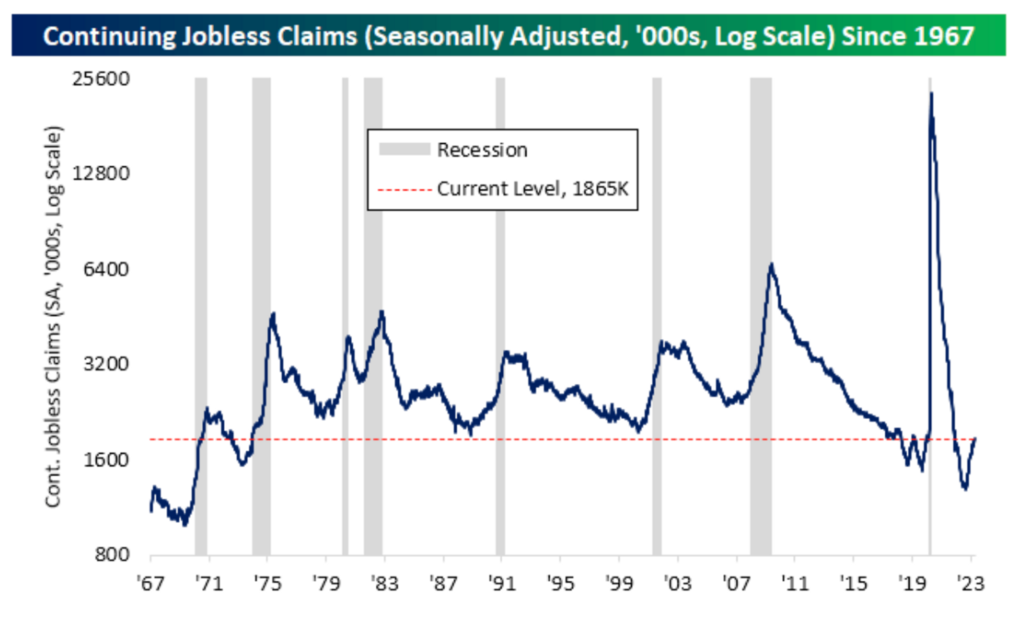
The increase in weekly number of jobless claims indicated a reduction in inflationary pressures within the labor market. While inflation is decreasing and the economy is showing signs of slowing down, these developments are in their early stages and the Fed is still prepared to increase interest rates.
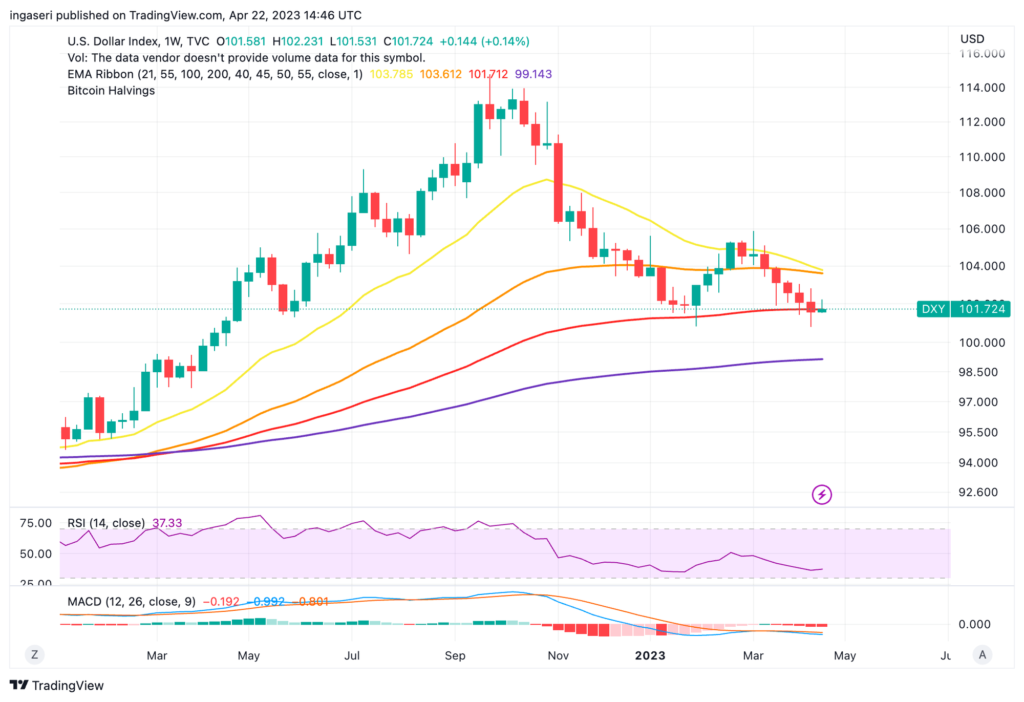
DXY pulled back modestly after the Jobless Claims, it turned negative below 102.00. The weekly candle goes below the 55 weeks EMA, the first time since September 2021. Expect further weakening of the dollar index as we are nearing the peak terminal rate.
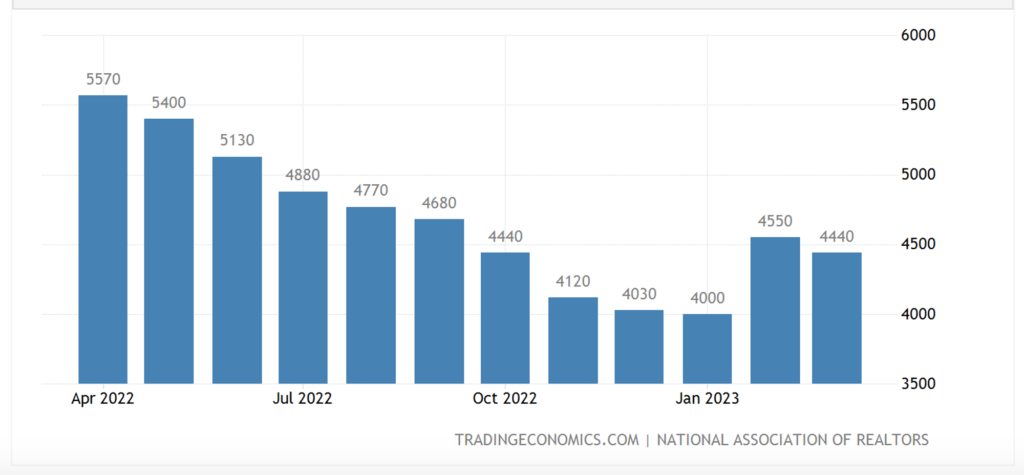
In March, the National Association of Realtors reported a 2.4% decline in existing home sales compared to the previous month, resulting in an annualized rate of 4.44 million. This reversal of February’s gains was attributed to reduced activity during the selling season in comparison to the previous year. Economists had predicted a higher rate of 4.5 million, according to Bloomberg data. Additionally, the median sales price of an existing home decreased by 0.9% from $379,300 to $375,700, as per NAR data.
As consumer price inflation stabilizes and rental growth slows due to increased apartment construction, the Federal Reserve’s monetary policy is likely to move from tightening to neutral and may even shift towards loosening in the next year. Consequently, despite some fluctuations in the coming months, home sales are expected to gradually recover.
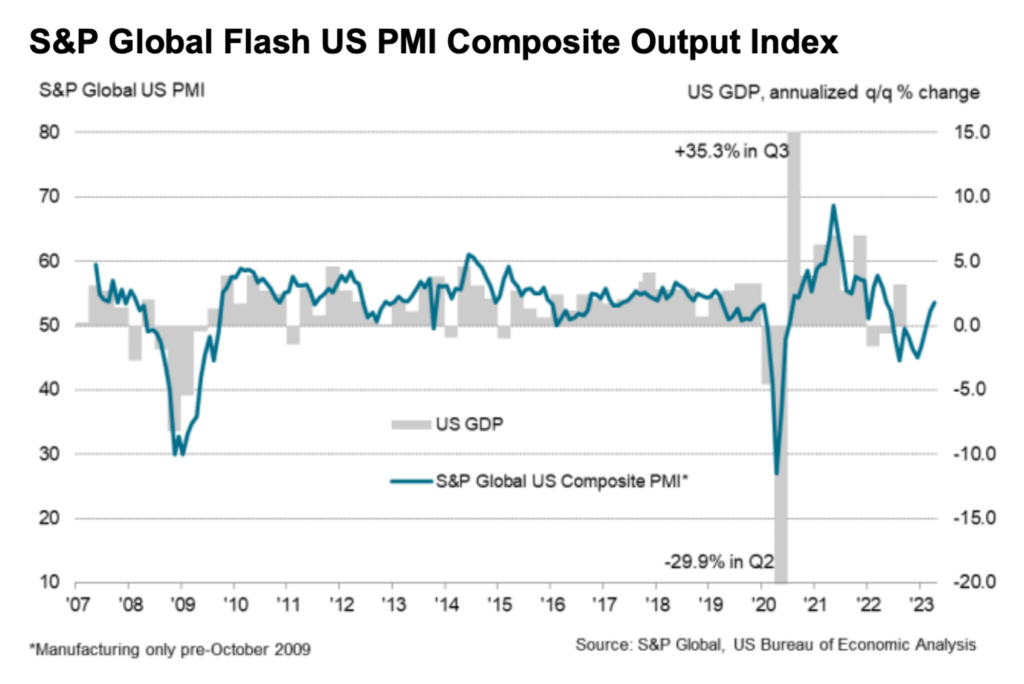
In April, the private sector in the US experienced a robust expansion in business activity as shown by the S&P Global Composite PMI, which increased to 53.5 from 52.3 in March, exceeding the market expectation of 52.8. Both the S&P Global Manufacturing PMI and Services PMI also improved, reaching 50.4 and 53.7, respectively, surpassing the analysts’ forecast of 51.5. The latest survey indicates that business activity has regained its growth momentum after contracting for seven months until January. Furthermore, the employment situation in the private sector has also improved as job growth has accelerated, aided by reports of vacancies being more easily filled, reflecting an improvement in the supply of candidates and higher wages.
Flash US PMI Composite Output Index at 53.5 (March: 52.3). 11-month high. Flash US Services Business Activity Index at 53.7 (March: 52.6). 12-month high. Flash US Manufacturing Output Index at 52.8 (March: 50.2). 11-month high. Flash US Manufacturing PMI at 50.4 (March: 49.2). 6-month high.
Economic event summary:
The probability of Fed raising by 0.25 percentage point at the Fed’s May meeting has increased to 89% (from 68% a week ago), as per the CME Group. With the economic slowdown, consumer prices are expected to decrease, which should bring inflation closer to the Fed’s desired long-term target of 2%. The market is expecting next Fed meeting may be the final meeting where the Committee raises the fed funds target rate.
Although there has been some deviation this week, the markets have generally been dominated by narratives of recession in recent times: stock prices decreasing, rising bond prices, and high demand for gold.
Bank of America reported that global fund managers’ allocation of stocks to bonds has dropped to its lowest level since 2009, indicating that investors are favoring bonds over stocks. While this supports the notion of a recession, it could be beneficial for high-risk assets. As stocks have already experienced significant sell-offs over the past 18 months and the Fed’s potential pause in interest rate hikes, there could be a renewed interest in taking risks.
Crypto Analysis
BTC corrected itself after weeks of strong price momentum and what looked to be an overbought situation. As BTC approached the $30,000 resistance level, the RSI indicator entered the technical overbought zone. The current chart pattern bears similarities to that of August 2020, which led to a retracement from $12,000 to $9,500 before the start of the subsequent bull run in October 2020.
Notice that BTC price is being supported by 100 weeks EMA for the previous 4 weeks. We need to stay above the support line (27,500) as we close for the week if we want to continue preserving the level of momentum similar to that of last 4 weeks.
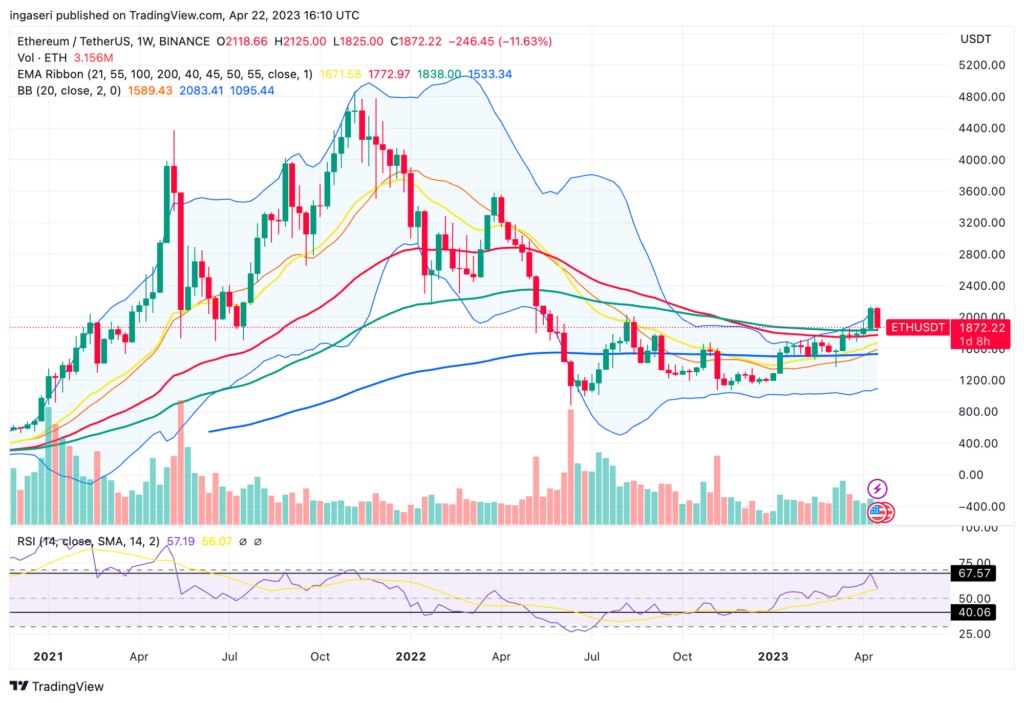
Same goes for ETH, while ETH reached $2000 psychological mark, it could not stay there for long as ETH plunges to the 1,800 price point. The RSI indicator signaled a potential pullback or reversal with a distinct overbought signal. Notice the support at 100 weeks EMA.
BTC Dominance has been at its historically highest range at 48%. With this, we can conclude that we are going for ETH-season and Alt-season.
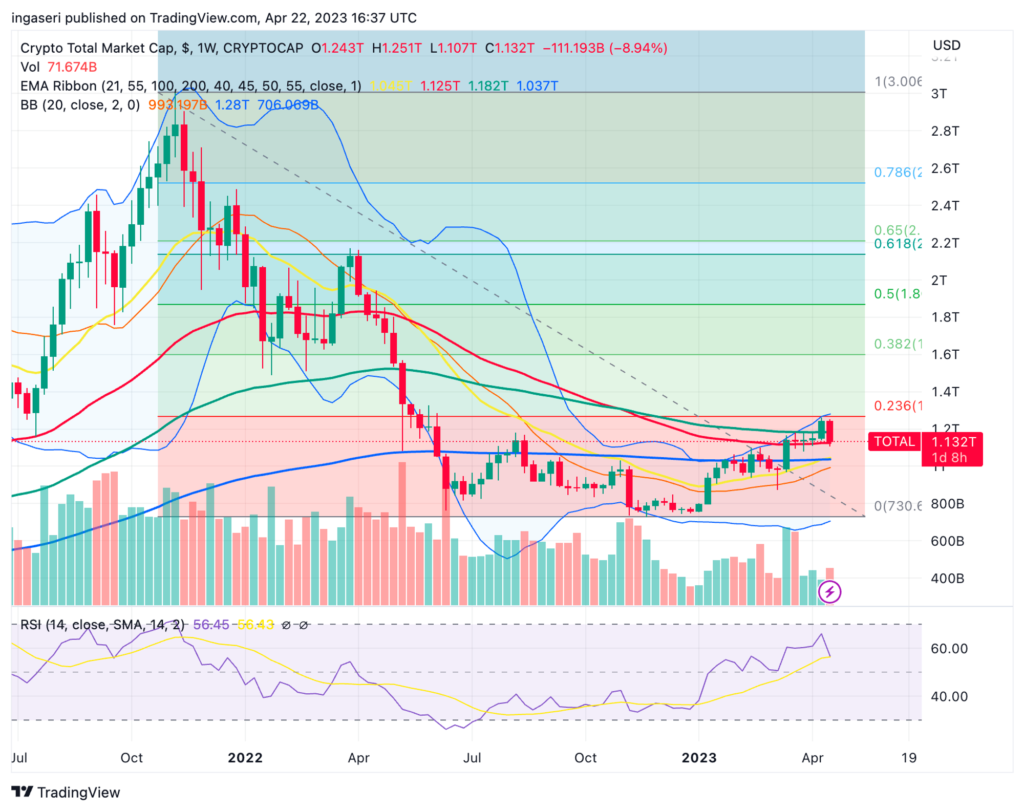
Total crypto market hit resistance at 0.236 Fibonacci retracement line. We are currently supported at 55 weeks EMA line.
On-Chain Analysis
- 📊 Exchange: As the exchange reserve continues to rise, it indicates higher selling pressure. Net deposits on exchanges are low compared to the 7-day average. Lower deposits can be interpreted as lower selling pressure.
- 💻 Miners: Miners’ are selling more holdings compared to its one-year average. Miner’s revenue is in a moderate range, compared to its one-year average.
- 🔗 On-chain: More investors are selling at a profit. In the middle of a bull market, it can indicate a market top. Long term holders’ movement in the last 7days were lower than the average. They have a motive to hold their coins. Investors are in an anxiety phase where they are currently in a state of moderate unrealized profits.
- 🏦Derivatives: Long position traders are dominant and are willing to pay to short traders. Buying sentiment is dominant in the derivatives market. More buy orders are filled by takers. As open interest decreases, it indicates investors are closing futures positions and possibility of trend reversals. In turn, this might trigger the possibility of long/short-squeeze caused by sudden price movement or vice versa.
- 🔀 Technicals: RSI indicates a neutral condition. Stochastic indicates a neutral condition where the current price is in a moderate location between the highest-lowest range of the last 2 weeks.
Other News from the Crypto World in the Past Week
- Pepecoin Sets Record, Market Capitalization Reaches $165 Million in 4 Days. Launched on April 17, 2023, this meme token managed to achieve a market capitalization of $33 million or an increase of up to 21,000% in just a few days. The Pepe meme was first created by cartoonist Matt Fuie and has a surprising political history, where it is also associated with Donald Trump’s 2016 campaign.
- Get Ready! Ethereum Conference EDCON 2023 to be Held in Podgorica, Montenegro in May. Vitalik and eight other EF members have confirmed their attendance at the Ethereum Conference EDCON 2023 to be held in Podgorica, Montenegro in May. This is the first time Vitalik Buterin has been seen in public since February 12 in Denver.
Crypto Asset Performance in the Past Week
Cryptocurrencies with the Best Performance
- Tron +0,34%
- Tether +0,07%
- USD Coin +0,05%
Cryptocurrencies with the Worst Performance
- Injective -28,31%
- WOO Network -22,80%
- Rocket Pool (RPL) -22,68%
- Frax Share (FXS) -20,90%
References
- ZachXBT, Solana DeFi project Serum with 200,000 followers has been renamed Luka, Twitter, accessed on April 24, 2023.
- Justinstables, Arbitrum ARB Token Airdrop Acceptance, Research Lido, accessed on April 24, 2023.
- Edmond Hererra, Pepecoin’s Market Cap Soars To Over $165M In Just Four Days, blockzeit, accessed on April 24, 2023.
- Edcoin.io, Ethereum Conference EDCON 2023, accessed on April 24, 2023.
Share
Related Article


See Assets in This Article
USDT Price (24 Hours)
Market Capitalization
-
Global Volume (24 Hours)
-
Circulating Supply
-