Market Analysis Aug 26th, 2024: BTC Struggles to Break 50-Day MA Resistance

Bitcoin was finally able to break its important level of $61K by rising to $64K. However, to close the month of August positively, BTC still faces two important technical levels. Check out the full analysis below.
As usual, the Pintu trading team has gathered critical information and analyzed the general economic situation and the crypto market’s movements over the past week. However, it should be noted that all information in this Market Analysis is intended for educational purposes, not as financial advice.
Market Analysis Summary
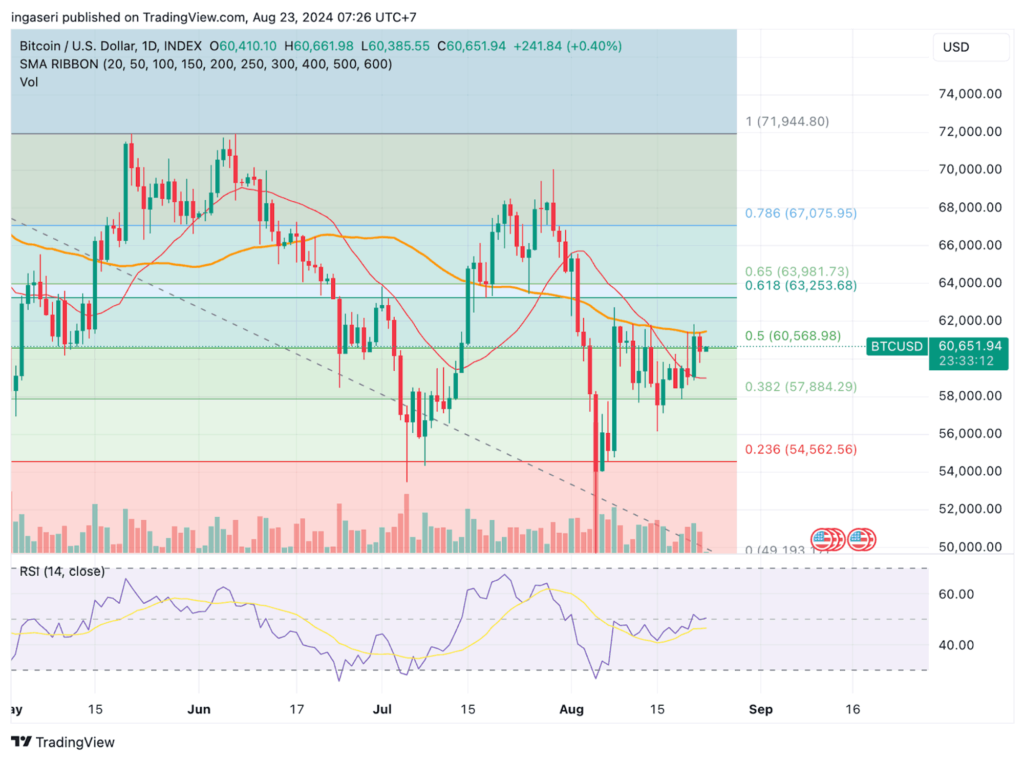
- 📝 BTC is currently facing significant resistance at the 50-day moving average around 61,500, as well as the 0.5 Fibonacci retracement level at 60,500.
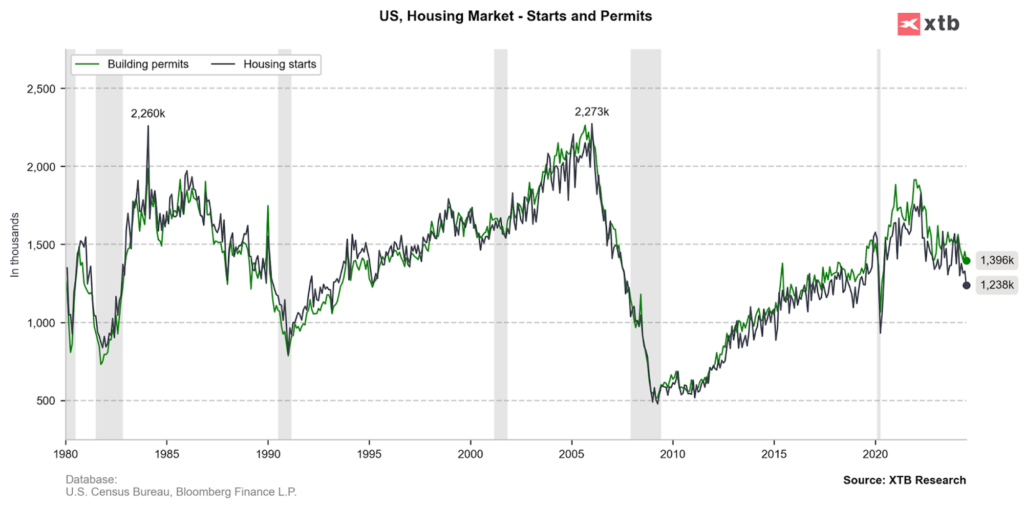
- 🏠 Building permits dropped to a seasonally adjusted annual rate of 1.396 million in July.
- 📈 New claims for unemployment benefits slightly exceeded expectations, rising to 232,000 for the week ending August 17.
Macroeconomic Analysis
Housing Permits
U.S. housing market data for July was released. The data was anticipated to show slight month-over-month declines in building permits and housing starts, following solid increases in June. According to the latest report from the Census Bureau, building permits dropped to a seasonally adjusted annual rate of 1.396 million in July, the lowest level since June 2020. This figure falls short of the projected rate of 1.430 million. The data reflects a 4.0% decrease from June and a 7.0% decline compared to the same period last year.
Other Economic Indicators
- Michigan Consumer Sentiment: The University of Michigan’s latest consumer sentiment survey, released on Friday, indicated a slight increase in sentiment for August. The index rose to 67.8, up from 66.4 in July, surpassing economists’ expectations of 66.9. This marks the highest level of consumer sentiment since June.
- Jobless Claim: According to the U.S. Labor Department, new claims for unemployment benefits, which serve as a proxy for job cuts, slightly exceeded expectations, rising to 232,000 for the week ending August 17 on a seasonally adjusted basis. This was slightly higher than economists’ forecast of 230,000 claims and the previous week’s upwardly revised figure of 228,000 claims. Despite the increase, unemployment claims remain at historically low levels, indicating that the labor market continues to show strength.
- S&P Global PMI: The U.S. S&P Global Composite PMI slightly decreased to 54.1 in August’s flash estimate, down from 54.3 in July, indicating that business activity in the U.S. private sector continued to grow at a solid pace. This result exceeded market expectations of 53.5. The strong growth observed in August suggests robust GDP growth exceeding 2% annualized in the third quarter, which should help ease near-term recession concerns.
BTC Price Analysis
All attention is on BTC after it regained the $61,000 level, following the release of the FOMC minutes. This recent price movement has renewed BTC’s interest, particularly in light of Bitcoin’s correlation with global liquidity.
This correlation also highlights the importance of the U.S. dollar index (DXY), as fluctuations in the DXY can influence BTC. Generally, when the dollar weakens, Bitcoin tends to strengthen, as investors turn to alternative assets.
As illustrated in the chart below, BTC is currently facing significant resistance at the 50-day moving average around 61,500, as well as the 0.5 Fibonacci retracement level at 60,500. These two levels are crucial technical indicators that traders are closely monitoring.
The 50-day moving average is a widely observed trend indicator, often considered a critical threshold in determining the overall direction of an asset. A sustained break above this level could signal a shift from bearish to bullish momentum, potentially attracting more buyers into the market and triggering a stronger upward move.
Similarly, the 0.5 Fibonacci retracement line at 60,500 is another key resistance point. The Fibonacci retracement tool is used by traders to identify potential reversal levels within a trend. The 0.5 level is particularly significant because it represents a 50% pullback from the previous high, suggesting that breaking this level could indicate the start of a new bullish phase.
However, until BTC successfully breaks above both of these resistance levels, the market remains at risk of continuing the current downtrend. A failure to clear these hurdles could lead to further consolidation or even a potential retest of lower support levels.
Additionally, breaking above these resistances would not only signal a technical breakout but could also reinforce positive market sentiment, encouraging more investors to enter the market. This could lead to increased trading volumes, further solidifying the upward trajectory and potentially setting the stage for BTC to challenge even higher levels.
Moreover, a successful breakout would likely invalidate the current downtrend line that Bitcoin has been battling, establishing a new bullish trendline and creating a more favorable environment for upward price movement. In this context, traders and investors should also keep an eye on other macroeconomic factors, such as changes in global liquidity, central bank policies, and broader market sentiment, all of which could influence BTC’s ability to break through these critical levels.
On-Chain Analysis
- 📊 Exchange: As the exchange reserve continues to rise, it indicates higher selling pressure. Net deposits on exchanges are low compared to the 7-day average. Lower deposits can be interpreted as lower selling pressure.
- 💻 Miners: Miners’ are selling holdings in a moderate range compared to its one-year average. Miner’s revenue is in a moderate range, compared to its one-year average.
- 🔗 On-Chain: More investors are selling at a profit. In the middle of a bull market, it can indicate a market top. Long term holders’ movement in the last 7 days was lower than the average. They have a motive to hold their coins. Investors are in an anxiety phase where they are currently in a state of moderate unrealized profits.
- 🏦 Derivatives: Long-position traders are dominant and are willing to pay to short traders. Selling sentiment is dominant in the derivatives market. More sell orders are filled by takers. As OI increases, it indicates more liquidity, volatility, and attention are coming into the derivative market. The increasing trend in open interest could support the current ongoing price trend.
- 🔀 Technicals: Stochastic indicates a oversold condition where the current price is close to the bottom of the last 2 weeks and a trend reversal can occur.
News About Altcoins
- Telegram CEO Arrested; Toncoin Price Plummets. Pavel Durov, the founder and CEO of Telegram, was reportedly detained by French authorities upon his arrival from Azerbaijan. The arrest, allegedly linked to allegations of legal violations by Telegram users that the platform failed to moderate, has sent shockwaves through the crypto community. As a direct consequence, the price of Toncoin , a token associated with The Open Network, has experienced a sharp decline. Within the past 24 hours, TON’s value has plummeted by nearly 17%, from $6.80 to $5.61. The unexpected arrest of Durov, who is typically cautious about traveling to countries where Telegram faces scrutiny, has intensified concerns about the platform’s future.
News from the Crypto World in the Past Week
- Grayscale Launches Avalanche Trust, Enabling AVAX Investments. Grayscale Investments, a prominent cryptocurrency asset manager and ETF provider, has announced the launch of the Grayscale Avalanche Trust. This new investment vehicle grants investors direct exposure to AVAX tokens, the native cryptocurrency used to secure and facilitate transactions on the Avalanche blockchain. The timing of this launch aligns with the surge in demand for publicly traded crypto products, notably sparked by the Securities and Exchange Commission’s approval of Bitcoin ETFs. Under the leadership of its new CEO, Peter Mintzberg, Grayscale has expanded its offerings to include over 20 crypto investment products. This diverse range encompasses both single-asset funds and those focused on emerging technologies like artificial intelligence.
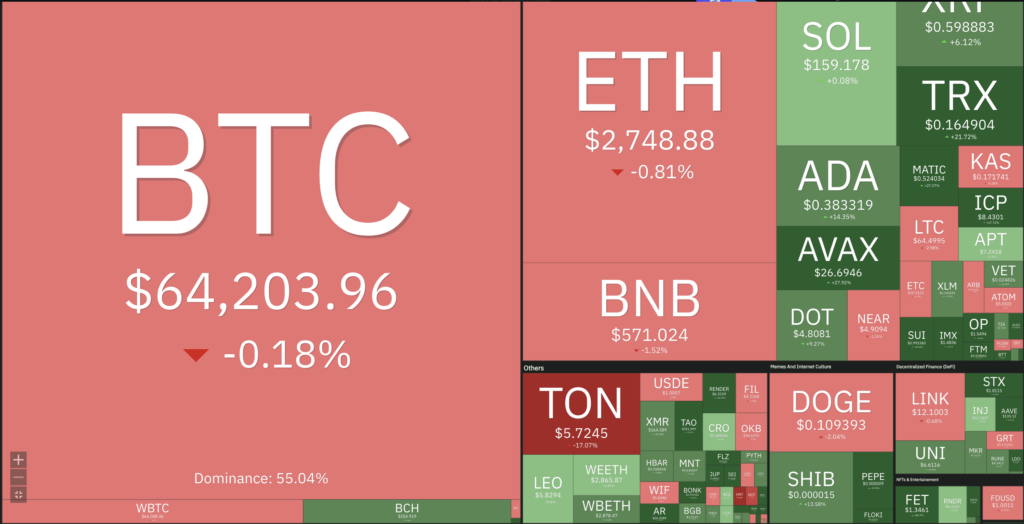
Cryptocurrencies Market Price Over the Past Week
Cryptocurrencies With the Best Performance
- Popcat (POPCAT) +80,97%
- Artificial Superintelligence Alliance +53,31%
- SATS (1000SATS) +39,32%
- Render (RNDR) +38,30%
Cryptocurrencies With the Worst Performance
- Helium -13,23%
- Notcoin (NOT) -10,16%
- Toncoin (TON) -9,90%
- Litecoin 2,27%
References
- Ian Allison, Crypto Asset Manager Grayscale Offers AVAX Token Investment in New Avalanche Trust, Coindesk, accessed on 25 August 2024.
- Andrew Hayward, TON Price Plunges 17% After Telegram CEO Pavel Durov Arrested in France: Report, Decrypt, accessed on 25 August 2024.
Share
Related Article


See Assets in This Article
BTC Price (24 Hours)
Market Capitalization
-
Global Volume (24 Hours)
-
Circulating Supply
-