Market Analysis Aug 28th 2023: Bitcoin Breaks Key Support Level, New Support at $25,700

Bitcoin broke through its 200-day moving average (MA) last week, a key support level. The price of BTC then continued to fall after breaching this support level. Read the following analysis for more details.
The Pintu trading team has gathered critical information and analyzed the general economic situation and the crypto market’s movements over the past week. However, it should be noted that all information in this Market Analysis is intended for educational purposes, not as financial advice.
Market Analysis Summary
- 📉 Home sales in the U.S. fell by 2.2% in July, reaching their lowest point since January.
- ⬇️ Business activity in the United States slowed down in August, with the Composite PMI index dropping to 50.4, while the Manufacturing PMI indicated contraction for the fourth consecutive month.
- ⏬ Unemployment benefit claims dropped to 230,000, lower than expected. Meanwhile, the Michigan Consumer Sentiment Index also fell, reaching 69.5 in August, lower than forecasts.
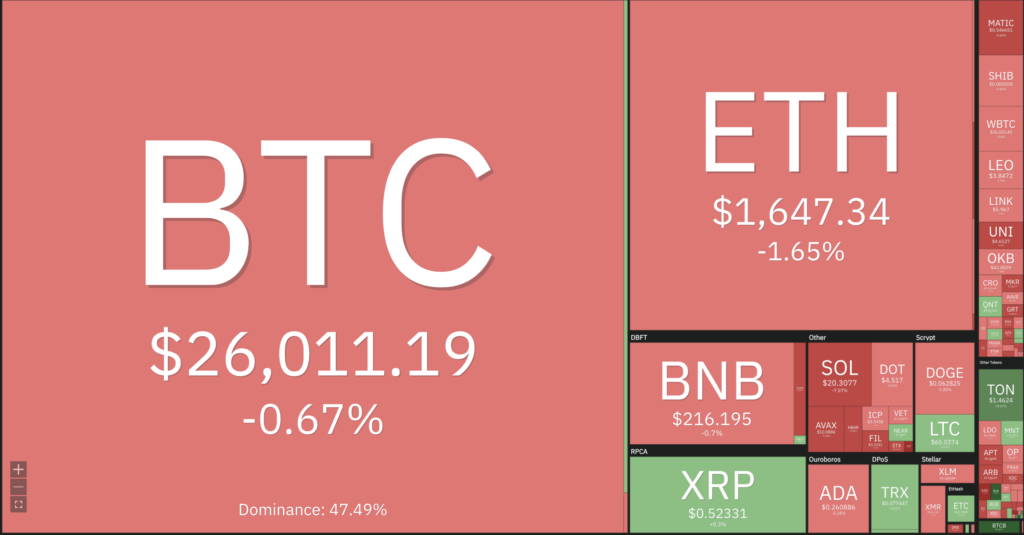
- ✍🏻 BTC and ETH showed declines after breaking through their 200-day moving averages, with BTC having support at the 250-day MA at $25,700 and ETH at the price level of $1,600.
Macroeconomic Analysis
The first data point to be discussed in this week’s market analysis is the 2.2% decline in home sales in July as reported by the National Association of Realtors. This decline reached a seasonally adjusted annual rate of 4.07 million units and marked the lowest level since January.
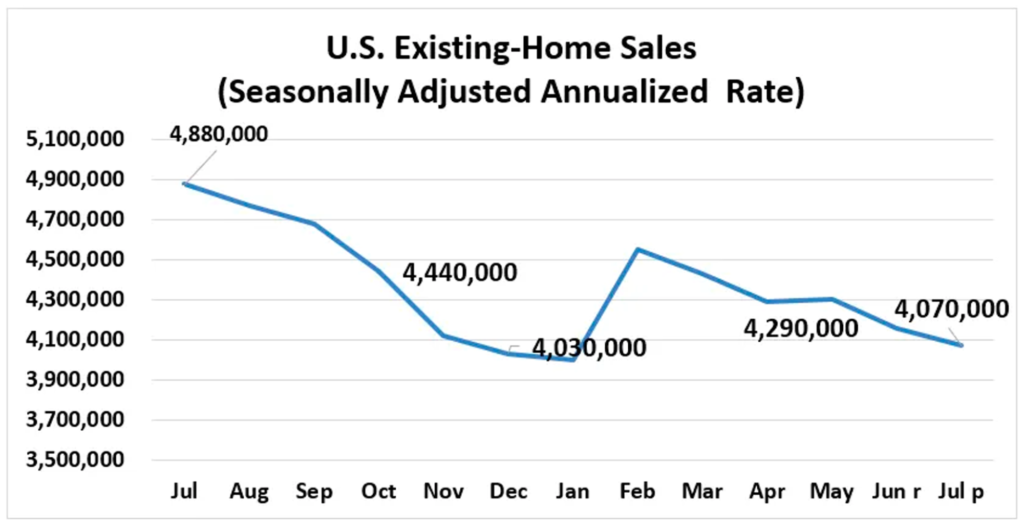
Overall, home sales in the U.S. regions were down 16.6% year-over-year in July. Although U.S. home prices have bottomed out as a result of the Federal Reserve’s interest rate hikes, the Fed has not been able to stimulate home sales. This is due to two factors:
- The lack of available properties for sale is hampering the recovery process.
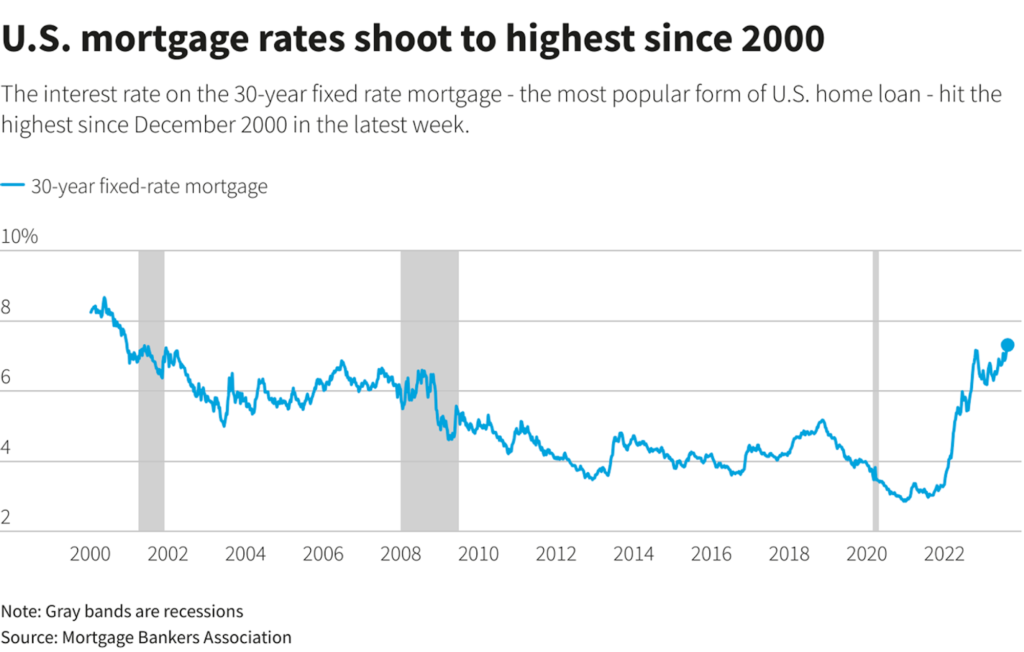
- Mortgage rates have risen to their highest levels.
According to mortgage finance leader Freddie Mac, the average interest rate on popular 30-year fixed-rate mortgages exceeded 7% last week.
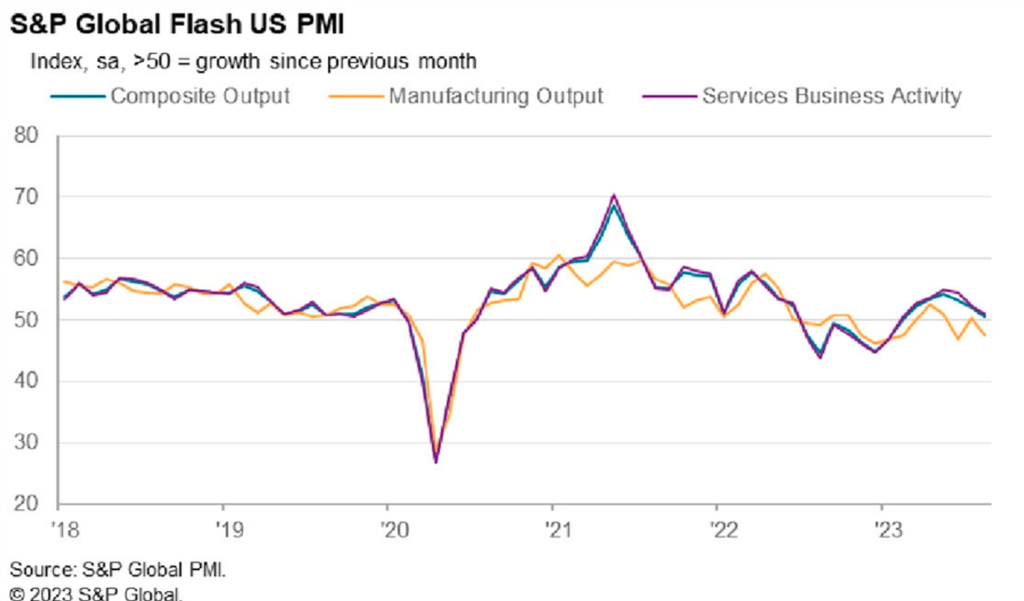
U.S. economic activity continued to decline in August, driven by weaker demand for new business in the service sector.
According to S&P Global, the U.S. composite PMI for both the manufacturing and services sectors fell to 50.4 in August from 52 in July. The decline was the largest since November 2022. Although the August reading indicates growth for the seventh consecutive month, the number barely crosses the critical 50 threshold that separates expansion from contraction. Weaker demand could have implications for demand for manufactured goods and services.
In the services sector, the labor market appeared to be strengthening in recent months, and steady consumer spending eased concerns about a potential recession. This positive trend even led to upward revisions in GDP growth forecasts. However, data released last Wednesday showed that growth in service sector activity is slowing, with the PMI falling to 51.0 from 52.3 in February.
In addition, the manufacturing PMI fell further into contraction territory, dropping from 49.0 in July to 47.0 in August. This decline marks the fourth consecutive month of contraction in the manufacturing sector.
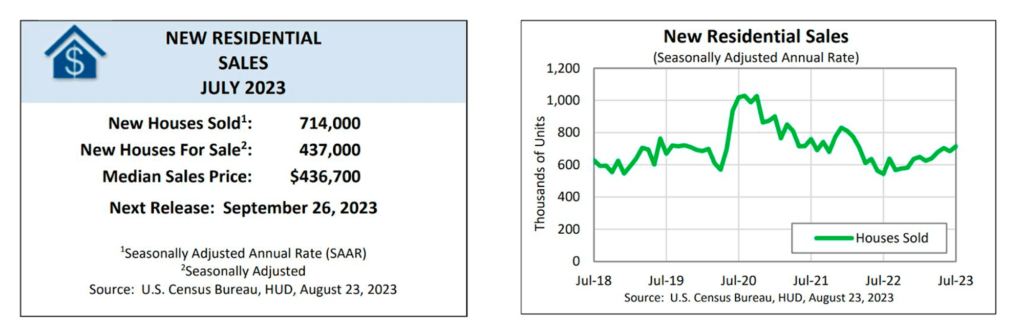
In contrast to the decline in business activity, the U.S. Commerce Department reported that sales of new single-family homes rose 4.4% in July to a seasonally adjusted annual rate of 714,000 units for the previous month. June’s sales pace was revised from the initial report of 697,000 units to 684,000 units.
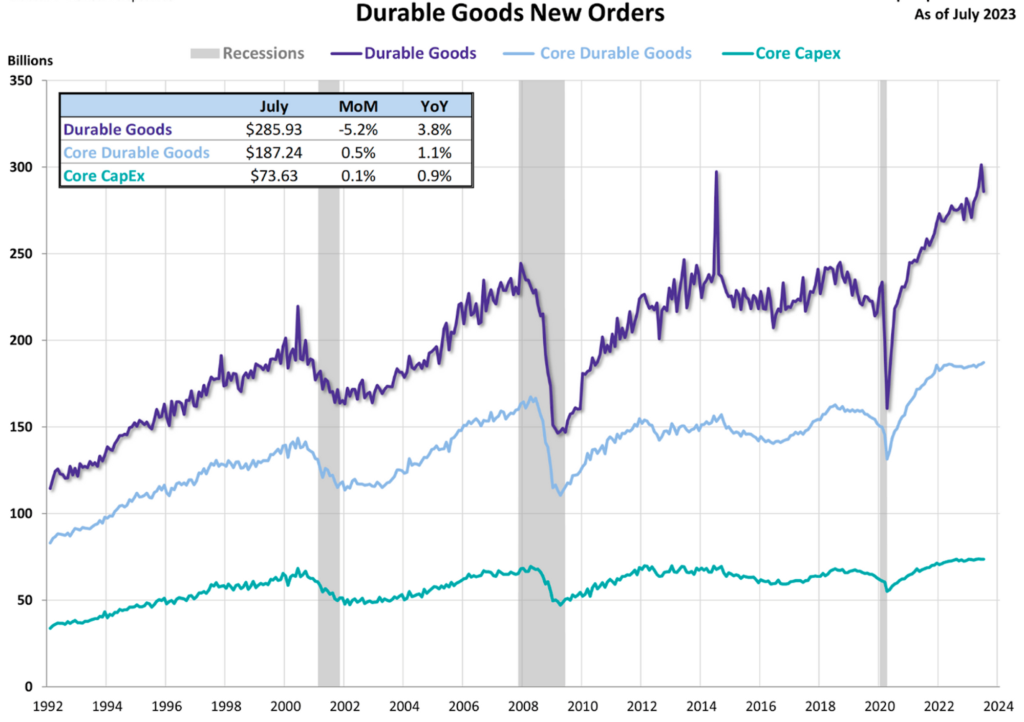
Durable goods orders in the United States fell short of economists’ expectations, according to a report from the Census Bureau. Durable goods orders fell 5.2% in July from a year earlier, falling short of economists’ forecasts for a 4% decline. However, excluding transportation, durable goods orders rose a modest 0.5% from a year earlier, beating economists’ estimate of a 0.4% gain.
Transportation orders, which totaled about $84 billion in July, were down from $125 billion in June. Despite the decline, the Paris Air Show in June contributed to record orders for Boeing and Airbus, with a total of 1,100 aircraft orders – 300 for Boeing and about 800 for Airbus. As of July, Boeing had accumulated about 580 jet orders for 2023, a significant increase from about 420 orders received during the same period in 2022.
Applications for U.S. unemployment benefits fell to their lowest level in three weeks, indicating that demand for workers remains strong. According to a report from the Labor Department, initial claims fell by 10,000 to 230,000 in the week ended Aug. 19, below the median forecast of 240,000 in a Bloomberg survey of economists.
On a seasonally adjusted basis, claims fell to about 198,000 the prior week, the lowest level since October. However, this decline is somewhat offset by a significant increase in claims in Hawaii, which saw its largest increase since the beginning of the epidemic, primarily due to severe wildfires.
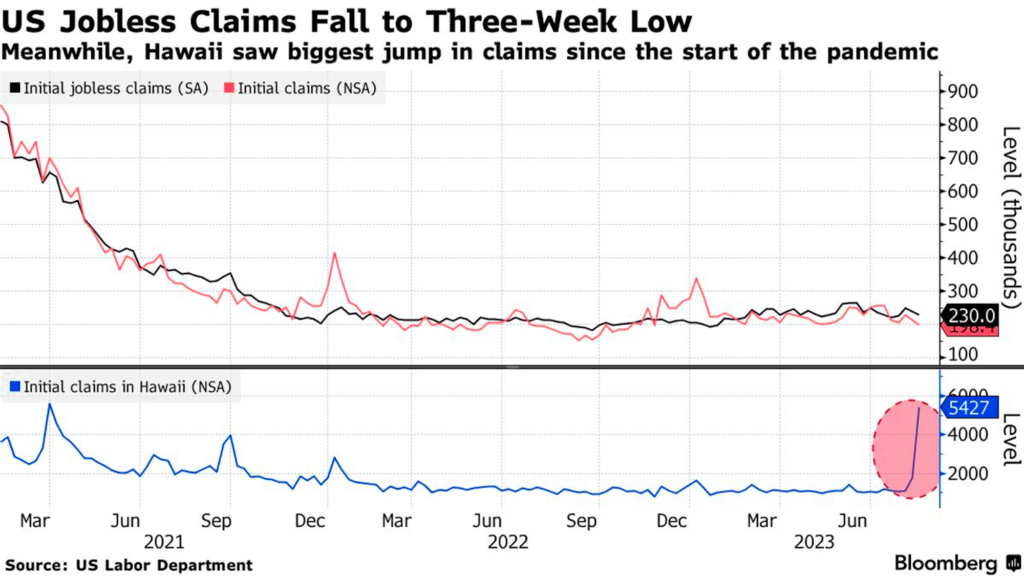
Another report released on Wednesday indicated that job growth in the United States through March may have overstated the resilience of the labor market. For the period through August 12, continuing claims, which include individuals who have been receiving benefits for more than a week, fell slightly to 1.7 million.
During the summer months, initial claims data can show significant fluctuations due to the seasonal retooling period when automakers shut down production for maintenance. To reduce some of this variability, the four-week moving average, which provides a smoother view of the data, increased to 236,750.
Michigan Consumer Sentiment
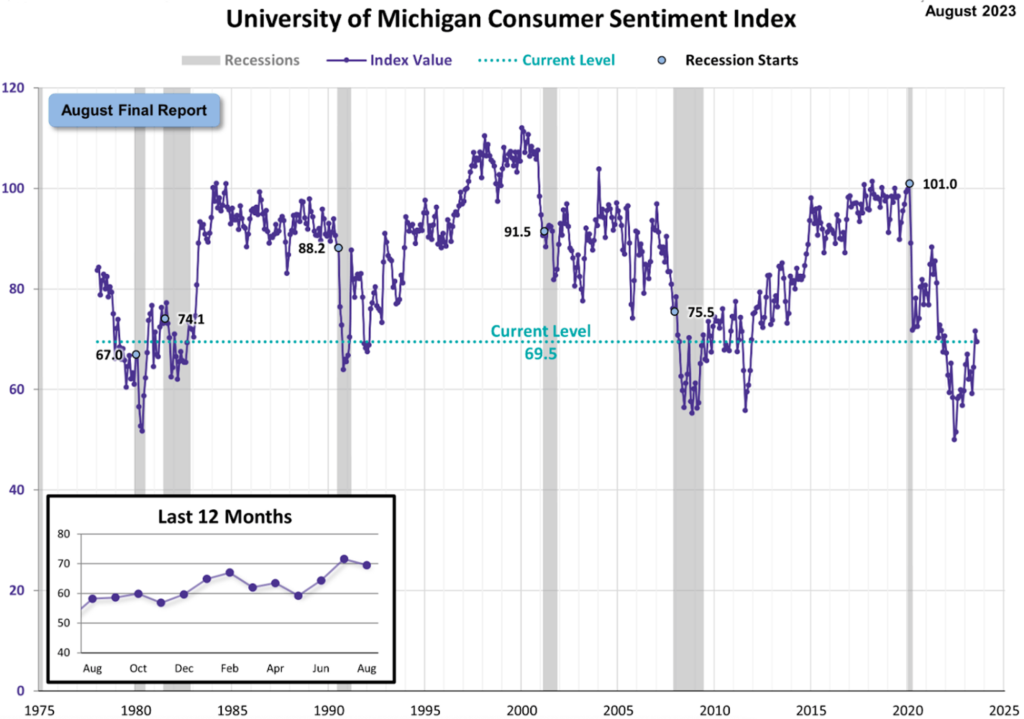
The final report for the University of Michigan’s Consumer Sentiment Index for August came in at 69.5, a decrease of 2.1 points (about -2.9%) from the final index reading for July. This data point is well below the expected reading of 71.2.
💡 The Michigan Consumer Sentiment Index is a monthly survey conducted by the University of Michigan, designed to gauge the levels of consumer confidence in the United States concerning various aspects like the economy, personal finances, business conditions, and buying conditions. Every month, two reports are issued: an initial report released in the middle of the month and a conclusive report issued at the month’s end.
BTC & ETH Price Analysis
BTC has broken through its 200-day moving average (MA). Historically, the 200-day MA has proven to be a strong support level for the price of BTC. As a result, the price of BTC continued to fall after breaking this support level. Current support for BTC is at the 250-day MA at a price of $25,700 and a psychological price level at $25,000.
There are two possible directions for the price of BTC. First, a break below the support level would indicate an increased risk of a downward trend. However, given the prevailing bearish market structure, there is a high probability of a retracement to the 200-day MA, followed by a further decline in the coming weeks.

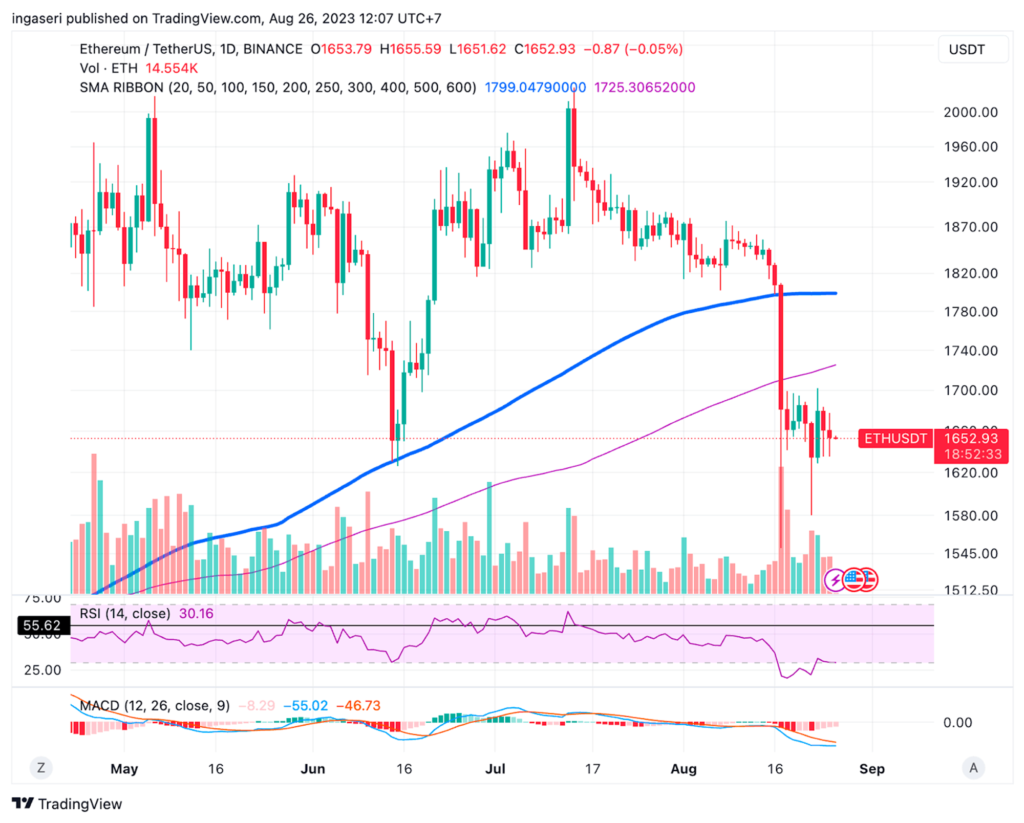
Not much different from BTC, ETH experienced a sharp decline after breaking through the 200-day moving average. This drop also extended the decline below the 250-day moving average. Support is currently found at the 200-week moving average, which is located at the $1,600 level.
On-Chain Analysis
- 📊 Exchange: As the exchange reserve continues to fall, it indicates lower selling pressure. Net deposits on exchanges are high compared to the 7-day average. Higher deposits can be interpreted as higher selling pressure.
- 💻 Miners: Miners’ are selling holdings in a moderate range compared to its one-year average. Miner’s revenue is in a moderate range, compared to its one-year average.
- 🔗 On-Chain: More investors are selling at a loss. In the middle of a bear market, it can indicate a market bottom. Long term holders’ movement in the last 7days were lower than the average. They have a motive to hold their coins. Investors are in a fear phase where they are currently with unrealized profits that are slightly more than losses.
- 🏦 Derivatives: Long position traders are dominant and are willing to pay to short traders. Selling sentiment is dominant in the derivatives market. More sell orders are filled by takers. As open interest decreases, it indicates investors are closing futures positions and possibility of trend reversals. In turn, this might trigger the possibility of long/short-squeeze caused by sudden price movement or vice versa.
- 🔀 Technicals: RSI indicates a oversold condition where 86.00% of price movement in the last 2 weeks have been down and a trend reversal can occur. Stochastic indicates a neutral condition where the current price is in a moderate location between the highest-lowest range of the last 2 weeks.
News About Altcoins
- Injective has released a tokenomics upgrade that can dramatically increase the number of INJ tokens burned each week. More than just a technical improvement, this INJ Burn 2.0 upgrade will allow all decentralized applications (dApps) built on the Injective platform to contribute to the INJ Burn Auction, which can strengthen the on-chain economy powered by INJ. The Burn Auction can now capture the value of all dApps in the rapidly growing Injective ecosystem, fostering collaboration, innovation and collective growth rooted in the principle of community empowerment.
- $PEPE is currently experiencing internal issues where approximately $15 million USD in the form of $PEPE tokens were fraudulently transferred from the multi-signature wallet to various exchanges by a former team member. This individual then fled and deleted his social media accounts following this action. A PEPE spokesperson apologized to the community for the chaos caused and promised to improve security and governance in the future. They stressed that the remaining tokens and the PEPE Twitter account are in safe hands, and they plan to move the remaining 10 trillion tokens to a new wallet for future use or incineration. PEPE will continue its project and aims to restore $PEPE as a decentralized and resilient digital asset.
News from the Crypto World in the Past Week
- The developers of Tornado Cash, Roman Storm and Roman Semenov, are facing serious allegations of money laundering and sanctions violations, with Roman Storm being arrested by the U.S. Department of Justice. The U.S. Department of Justice accuses both of facilitating the laundering of over $1 billion through their cryptocurrency service, which was designed to obscure the origin of crypto transactions, including those linked to hacking operations from North Korea.
Cryptocurrencies Market Price Over the Past Week
Cryptocurrencies With the Best Performance
- dYdX +5.91%
- Tron +4.00%
- Sui (SUI) +3.75%
- WOO Network (WOO) +2.68%
Cryptocurrencies With the Worst Performance
- THORChain (RUNE) -19.38%
- ApeCoin -12.47%
- Curve Finance -10.49%
- Frax Share( FXS) 10.04%
References
- Nikhilesh De, Tornado Cash Devs Charged With Helping Hackers Launder $1B, Including Infamous North Korean Attacks, Coindesk, accessed on 27 Agustus 2023.
- Injective, INJ 2.0 Launch, accessed on 27 Agustus 2023.
- pepecoineth, an announcement to the $PEPE community, X, accessed on 27 Agustus 2023.
Share
Table of contents
Related Article


See Assets in This Article
BTC Price (24 Hours)
Market Capitalization
-
Global Volume (24 Hours)
-
Circulating Supply
-