Market Analysis Dec 9th, 2024: Bitcoin projected to hit $200,000 in 2025

Bitcoin has achieved a significant milestone by breaking the $100,000 psychological price barrier. This level is considered crucial by crypto investors as it is often seen as a key indicator of the market’s overall bullish sentiment
Market Analysis Summary
- 🚀 Market anticipate BTC reaching $200K, but technical indicators point to potential resistance around the $120K level in the near term.
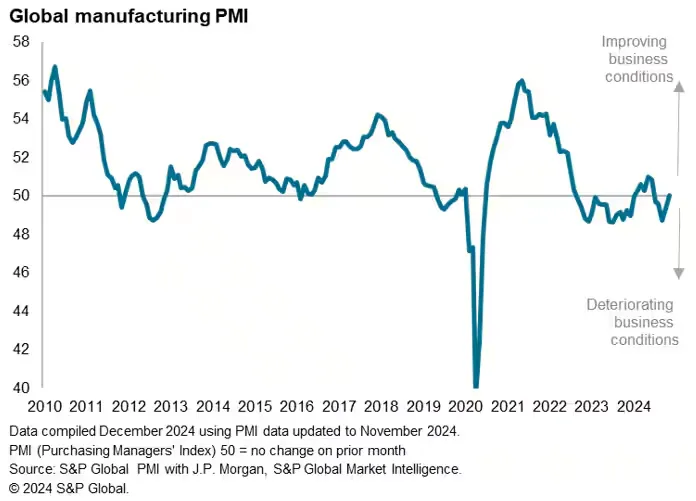
- 📈 The Global Manufacturing PMI compiled by S&P Global Market Intelligence, rose to 50.0 from 49.4 in October.
- 💪🏻 ISM reading for the month came in at 48.4, exceeding the forecast of 47.7 and showing notable improvement from the previous month’s 46.5.
- 💼 The latest US JOLTS job openings report for October came in stronger than expected, with a solid figure of 7.744 million. .
- ⤴️ The ADP report indicates that 146,000 workers were hired in November, signaling that the U.S. job market remains stable.
Macroeconomic Analysis
Manufacturing PMI
The global manufacturing sector stabilized in November after four months of modest declines. The Global Manufacturing PMI, sponsored by J.P. Morgan and compiled by S&P Global Market Intelligence, rose to 50.0 from 49.4 in October, indicating no overall change in operating conditions. However, there were significant regional variations, partly influenced by shifts in response to the potential impact of U.S. tariffs.

Business conditions improved in mainland China, where the PMI reached a five-month high of 51.5, and across the rest of Asia, with a PMI increase to 51.1. In contrast, the Eurozone faced a deeper downturn, with its PMI dropping to 45.2. Meanwhile, the U.S. saw conditions nearing stabilization, as its PMI climbed to a five-month high of 49.7.
Other Economic Indicators
- ISM Manufacturing PMI: The Institute of Supply Management (ISM) has released its latest Manufacturing Purchasing Managers Index (PMI) report, revealing stronger-than-expected performance in the manufacturing sector. The PMI reading for the month came in at 48.4, exceeding the forecast of 47.7 and showing notable improvement from the previous month’s 46.5.
- JOLTs Job Opening: The latest US JOLTS job openings report for October came in stronger than expected, with a solid figure of 7.744 million. This reading reflects employment conditions as of the last working day of the month, likely making it less influenced by weather and industrial actions than the October nonfarm payrolls (NFP) data. Notably, the quits rate rose to 2.1%, its highest since May, suggesting growing confidence among workers in the labor market.
- ADP Employment Change: U.S. businesses added a solid 146,000 jobs in November, according to payroll processor ADP, signaling that the labor market has stabilized following a significant slowdown over the summer. Economists had expected a gain of 163,000 jobs in ADP’s November report.
- S&P Global Services: The S&P Global US Services PMI for November 2024 was revised down to 56.1 from a preliminary estimate of 57, though it remained higher than October’s reading of 55. The data indicated the fastest expansion in the services sector since March 2022, driven by accelerated growth in business activity and new orders. Despite this growth, companies were cautious about expanding their workforce, leading to a slight decline in employment and a buildup of outstanding business.
- ISM Global Services: ISM Global Services Index slipped to 52.1 in November from 56.0 in October, missing the 55.5 consensus estimate, according to Institute of Supply Management data release on Wednesday. While the index fell month-on-month, the reading of over 50 marked the fifth straight month of expansion in the services sector and the 51st time in 54 months that the index signaled growth.
- Initial Jobless Claim: Initial jobless claims increased to 224,000 for the week ending November 30, up slightly from the revised 215,000 in the previous week. Economists had forecast 215,000 claims, in line with the prior week’s figure. Jobless claims have eased from the nearly 1.5-year high recorded in early October, which was driven by hurricanes and significant industrial strikes. Current levels indicate low layoffs and suggest a recovery in employment during November.
BTC Price Analysis
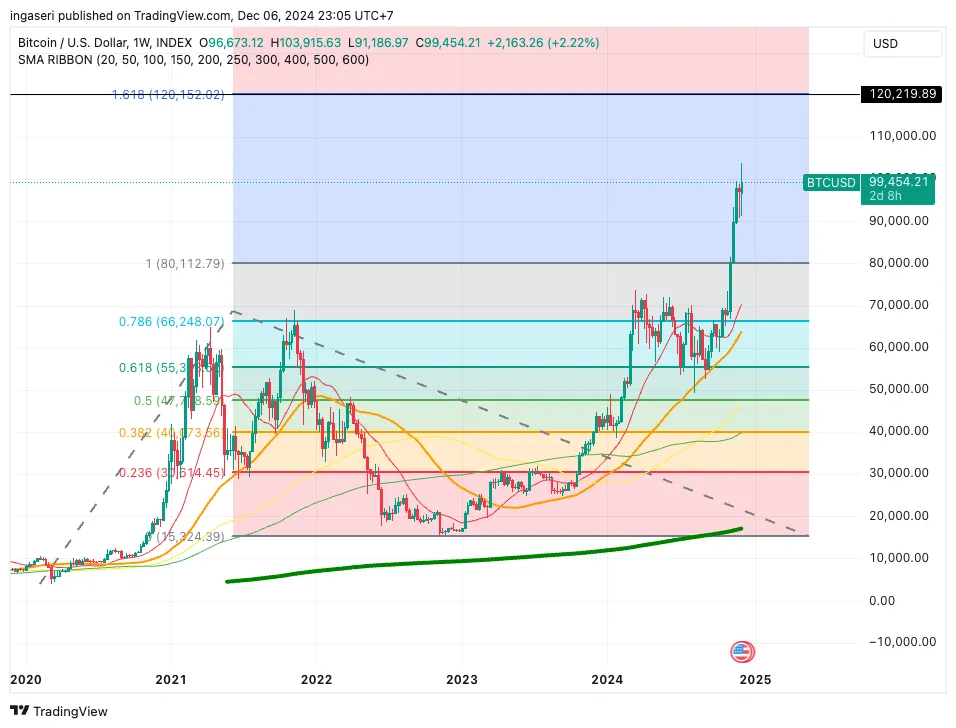
BTC is showing strong bullish momentum, hitting the $100K milestone amid rising demand for call options and a market highly responsive to spot price movements.
ETH is poised to outperform BTC, gaining traction after key market developments, including the resignation of SEC Chair Gary Gensler, which has redirected trader focus and bolstered sentiment toward ETH.
Bitcoin’s recent surge reflects sustained investor interest in the digital currency, even at a six-figure price. Bitcoin ETF experienced net inflows exceeding $33 billion. These funds now manage a record $109 billion in assets after six consecutive days of positive inflows.
Analysts remain optimistic about Bitcoin’s long-term prospects. Experts projected that BTC could reach $200K by 2025, citing robust institutional demand coupled with diminishing supply.
Market anticipate BTC reaching $200K, but technical indicators point to potential resistance around the $120K level in the near term.

On the monthly chart, BTC has completed a classic cup-and-handle pattern. The cup’s upper boundary was at $69K, followed by a handle formation between March and November 2024. From its current level, this implies approximately 25% upside.
This projection aligns with the Elliott Wave theory, where the move to $122K would represent the third wave. This wave would likely be followed by a brief fourth wave correction before a final fifth-wave breakout propels Bitcoin to the $200K mark.
On-Chain Analysis
- 📊 Exchange: As the exchange reserve continues to fall, it indicates lower selling pressure. Net deposits on exchanges are high compared to the 7-day average. Higher deposits can be interpreted as higher selling pressure.
- 💻 Miners: Miners’ are selling more holdings compared to its one-year average. Miner’s revenue is in a moderate range, compared to its one-year average.
- ⛓️ On-chain: More investors are selling at a profit. In the middle of a bull market, it can indicate a market top. Long term holders’ movement in the last 7 days were higher than the average. If they were moved for the purpose of selling, it may have negative impact. Investors are in a belief phase where they are currently in a state of high unrealized profits.
- 🏦 Derivative: Long position traders are dominant and are willing to pay to short traders. Selling sentiment is dominant in the derivatives market. More sell orders are filled by takers. As open interest increases, it indicates more liquidity, volatility, and attention are coming into the derivative market. The increasing trend in open interest could support the current ongoing price trend.
- 🔀 Technicals: RSI indicates a neutral condition. Stochastic indicates a neutral condition where the current price is in a moderate location between the highest-lowest range of the last 2 weeks.
News About Altcoins
- Pudgy Penguins NFT Surge Driven by PENGU Token Launch Plans. The Pudgy Penguins NFT collection has announced plans to launch a new token called PENGU on the Solana network by the end of 2024. This announcement triggered a 383% surge in sales and a 17% increase in the floor price to 17.97 ETH (approximately $72,160) within 24 hours. The total supply of PENGU tokens is estimated to be 88 billion, with 25.9% allocated to the Pudgy Penguins community and 24.12% to other communities. Since its launch in 2021, the collection has remained successful, even expanding by releasing licensed physical toys in major retail stores like Walmart. Pudgy Penguins currently leads Blur’s rankings with a daily trading volume of 5,230 ETH ($21 million), marking a 449% increase.
News from the Crypto World in the Past Week
- Rejection of Solana ETFs by the SEC Under Current Leadership. The United States Securities and Exchange Commission (SEC) is reportedly set to reject applications for Solana ETFs under the current administration, according to Fox News journalist Eleanor Terrett. At least two out of five issuers applying for SOL ETFs have received notification of rejection from the SEC. Several asset management firms, including VanEck, 21Shares, and Canary Capital, filed applications starting in mid-2023. While these rejections delay approvals, there is still potential for change with new SEC leadership after President Trump nominated Paul Atkins to replace Gary Gensler. Terrett predicts that SOL ETFs will be approved simultaneously, similar to the previous launch of Bitcoin ETFs.
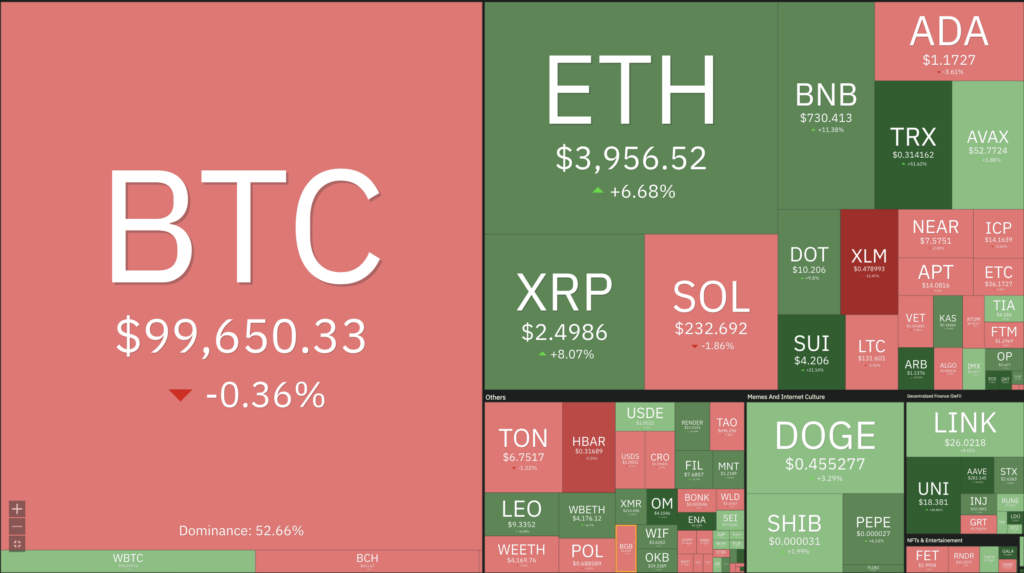
Cryptocurrencies Market Price Over the Past Week

Cryptocurrencies With the Best Performance
Cryptocurrencies With the Worst Performance
- Stellar -14.13%
- Raydium (RAY) -6.78%
- Algorand (ALGO) -1.83%
- Solana (SOL) -1.41%
References
- Ciaran Lyons, Spot ETH ETFs clocks highest daily inflow day: ‘Alt rotation has begun’, cointelegraph, accessed on 1 Desember 2024.
- Cryptonary, A thesis on how DogWifHat (WIF) gets to $100, accessed on 1 Desember 2024.
Share
Related Article
See Assets in This Article
BTC Price (24 Hours)
Market Capitalization
-
Global Volume (24 Hours)
-
Circulating Supply
-


