Market Analysis Februari 11, 2023: SEC Tightens Crypto Regulation, Crypto Market Weakened

The Federal Reserve announced that disinflation has begun, but it will take time. Meanwhile, the prices of crypto assets remained relatively steady in the market, although towards the end of the week, BTC fell by 5% and ETH as much as 6% following the news about The US Securities and Exchange Commission (SEC) shutting down Kraken’s staking services.
As usual, the Pintu trader team has collected various data that analyze macroeconomics and the crypto market movement in the past week. However, you need to pay attention that all information in this market analysis is for education, not financial advice.
Market Analysis Summary
- 📉 The Fed stated that the process of disinflation has started but will require time. It is likely to take until the end of 2023 and possibly into 2024 to bring inflation down close to 2%.
- 💼 US is experiencing job growth, and the unemployment rate is at a record low since 1969.
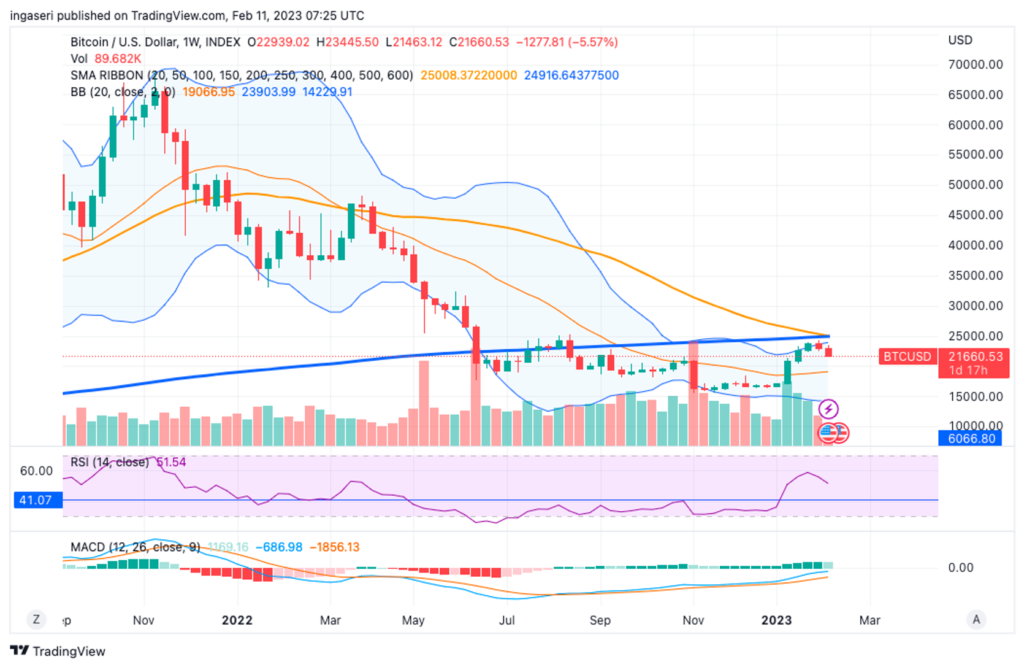
- 🪙 BTC finds itself rejected at the 200 weeks MA resistance line. On the weekly chart, we can see that there is an impending death cross. Its support at 21,400.
- 🚨 ETH price expect a further downturn in its price action after we broke down below RSI value of 52.
Macroeconomic Analysis
The Greenback (US dollar) showed strength at the end of last week after the unemployment rate ticked down to 3.4%, the lowest unemployment rate since 1969.
On Tuesday, Jerome Powell, the Fed chair, stated that the process of disinflation has started but will require time. The market was initially influenced by Powell’s remarks and showed a brief improvement, but then turned negative again when he warned about possible stronger economic data than expected. Powell added that if reports of strong labor market or higher inflation persist, the Fed may need to take additional actions, such as increasing interest rates, which may be more than currently anticipated.
Powell did not specify when the interest rate hikes will end and indicated that it may take until 2024 for inflation to reach a level that the Fed finds satisfactory. The central bank’s target is 2% inflation, but it is currently significantly higher than that by multiple indicators.
Powell mentioned that the Fed anticipates a substantial decrease in inflation during 2023 and it is their responsibility to ensure it happens. He also stated that it is likely to take until the end of 2023 and possibly into 2024 to bring inflation down close to 2%.
The next big number is January’s CPI on 14 February 2023.
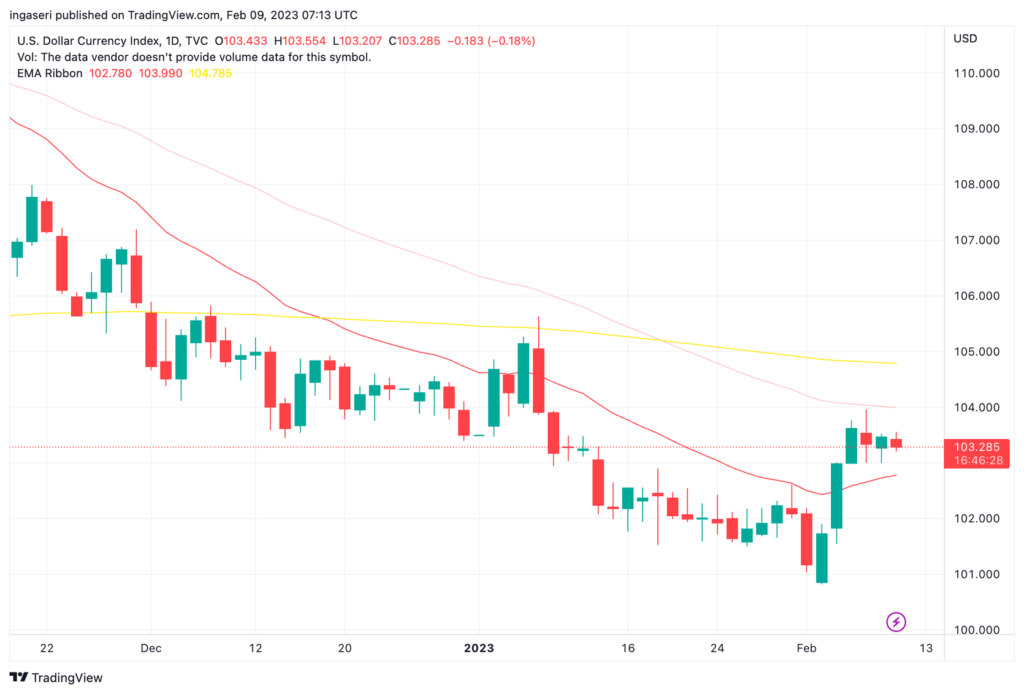
The market reacted positively however since the beginning of the week.
Recently, the prospects for the US economy have greatly improved, however, the Treasury yield curve is still close to its most severely inverted level in over 40 years.
The Treasury yield curve is a curve that reflects the yield (interest rate) of US bonds based on their maturity date.
The treasury yield curve inversion has been a reliable indicator of an impending recession. The three-month to 10-year spread, which is considered to be the most accurate among the different yield curve measures utilized by traders and analysts, has inverted prior to every recession in the United States since the 1980s, as per information from the St. Louis Federal Reserve.
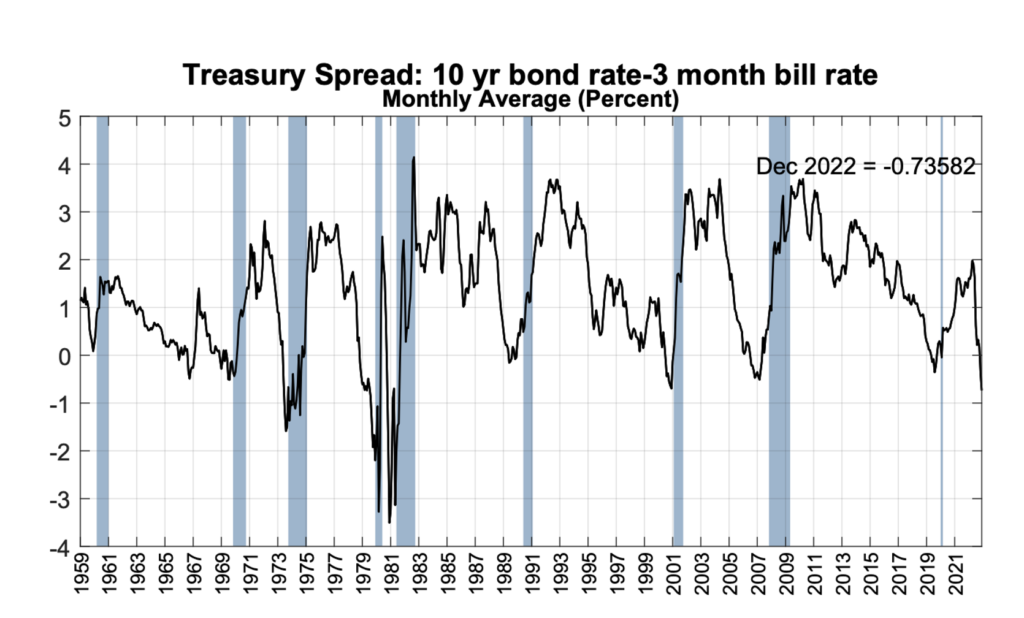
On the contrary, the job market paints a different picture. According to the latest January report, the U.S. is experiencing job growth, and the unemployment rate is at a record low. Given that consumers drive the majority of the U.S. economy, it is highly unlikely for the country to enter a recession while employment is on the rise.
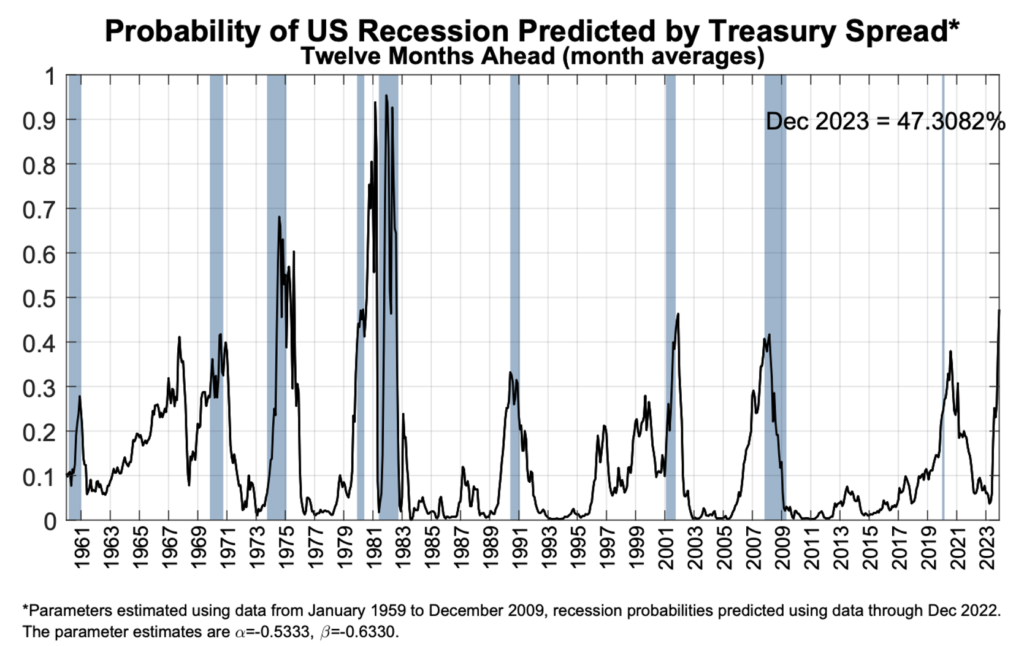
As of December 2022, the New York Fed has estimated a 47% likelihood of a U.S. recession within the next 12 months. This is considered to be a high probability, higher than before the previous four U.S. recessions. Despite the strong historical correlation between the yield curve and recessions, it’s important to keep in mind that no economic indicator is foolproof and the yield curve may not be accurate this time. However, as the yield curve is a forward-looking indicator, it’s too early to dismiss its recessionary signal.
Bitcoin Price Analysis
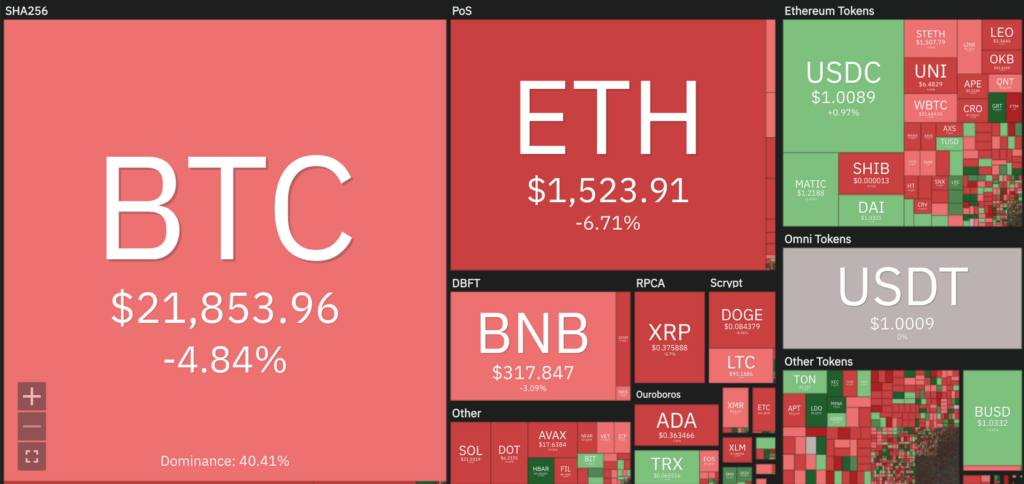
Over the week, the price of crypto remained relatively stable. However, towards the end of the week, both BTC fell by 5% and ETH as much as 6% as the news spread about SEC shutting down Kraken staking services.
Staking is simply an activity to lock cryptocurrency to get rewards, a mechanism used in blockchain that uses proof-of-stake.
As part of a settlement with the SEC, Kraken has announced it will terminate its cryptocurrency staking program in the US and pay a penalty of $30 million. The SEC has accused the company of offering unregistered securities through its “crypto asset staking-as-a-service” program. It has been evident for some time that the SEC intends to crack down on cryptocurrency yield programs.
On another note, it has been reported that Paxos Trust Company, the stable coin issuer based in New York and responsible for Binance USD (BUSD) and Paxos Dollar (USDP), is being investigated by the New York Department of Financial Services (NYDFS).
BTC finds itself rejected at the 200 weeks MA resistance line. On the weekly chart, we can see that there is an impending death cross. Support at 21,400.
Ethereum Price Analysis
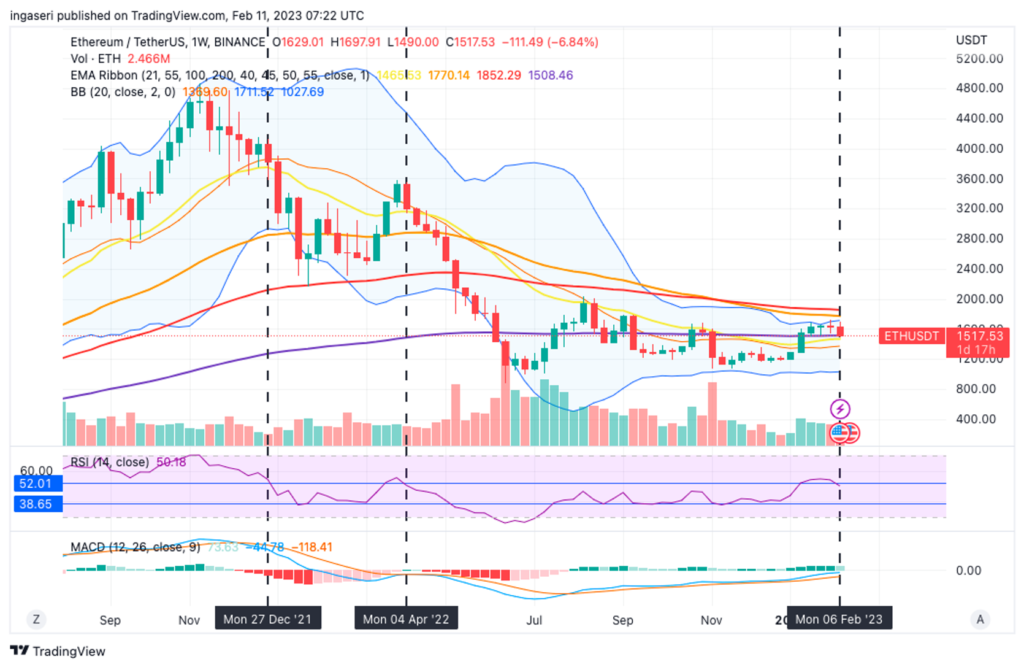
ETH is holding support at the 200 weeks EMA. Notice the RSI breakdown from the historic value of 52. Expect a further downturn in its price action after we broke down below RSI value of 52. This is expected as we are at the top edge of the Bollinger’s band as seen below.
Bitcoin Network Analysis
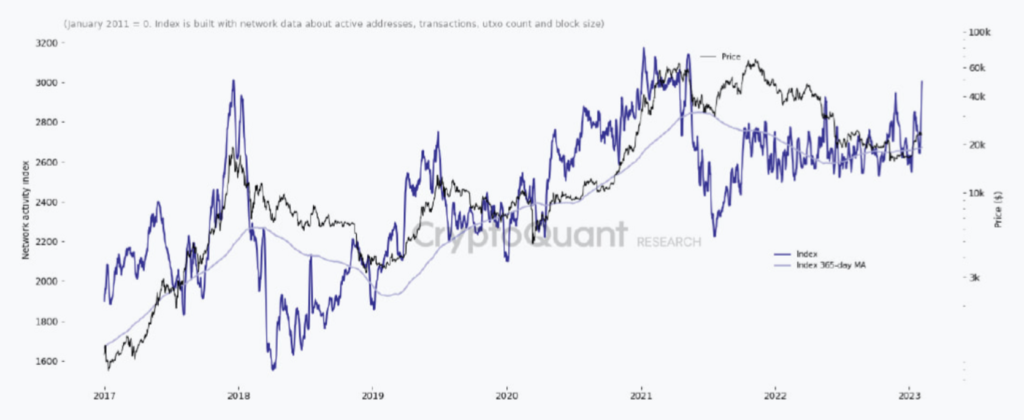
Recently, the activity on the Bitcoin network has reached its peak since May 2021. The daily number of transactions in the network has surged to 345K, the highest it has been since April 2021, which has resulted in an increase in overall network activity.
Stablecoin Supply Analysis
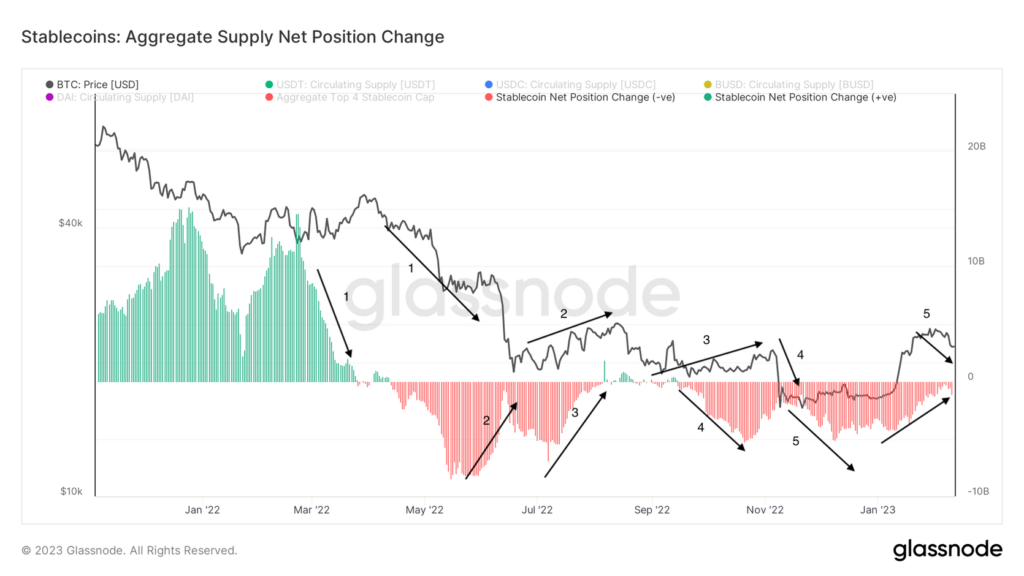
This chart shows the 30-day net change in supply of the top four stablecoins USDT, USDC, BUSD and DAI. It will return a positive value when the 30-day aggregate stablecoin supply has expanded, and a negative value when it contracts. Notice that the change in supply always preceded the price action of BTC since the beginning the year. What we are seeing currently is a positive 30 day aggregate supply of top 4 stablecoins. Would we expect a positive price action in the coming weeks?
On-chain Analysis
📊 Exchanges: As the exchange reserve continues to fall, it indicates lower selling pressure. Net deposits on exchanges are high compared to the 7-day average. Higher deposits can be interpreted as higher selling pressure.
💻 Miners: Miners’ are selling holdings in a moderate range compared to its one-year average. Miner’s revenue is in a moderate range, compared to its one-year average.
🔗 On-Chain: More investors are selling at a profit. In the middle of a bull market, it can indicate a market top. Long term holders’ movement in the last 7days were lower than the average. They have a motive to hold their coins. Investors are in a Fear phase where they are currently with unrealized profits that are slightly more than losses.
🏦Derivatives: Long position traders are dominant and are willing to pay to short traders. Buying sentiment is dominant in the derivatives market. More buy orders are filled by takers. As OI increases, it indicates more liquidity, volatility, and attention are coming into the derivative market. The increasing trend in OI could support the current ongoing price trend.
📈 Technicals: RSI indicates a Neutral condition. It indicates a Neutral condition where the current price is in a moderate location between the highest-lowest range of the last 2 weeks.
Altcoin News
- 🇸🇦 Saudi Arabia partners with The Sandbox to develop a metaverse project. According to Sebastien Borget, co-founder of The Sandbox, in his tweet, this partnership aims to explore and support each other mutually in the activation of the Metaverse. The Sandbox has partnered with some of the biggest names such as Snoop Dogg, Gucci, Tim, Atari, HSBC and Warner Music Group.
- 🔴 Optimism token (OP) weakened after the second airdrop. Optimism Network distributed 11.7 million tokens to more than 300.000 wallet addresses on Thursday (Februari 9, 2023). These tokens were given to wallet addresses that have spent more than 6.1 US dollars in gas fees on Optimism and who have delegated their voting rights. Following Thursday’s airdrop announcement, the price of OP tokens fell by 13% on Friday (February 10, 2023).
Crypto News
- 🖼️Bitcoin Punks NFT price soars. Bitcoin Punks is the first upload of native Ethereum CryptoPunks into the Bitcoin blockchain using Ordinals. On Wednesday (February 8, 2023), one Bitcoin Punks Ordinal NFT, Punk 94, sold for 9.5 BTC, or about 214.000 US dollars.
- ‼️Paxos Trust Co., faces SEC lawsuit over Binance USD Token. According to people, the SEC issued a Wells notice notifying that BUSD, a digital asset that Paxos issues and lists, is an unregistered security. However, it couldn’t be determined if the SEC notice is specifically related to Paxos’ issuing of the coin, the listing of the coin or both.
- ⛓️MakerDAO, one of the largest crypto asset lending platforms, has integrated its system with Chainlink Automation. Chainlink Automation will run certain tasks, including price updates and liquidity balancing. This will help maintain the stability of the platform’s 5 billion US dollar DAI stablecoin.
Cryptocurrency Market Performance Over the Past Week
Best Performing Crypto
- Oasis Network (ROSE) +37.89%
- Hedera (HBAR) +18.76.00%
- The Graph (GRT) +18.48%
- Lido DAO (LDO) +12.45
Worst Performing Crypto
- Optimism -22.83%
- Fantom (FTM) -22.83%
- dYdX (DYDX) -19.74%
- Terra (LUNA) -14.47%
References
- Savannah Fortis, Saudi Arabia Partners with The Sandbox for Future Metaverse Plans, Coin Telegraph, diakses 11 Februari 2023.
- Elizabeth Napolitano, OP Token Falls After Surprise Optimism Airdrop, Coindesk, diakses 11 Februari 2023.
- Krisztian Sandor, DeFi Giant MakerDAO Integrates Blockchain Data Provider Chainlink for DAI Stablecoin, Coindesk, diakses 11 Februari 2023.
- Cam Thompson, Bitcoin Punks: Ordinal NFT Collection Soars in Value, Coindesk, diakses 11 Februari 2023.
- Vicky Ge Huang, Patricia Kowsmann and Dave Michaels, Crypto Firm Paxos Faces SEC Lawsuit Over Binance USD Token, The Wall Street Journal, diakses 13 Februari 2023.
Share
Related Article
See Assets in This Article
OP Price (24 Hours)
Market Capitalization
-
Global Volume (24 Hours)
-
Circulating Supply
-

