Market Analysis Jan 29th, 2024: The $41,000 mark is crucial for Bitcoin’s continued momentum

Crypto investors can breathe a sigh of relief, for now. After a sharp drop to $38K, Bitcoin has bounced back to the $41K level. But the big question remains: Is this a genuine recovery, or just a temporary break in the bearish trend? Dive into our analysis below to find out.
As usual, the Pintu trading team has gathered critical information and analyzed the general economic situation and the crypto market’s movements over the past week. However, it should be noted that all information in this Market Analysis is intended for educational purposes, not as financial advice.
Market Analysis Summary
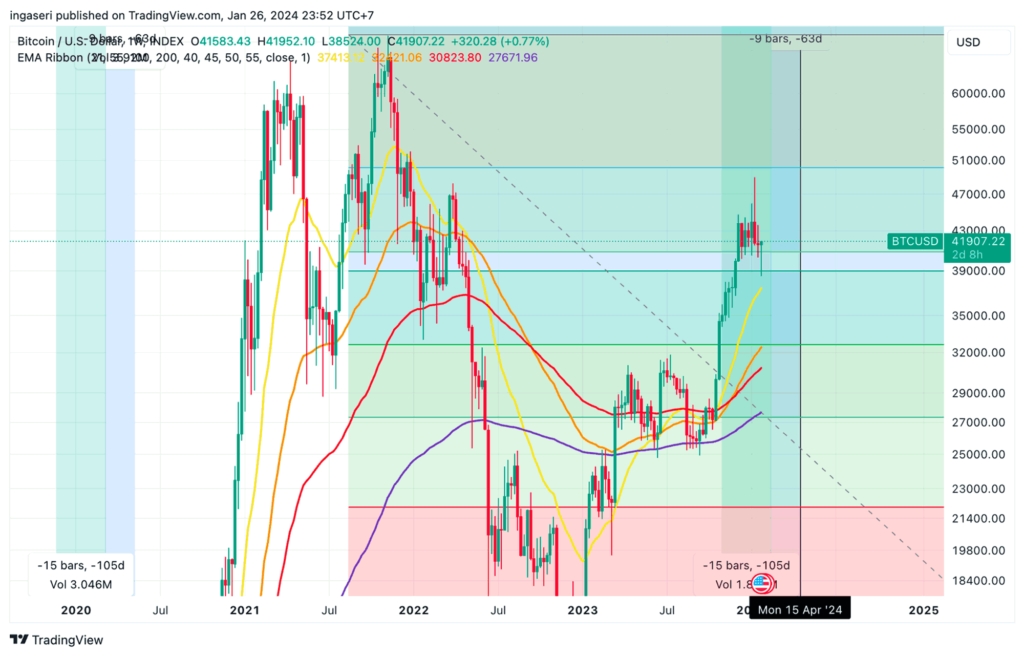
- ✍🏻 The current price movement of BTC is finding support near the upper range of the golden ratio Fibonacci retracement zone at $41,000, while ETH needs to maintain support at the $2,200 level.
- 🟢 The Consumer Sentiment Index recorded a figure of 78.8, reflecting a 13.1% increase from December and a 21.4% rise from January 2023. This significant surge in consumer sentiment indicates potential future economic improvement, marking a positive development for the U.S.
- 📈 In the week ending January 20, initial unemployment claims rose by 25,000 to reach 214,000.
- 👀 The U.S. economy grew at an annual rate of 3.3% in the last quarter, suggesting that The Fed is on a path towards what is referred to as a soft landing.
Macroeconomic Analysis
Michigan Consumer Sentiment
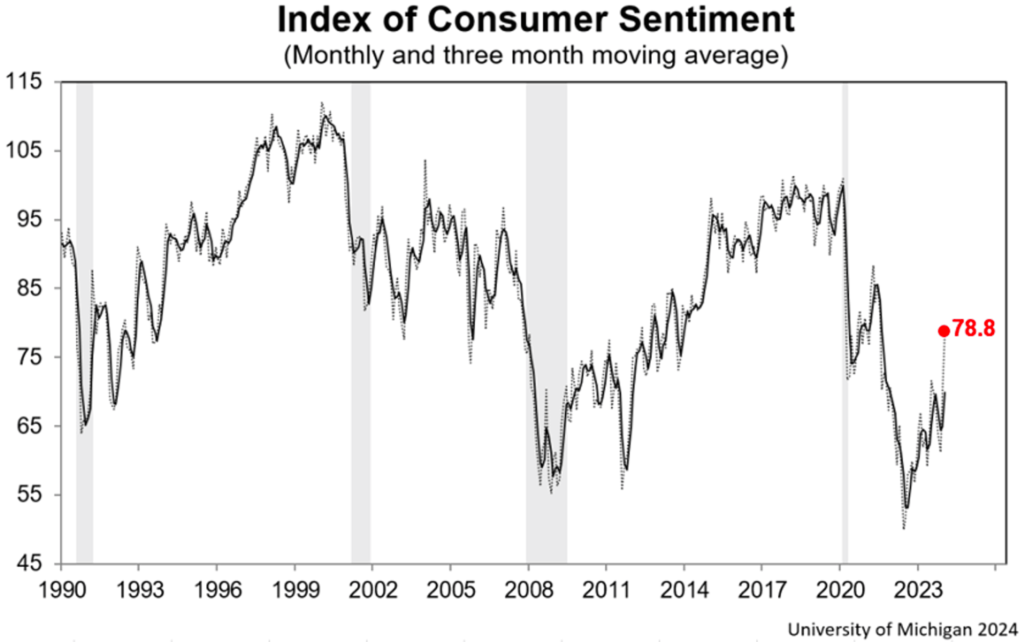
Michigan consumer sentiment soared by 13.1% from December and 21.4% from January 2023. The optimism stems from easing inflation and improving income expectations. Given that consumer spending accounts for about 70% of the US economy, a significant jump in consumer sentiment suggests future economic improvement is a positive development for the US.
Other Economic Indicators
- Home Sales: In 2024, there is optimism for a recovery in U.S. home sales following a 13-year low in December. This optimism is driven by factors such as lower mortgage rates, improved housing inventory, and a rise in Michigan consumer sentiment driven by declining inflation and income expectations. These factors point to potential economic improvements.
- S&P Global Index: Economic output hit a seven-month high in January, boosted by falling inflation and pointing to a possible soft landing scenario that investors have been anticipating. The preliminary U.S. S&P Global Composite Purchasing Managers’ Index (PMI), which covers the services and manufacturing sectors, rose to 52.3, beating economists’ expectations of 51.0.
- Durable Goods: U.S. durable goods orders were unchanged in December, defying expectations for a 1.1% increase, mainly due to a 0.9% decline in transportation equipment. This follows a 5.5% increase in November and a 4.4% increase year-over-year. Meanwhile, the manufacturing sector, which accounts for 10.3% of the economy, faces challenges from rising interest rates. Orders for nondefense capital goods excluding aircraft rose 0.3%, suggesting a modest increase in business equipment spending in the fourth quarter.
- U.S. GDP Growth Rate: The economy expanded at a 3.3% annualized rate in the last quarter, following a 4.9% pace of growth in the third quarter. This led the Fed to appear to be on course for what it’s termed a soft landing.
- Goods Trade Balance: The U.S. goods trade deficit decreased slightly by 1% to $88.5 billion in December from November. This was due to a $4.1 billion increase in exports to $169.8 billion, partially offset by a $3.2 billion increase in imports to $258.3 billion. Wholesale inventories, however, rose a marginal 0.4% from November, but were still 2.7% lower than a year earlier, suggesting that businesses were cautious about restocking despite the slight improvement in trade.
- Initial Jobless Claims: U.S. initial jobless claims unexpectedly rose in the week ending January 20, breaking a seven-week decline and rising above 200,000 for the first time since mid-November. Although continuing claims also rose slightly, the four-week moving average of initial claims continued its downward trend. Analysts remain cautious, looking to future data to confirm whether this is a temporary downturn or a sign of broader changes in the labor market.
BTC & ETH Price Analysis
BTC
The current price movement of BTC finds support near the upper range of the Fibonacci retracement golden ratio zone at 41,000 USD after it falls to 38,500 USD midweek, If we manage to conclude Monday with a closing above this support line, we move closer to establishing this upper limit as a robust support level, potentially paving the way for an upward move in BTC.
ETH
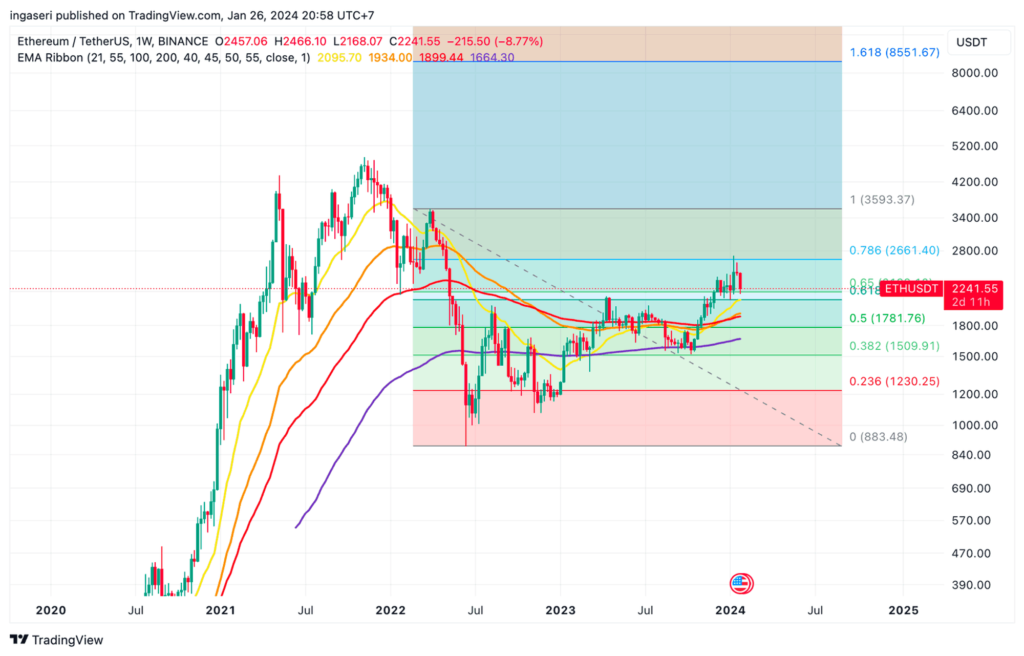
ETH faces a similar situation to BTC, aiming to solidify the upper limit of the Fibonacci at $2,200 as a reliable support line. It has experienced a nearly 8% decline in value week over week, with its price breaking below a 95-day ascending support trend line. The critical challenge now is to maintain support at the $2,200 level. Both the weekly and daily timeframes, in terms of price action and indicator readings, indicate multiple bearish signals. Despite the pessimistic ETH price forecast, a potential rebound at the $2,200 horizontal zone could catalyze an upturn. Presently, ETH is within the horizontal support range of $2,200.
A breakdown from this level could lead to a decline of approximately 11%, reaching the 0.618 Fibonacci retracement support level at $1,980. Despite the negative forecast for ETH’s price, a robust rebound at the $2,200 support region has the potential to initiate a 7% upswing toward the ascending support trend line at $2,400.
Crypto Market
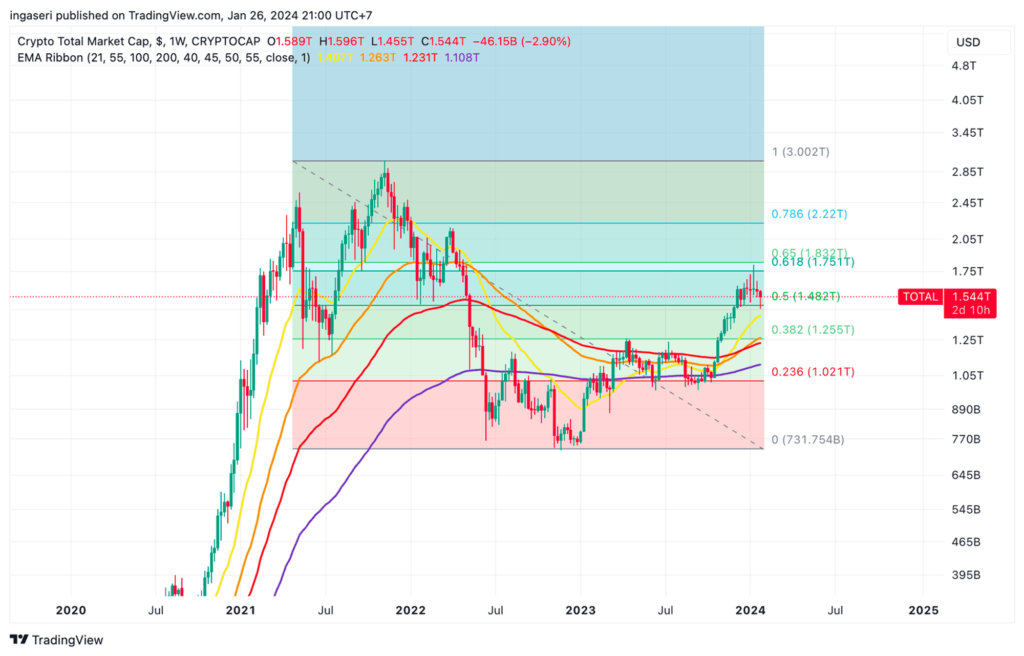
The total crypto market rests above the support line of 1.42 trillion USD. It currently stood at 1.57 Trillion USD, recording an increase of 2.73% over the last 24 hours, a decline of 1.85% across the previous seven days, and a 4.22% drop on its monthly chart.
On-Chain Analysis
- 📊 Exchange: As the exchange reserve continues to rise, it indicates higher selling pressure. Net deposits on exchanges are low compared to the 7-day average. Lower deposits can be interpreted as lower selling pressure.
- 💻 Miners: Miners’ are selling more holdings compared to its one-year average. Miner’s revenue is in a moderate range, compared to its one-year average.
- 🔗 On-Chain: More investors are selling at a profit. In the middle of a bull market, it can indicate a market top. Long-term holders’ movement in the last 7 days was higher than the average. If they were moved for selling, it may have a negative impact. Investors are in an anxiety phase where they are currently in a state of moderate unrealized profits.
- 🏦 Derivatives: Long-position traders are dominant and are willing to pay short traders. Selling sentiment is dominant in the derivatives market. Takers fill more sell orders. As open interest decreases, it indicates investors are closing futures positions and the possibility of trend reversals. In turn, this might trigger the possibility of a long/short squeeze caused by sudden price movement or vice versa.
- 🔀 Technicals: RSI indicates an oversold condition where 79.00% of price movement in the last 2 weeks has been down and a trend reversal can occur. Stochastic indicates an oversold condition where the current price is close to the bottom of the last 2 weeks and a trend reversal can occur.
News About Altcoins
- AltLayer Distributes $100M Airdrop to Ethereum Users’ Wallets. AltLayer, a decentralized protocol facilitating rollup implementation and other scaling solutions for Ethereum, has generously airdropped $100 million worth of its ALT tokens to eligible users. This airdrop, claimable until February 25th, serves as a token of appreciation for early adopters and contributors, while simultaneously decentralizing the platform’s governance structure.
- Jupiter Exchange’s Trading Surge Driven by WEN Memecoin and Upcoming JUP Airdrop. The Solana-based decentralized exchange Jupiter has recently seen a surge in trading volumes, reaching $480 million in 24 hours, partly driven by the interest in a new memecoin called “Wen.” This coin, which contributed over $50 million to Jupiter’s daily trading volume, was available to Solana users who had interacted with Jupiter in the past six months and owners of Solana’s Saga phone. The memecoin was created as a precursor to the anticipated airdrop of Jupiter’s native token, JUP, set to launch on January 31. Pre-market trading of JUP tokens is around $0.61, with the total value of the 1 billion token JUP airdrop potentially exceeding $600 million. This excitement around WEN and JUP tokens is part of a broader trend of airdrops within the crypto ecosystem, including significant airdrops announced by Ethereum scaling solution AltLayer and multilayer rollup deployer Dymension.
News from the Crypto World in the Past Week
- BlackRock’s Ethereum ETF Hopes on Hold as SEC Pushes Decision to March. BlackRock’s hopes for a swift Ethereum ETF approval were dashed as the Securities and Exchange Commission (SEC) postponed its decision until March. This delay casts a shadow of uncertainty over similar proposals and throws cold water on the earlier optimism fueled by Bitcoin ETF approvals. While regulators haven’t explicitly denied Ethereum-linked investment products, their cautious approach suggests an extended wait for a green light.
Cryptocurrencies Market Price Over the Past Week
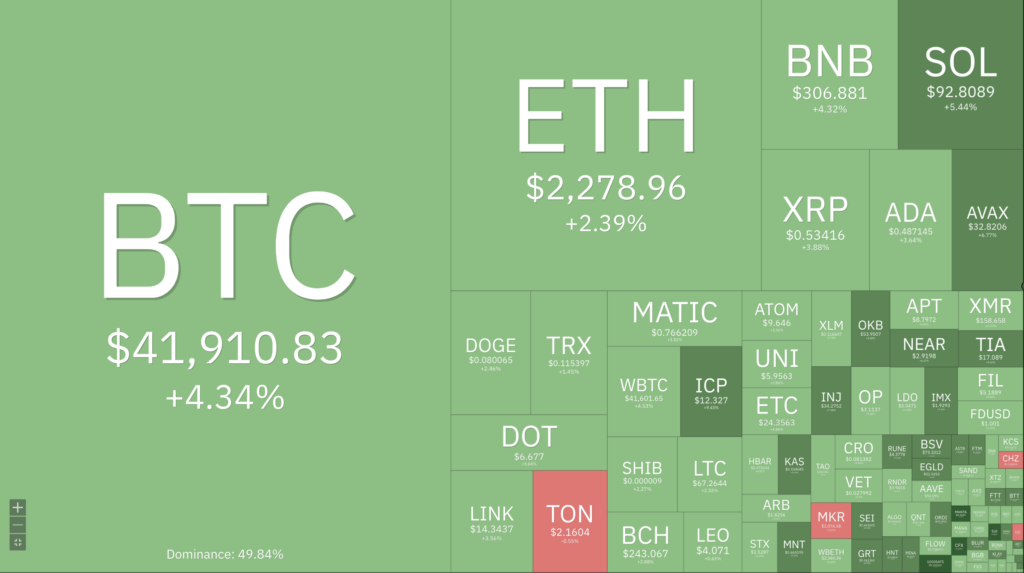
Cryptocurrencies With the Best Performance
- Manta Network (MANTA) +46,22%
- Sui (SUI) +29,49%
- Conflux (CFX) +21,14%
- Chiliz +20,37%
Cryptocurrencies With the Worst Performance
- Ordi (ORDI) -13,06%
- WOO -12,93%
- Chainlink -11,56%
- Ethereum -8,32%
References
- Sarah Wynn, SEC delays decision timeline for BlackRock’s proposed spot Ethereum ETF to March, theblock, accessed on 27 January 2024.
- Andrew Hayward, AltLayer Airdrop Puts $100 Million Into the Wallets of Ethereum Users, decrypt, accessed on 27 January 2024.
- Tom Mitchelhill, Solana DEX Jupiter flips Uniswap amid stablecoin, Wen airdrop frenzy, cointelegraph, accessed on 29 January 2024.
Share
Related Article
See Assets in This Article
BTC Price (24 Hours)
Market Capitalization
-
Global Volume (24 Hours)
-
Circulating Supply
-


