Market Analysis June 26- July 2: BTC Short Squeeze & Emerging Signs of Recession

The crypto market in recent months has been in a downward trend. Through the Market Analysis compiled by Pintu’s team of traders, you can study the price movements of Bitcoin and other crypto assets, as well as find out the latest updates in the industry. However, kindly note that all information from market analysis is for educational and informational purposes only, and not financial advice.
block-heading joli-heading" id="market-analysis-summary">Market Analysis Summary
- 📈 BTC experienced a short squeeze with a price increase to around 20,900 US dollars on Friday (1 July 2022), which was then followed by a decline to 19,000 US dollars.
- 🚨 Signs of an economic downturn have been seen in various sectors, from commodities to housing, following the Fed’s policy. Consumer sentiment has fallen to record lows, while investor sentiment tends to be very pessimistic.
- ⚠ There will be two more rate hikes by the Fed with 75bps each in July and September this year. The interest rate will be in the range of 3.00%-3.25%.
- 🎢 The largest number of Bitcoin outflows from the exchange has been recorded. The events that happened to 3AC, Celsius, Voyager, and the like have caused market participants to withdraw their Bitcoins from exchanges.
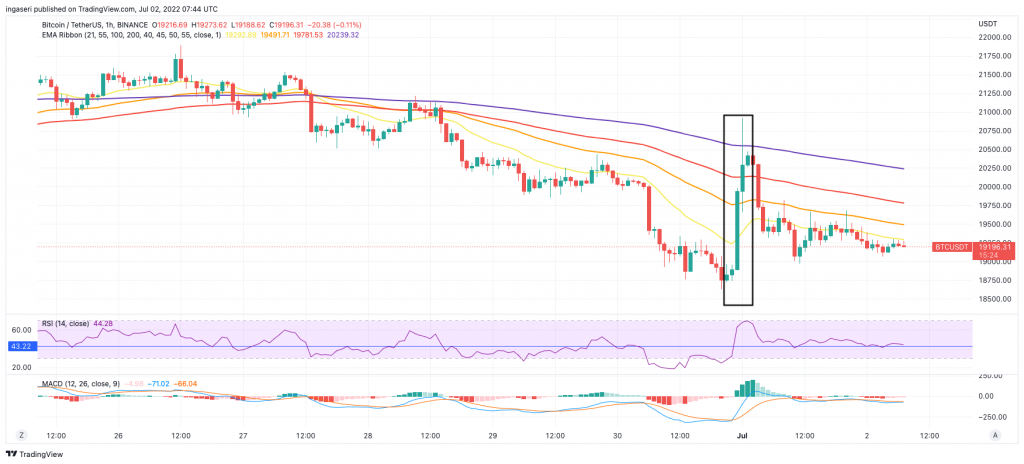
BTC Price Movement on 26 June-2 July 2022
Over the past week, we have seen a liquidation of USD 200 million in BTC and ETH futures trades, caused by the market experiencing a short squeeze on Thursday. On Thursday (30th June 2022), the price of BTC dipped below 20K US dollars amid the downturn of the Eurasian market. A short squeeze ensued which sent the BTC price up to over 20,900 US dollars on Friday (1 July 2022) as can be seen in the chart below, which was followed by a decline to 19,000 US dollars as traders took profits.
A dull stock market, soaring inflation, and rising interest rates have left everyone less than optimistic about the state of the economy. Consumer sentiment has plunged to a record low. and Investor sentiment are very pessimistic. Extreme sentiment readings tend to be contrary indicators. Currently, they are so extremely pessimistic that they may be signaling better times ahead.
Earlier in June, the consumer price index jumped to its highest level in 40 years. The government’s primary inflation gauge saw prices surging 8.6% for the past 12 months. And now the Fed is raising interest rates at an aggressive pace as it looks to slow down economic activity.
💡 Please note that we are not in a recession yet. However, signs of an economic downturn appeared in various sectors, from commodities to housing, after the Fed’s policy.
Fed Policy
Since the start of this year, Fed officials have become increasingly hawkish in their discussions about the outlook for monetary policy. They decided to raise the federal funds rate by 25bps on March 16, which was then followed by a 50bps hike on May 4, and a 75bps hike on June 15 to 1.50%-1.75%. Two more hikes of 75bps are expected in July and September, raising the range to 3.00%-3.25%.
Balance
The probability of a recession is 50%. If a recession occurs, it would likely be a mild one. This is because the financial system, especially the banking system, is mostly well-capitalized. The current situation will measure the ability of large banks to face a severe economic downturn. The Fed’s annual “stress test” results show that banks have sufficient capital to weather a severe economic downturn and pave the way for them to issue share buybacks and pay dividends.
Structurally we are still in fiscal tightening. Although this situation will be very difficult for the crypto sector, we need inflation so that the economy can be back on its feet.
Impact on Crypto
Meanwhile, with crypto that is getting more and more significantly correlated with the equity market, crypto is currently experiencing a bear market. Compounded by the crash of 3AC, Celsius, several things that happened in the crypto industry in recent months created a domino effect, leading to further crashes in the crypto market.
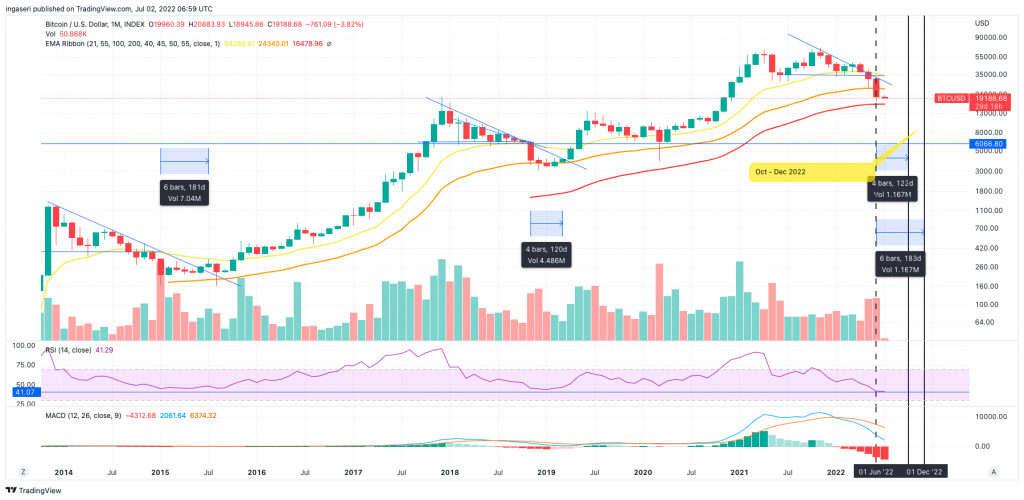
But, Is This the Bottom Yet?
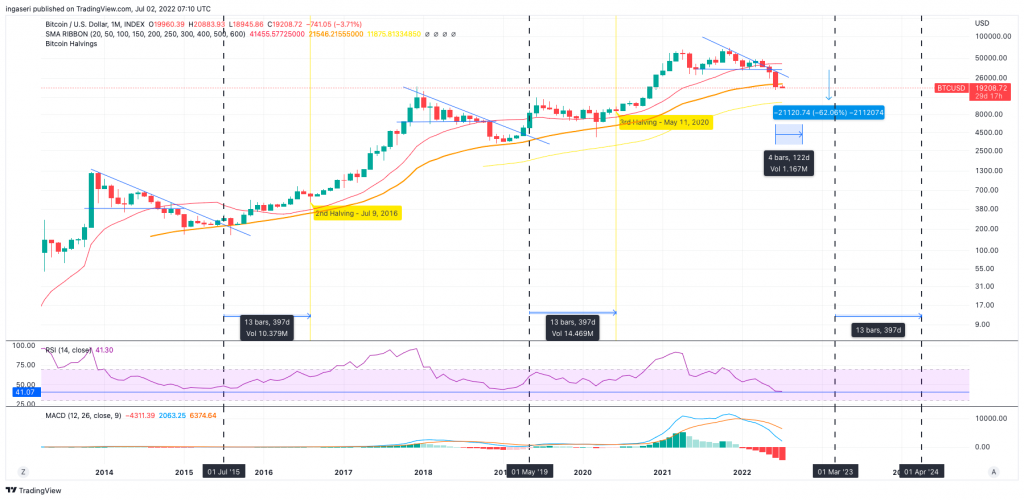
During its lifetime, BTC has experienced 3 descending triangles in each bear cycle. Each time, it broke down to find support at 50 months Moving Average. Each time, We can see that BTC is searching for an absolute bottom. Once that bottom has been reached, the price would then consolidate for as long as it took for a price to recover back above the Macro Downtrend line.
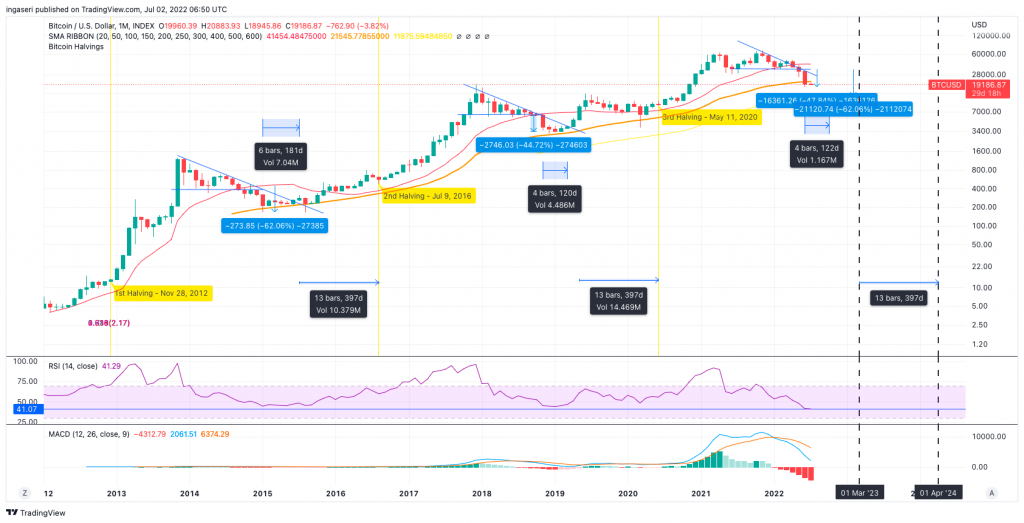
💡 The descending triangle pattern usually forms in a bearish trend where the price continues to decline and forms several lower highs and then falls through the support level at the end of the pattern.
When can we see the end of the bear market?
As mentioned above, BTC will spend some time below the macro trend line before breaking above it, and on the previous 2 occasions, it spent below the line between 120-180 days. So, if we plot through the current bear market, we can see that the most probable answer to this is somewhere between October – December 2022. Why October? Assuming we spend 180 days back in 2014, and 120 days in 2018, we might see this at the earliest at 120 days from June 2022, which is October 2022. If we take the latest at 180 days, it will then be December 2022. So, most likely we would be seeing the end of the bear market between October-Deceember 2022.
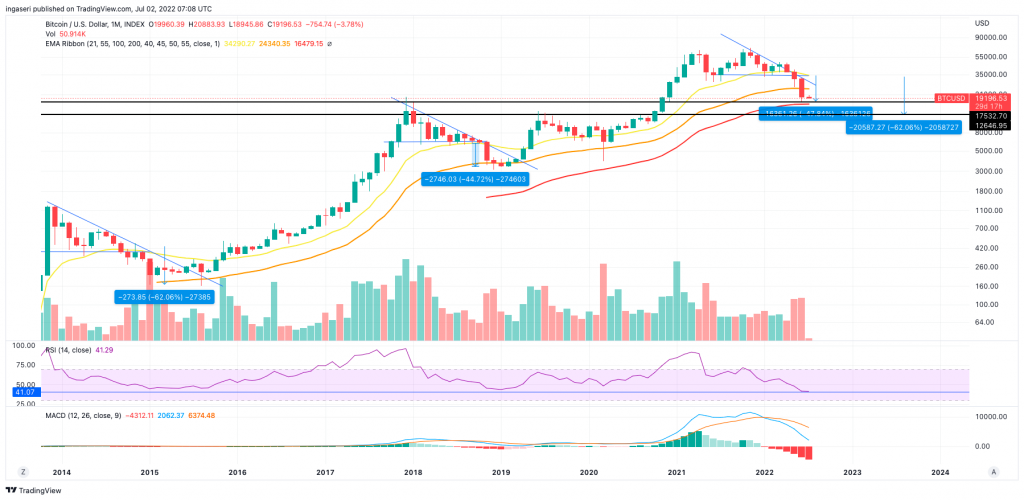
How Much Lower Could the Price Go?
Historically, BTC has retraced -45% to -62% below the Descending Triangle bottom. We have retraced to -47% once to 17k price point (this is in confluence with regards to the BTC log growth curve retracement below the bottom of the channel).
Taking a look at the BTC logarithmic Growth Curve, we can see that during the previous retracement back in May 2020, we experienced a breakdown out of the bottom of the channel. We are also currently losing the bottom of this channel. If we take the same retracement once losing the bottom channel, we will experience about a 49% downside before finding the bottom. Now if we plot this today, the support line will be at 17k. And if we take the uglier retracement, of -62%, we will see a price of roughly $12,700.
So, When Will The Bull Run Start?
BTC tends to breakout beyond the Macro Downtrend 390 days days before BTC’s halving. Assuming BTC’s halving will occur on April 24 – 390 days could mean that BTC could breakout in March 2023 or April 2023.
What is the Best Plan for Crypto Bear Market?
We may have seen the bottom or the lowest price of crypto, or maybe not. However, now is the right time to buy. For medium-term investments, this is the right time to do Dollar Cost Averaging (DCA). You can make purchases at the prices of US$20,000, US$17,000, US$15,000 (Why US$15,000? Because US$15,000 is the retracement of the last cycle in the bitcoin log growth curve), and US$12,000.
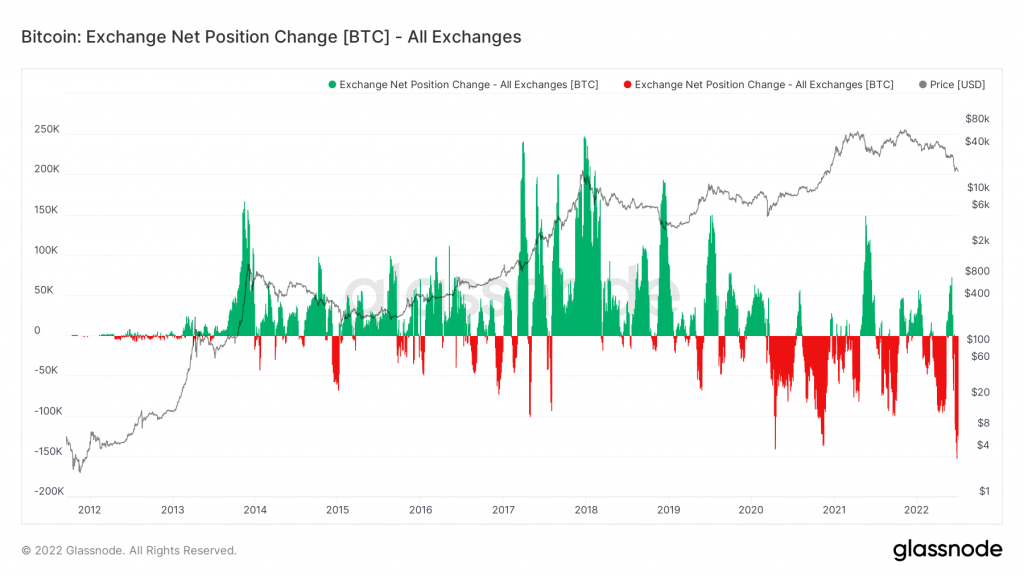
Let’s look at the changing position of Bitcoin on the exchange. What we see in the chart below is surprising: most Bitcoin outflows have been recorded from the exchange since BTC was first launched. The events that happened to 3AC, Celsius, Voyager, and the like have caused market participants to withdraw their Bitcoins from exchanges.
On-chain Analysis
- As the exchange reserve continues to fall, it indicates lower selling pressure. Net deposits on exchanges are high compared to the 7-day average. Higher deposits can be interpreted as higher selling pressure. Miners’ are selling holdings in a moderate range compared to their one-year average. Miner’s revenue is decreasing significantly compared to the cost they put in. This could indicate that the price is undervalued along with the increasing miner’s motive to hold their coins.
- More investors are selling at a loss. In the middle of a bear market, it can indicate a market bottom. Long-term holders’ movement in the last 7 days were lower than the average. They have a motive to hold their coins. Investors are in a capitulation phase where they are currently facing unrealized losses. It indicates the decreasing motive to realize loss which leads to a decrease in sell pressure.
- US investors’ buying pressure is relatively weak in Coinbase. Investors in funds and trusts including Grayscale have relatively weak buying sentiment. The funding rate shows that long position traders are dominant and are willing to pay to short traders. Taker Buy Sell Ratio shows that selling sentiment is dominant in the derivatives market. More sell orders are filled by takers.
- As OI decreases, it indicates investors are closing futures positions, and the possibility of trend reversals. In turn, this might trigger the possibility of a long/short-squeeze caused by sudden price movement or vice versa.
Altcoins News
- 📉 Ethereum Average Gas Fee Drops to $1.57, Lowest Since 2020: For almost two years, between January 2021 and May 2022, the average gas cost required by the Ethereum network was approximately US$40 , with May 1, 2022 recording the highest average daily gas cost of US$196.638. On Saturday 2 July 2022, the average transaction fee on the Ethereum blockchain dropped to 0.0015 ETH or 1.57 US dollars. Citing Cointelegraph, this decline coincided with daily NFT sales which also fell to a one-year low. The NFT ecosystem posted its worst performance this year in June as the total number of daily sales fell to around 19,000 with an estimated value of 13.8 million US dollars.
More Important News from Crypto World in Last Week
- 🏹 3AC Files Bankruptcy: Crypto investment firm Three Arrows Capital, also known as 3AC, filed for bankruptcy on Friday. Citing Bloomberg, the news brought a sad ending for a leading company that managed US$10 billion in assets by March 2022, according to blockchain analytics platform Nansen.
- 🤝 Coinbase Denies Selling Customer Data to US Federal Agencies: Coinbase has denied reports that US Immigration and Customs Enforcement (ICE) uses its “historical geo-tracking data” to track and identify people based on their crypto transaction history. The report, published Thursday by The Intercept, refers to a copy of the August 3, 2021 contract between ICE and Coinbase. On page 19 of the contract, a price list and proposal from Coinbase says that their Analytics web browser tool allows users to track data related to Bitcoin, Bitcoin Cash, Ethereum, Litecoin, Tether, and other cryptocurrencies, including all ERC-20 tokens on the Ethereum network.
Share
Table of contents