Market Analysis Jun 18th, 2024: Bitcoin Faces Resistance at $68,500

The Federal Open Market Committee’s (FOMC) decision to hold interest rates steady sent shockwaves through the crypto market. Bitcoin plummeted to $66K, dashing investor hopes for a rate cut that would have boosted the entire market.
As usual, the Pintu trading team has gathered critical information and analyzed the general economic situation and the crypto market’s movements over the past week. However, it should be noted that all information in this Market Analysis is intended for educational purposes, not as financial advice.
Market Analysis Summary
- ⚠️ Bitcoin (BTC) tested the 55-day Exponential Moving Average (EMA) as support. If it fails to hold above this level, the price could fall to $64,000. Additionally, for a breakout, BTC needs to surpass the resistance at $68,500.
- 📅 Fed officials decided to maintain the current interest rates and forecasted only one rate cut before the end of 2024.
- 📈 In May, the U.S. economy saw an increase of 272,000 jobs, yet the unemployment rate edged up to 4%.
Macroeconomic Analysis
Fed Rate Decision
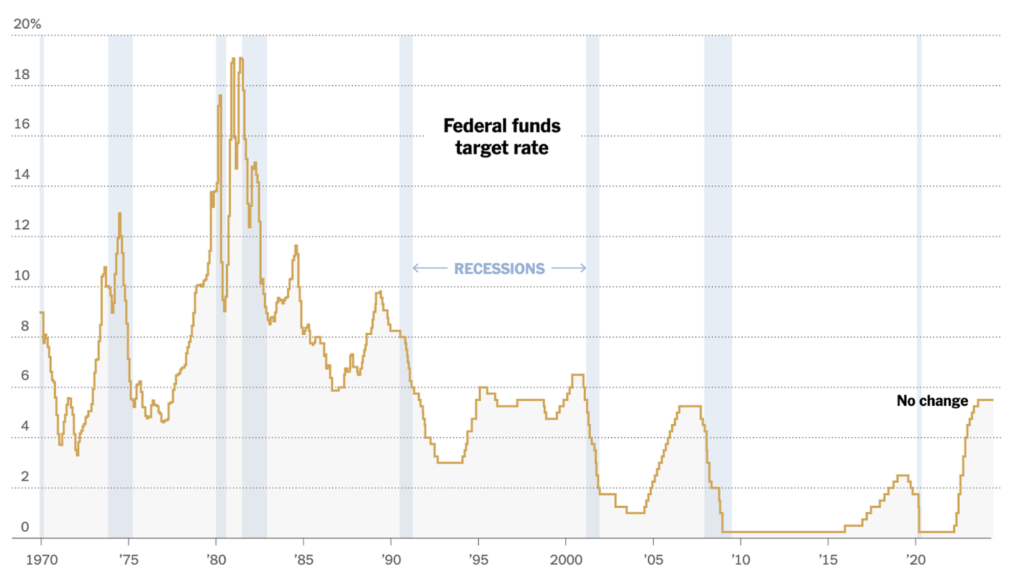
After aggressively raising interest rates from 2022 to July 2023, peaking at a 23-year high of 5.3%, the Fed has adopted a cautious approach in 2024 to address persistent inflation. This is evident in their June meeting decision to maintain current rates. Even a potential rate cut by year-end is expected to be a modest decrease to 5.1%.
The Fed initially anticipated three rate cuts in 2024. However, due to continued price increases at the year’s beginning, they reassessed and postponed the cuts. Chair Jerome Powell emphasized the need for “greater confidence” in inflation returning to the 2% target before lowering rates. This cautious stance is reflected in the Fed’s updated economic projections, which now forecast year-end inflation at 2.6%, slightly higher than previous estimates.
Powell acknowledged the positive developments in recent inflation data and expressed hope for continued favorable readings. Despite a wary economic outlook, the Fed’s projections also highlight some positive aspects, such as the anticipated rate cuts in 2025 and the expectation that growth will hold up even with higher rates this year.
Other Economic Indicators
- Unemployment Rate: In May, the U.S. economy saw an increase of 272,000 jobs, yet the unemployment rate edged up to 4%. This rate, which indicates the proportion of people actively seeking employment, had previously been at 3.9% in April. The slight rise in the unemployment rate could imply a cautious approach from employers regarding new hires. Despite the increase, the current unemployment rate remains below the 10-year monthly median of 4.3%.
- Core Inflation Rate: In May, inflation in the United States eased for the second consecutive month, indicating that the price surge from earlier this year may be tapering off. If this trend continues, it could prompt the Fed to consider lowering its benchmark interest rate from its 23-year high. The core consumer price index (CPI), which excludes volatile food and energy costs, increased by 0.2% from April to May, according to government data released on Wednesday. This is a decrease from the 0.3% rise observed the previous month and represents the smallest monthly increase since October.
- Inflation Rate: The Bureau of Labor Statistics unveiled May’s consumer price index (CPI) data shortly before the Fed’s policy committee was set to announce its decision on short-term interest rates. For the month, the seasonally adjusted inflation rate, as indicated by the CPI, remained flat, while the annual inflation rate dipped slightly to 3.3%. Inflation, which reflects a continuous increase in overall prices, has consistently exceeded the 10-year median of 2.1% for over three years. The Fed aims for an inflation rate of 2%, considering this level “low and stable” to enable Americans to make informed choices about saving, borrowing, and investing.
BTC Price Analysis
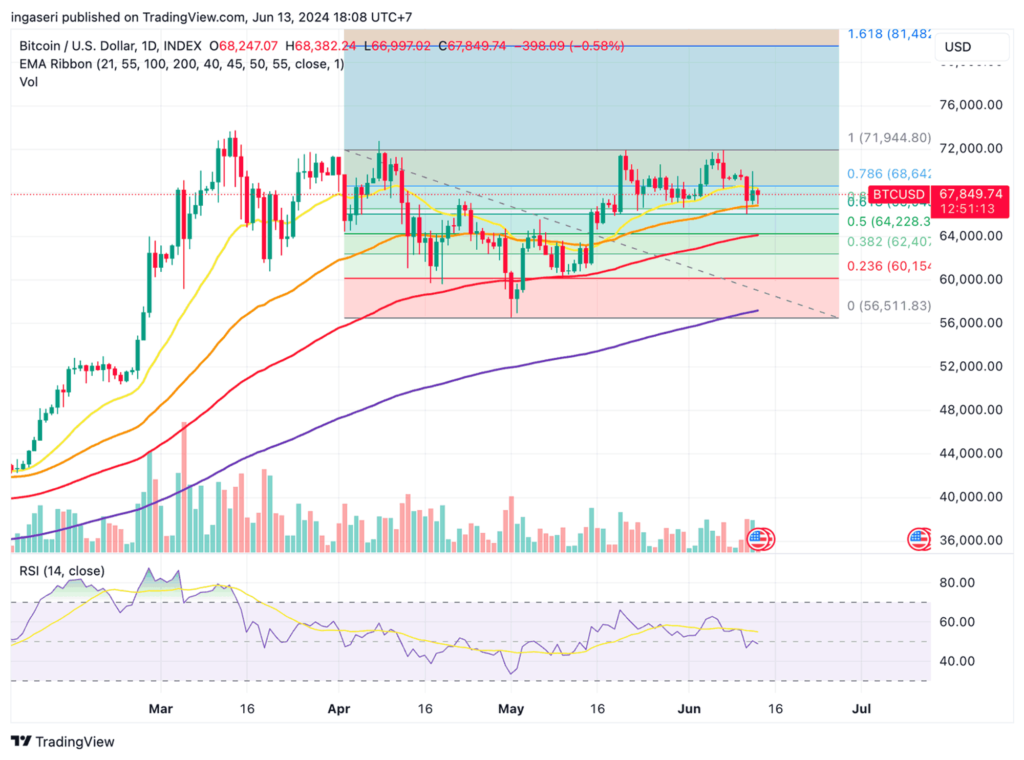
BTC dropped to a multi-week low after the US Fed’s recent policy update. During the Federal Open Market Committee (FOMC) meeting, the Fed maintained its key interest rate but revised its forecast, now anticipating only one rate cut this year instead of the three projected in March.
As a result, Bitcoin fell to its lowest point since May 20, remaining flat over the past 24 hours and trading at $67,566 on Thursday.
The decision to keep interest rates steady might stabilize ETF flows, as investors await more definitive guidance on future Fed policies. Spot BTC ETFs are expected to see consistent inflows, though possibly at a slower pace than if a rate cut had occurred.
In addition, the launch of spot Ether ETFs could draw substantial interest, encouraging more diversified investments across BTC and ETH ETFs. Recent CPI data released on Wednesday briefly pushed BTC above $69,000. However, a subsequent correction brought the price down to around $67,000. Despite this drop, retail traders have maintained net long positions on BTC, anticipating a price rebound.
Currently, BTC is testing its 55-day EMA as a support level. If this support fails, the price could drop further to around $64,000. On the upside, BTC needs to break through the resistance at $68,500 to continue its upward price movement.
On-Chain Analysis
- 📊 Exchange: As the exchange reserve continues to fall, it indicates lower selling pressure. Net deposits on exchanges are high compared to the 7-day average. Higher deposits can be interpreted as higher selling pressure.
- 💻 Miners: Miners’ are selling less holdings compared to its one-year average. Miner’s revenue is in a moderate range, compared to its one-year average.
- 🔗 On-Chain: More investors are selling at a profit. In the middle of a bull market, it can indicate a market top. Long term holders’ movement in the last 7 days was lower than the average. They have a motive to hold their coins. Investors are in a belief phase where they are currently in a state of high unrealized profits.
- 🏦 Derivatives: Long position traders are dominant and are willing to pay to short traders. Buying sentiment is dominant in the derivatives market. More buy orders are filled by takers. As open interest decreases, it indicates investors are closing futures positions and possibility of trend reversals. In turn, this might trigger the possibility of long/short-squeeze caused by sudden price movement or vice versa.
- 🔀 Technicals: RSI indicates a neutral condition. Stochastic indicates a neutral condition where the current price is in a moderate location between the highest-lowest range of the last 2 weeks.
News About Altcoins
- SEC Chairman Gensler hints at possible approval of Spot Ether ETFs by summer. SEC Chairman Gary Gensler suggested to lawmakers that final approvals for the listing and trading of Spot Ether Exchange Traded Funds (ETFs) could come within three months. During a Senate Banking Committee hearing on the SEC’s budget on 13 June, Gensler mentioned that S-1 registration statements for asset managers could be approved “sometime this summer”. Although the SEC has already approved the 19b-4 filings of eight companies, S-1 approvals are required before ETFs can trade on US exchanges. Tennessee Senator Bill Hagerty questioned the delay in full approval of Ether ETFs, but Gensler pointed to the ongoing registration process. While some analysts, such as Bloomberg’s Eric Balchunas, predict that Ether products could be launched by July, final approvals could take a few more weeks.
News from the Crypto World in the Past Week
- AllianceBernstein Bullish on Bitcoin: Predicts $200,000 in a Year. Global investment firm AllianceBernstein expects the Bitcoin price to reach $200,000 in a little over a year, driven by both limited supply and the rise of spot ETFs. AllianceBernstein predicts that Bitcoin spot ETFs will manage $190 billion in assets by the end of 2025, having already raised $53 billion so far. In addition, the firm highlights that MicroStrategy, which owns 214,400 Bitcoin worth about $14.3 billion, recently announced that it will sell more debt to buy Bitcoin. Bernstein also forecasts that Bitcoin could reach $500,000 by the end of 2029 and $1,000,000 by the end of 2033, with “breakout” and “hype” phases anticipated due to accumulated inflows from spot ETFs.
Cryptocurrencies Market Price Over the Past Week
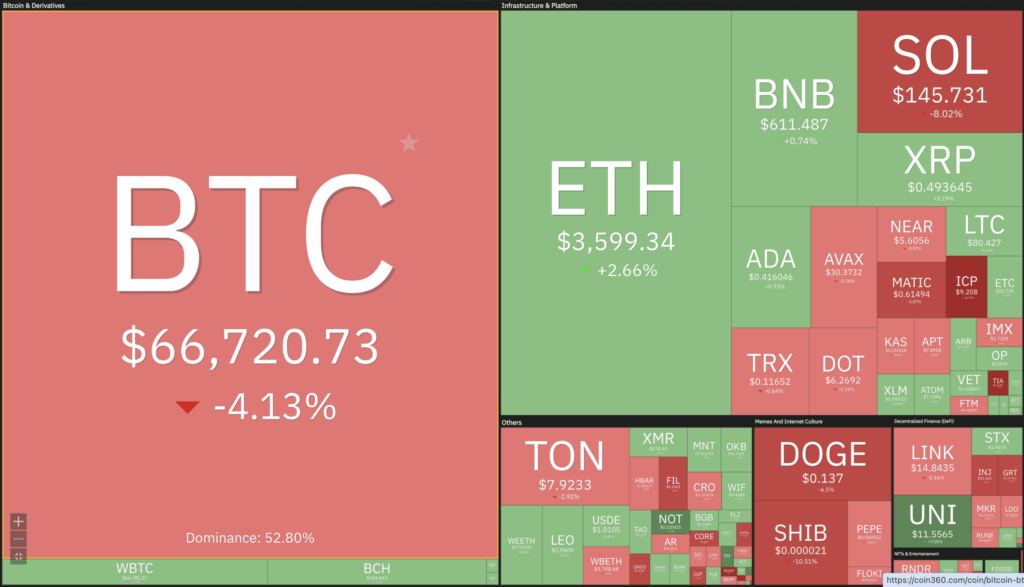
Cryptocurrencies With the Best Performance
- Uniswap +15,31%
- Notcoin (NOT) +14,61%
- Toncoin (TON) +12,60%
- Oasis Network +12,25%
Cryptocurrencies With the Worst Performance
- Wormhole (W) -30,17%
- FLOKI (FLOKI) -27,28%
- Ordinals -23,40%
- Arweave (AR) -22,85%
References
- Turner Wright, SEC chair sees spot Ether ETF S-1 approvals sometime in summer 2024, cointelegrapgh, accessed on 16 June 2024.
- André Beganski, Bitcoin Price Will Hit $200,000 in 2025, MicroStrategy Will Outperform: Bernstein, decrypt, accessed on 16 June 2024.
Share
Related Article


See Assets in This Article
0.9%
2.8%
0.0%
0.0%
0.0%
BTC Price (24 Hours)
Market Capitalization
-
Global Volume (24 Hours)
-
Circulating Supply
-