Market Analysis Jun 23rd, 2025: Iran Threatens to Block Strait of Hormuz. What’s the Impact on Crypto?

Bitcoin is still facing significant downward pressure, driven by the Iran-Israel geopolitical conflict, which shows no signs of de-escalating. The Federal Reserve’s decision to hold interest rates steady has added to this strain, causing BTC to dip below a crucial price point. This decline was particularly sharp following Iran’s declaration of its intent to close the Strait of Hormuz. Read the full analysis from Pintu’s Trader Team in the article below.
Market Analysis Summary
- 🟢 Some forecasts project that BTC could rise to as high as $137,768 by the end of June 2025, with a strong support floor near $105,516.
- 🤔 The Federal Reserve decided on June 18, 2025, to keep the federal funds rate steady at the current target range of 4.25% to 4.5%, maintaining this level since December 2024.
- 💼 The latest data for initial jobless claims in the United States, for the week ending June 14, 2025, showed a decrease of 5,000 claims to a seasonally adjusted total of 245,000.
- 📈 The University of Michigan’s preliminary Consumer Sentiment Index for June 2025 showed a marked improvement, rising to 60.5 from 52.2 in May.
- 📉 U.S. retail sales experienced a notable decline in May 2025, falling by 0.9% month-over-month, which was steeper than the 0.6% drop anticipated by analysts.
Macroeconomic Analysis
FOMC
The Federal Reserve decided on June 18, 2025, to keep the federal funds rate steady at the current target range of 4.25% to 4.5%, maintaining this level since December 2024. This decision came amid mixed economic signals, including slowing growth and persistent inflationary pressures. The Fed emphasized that it will carefully assess incoming data and the evolving economic outlook before making further adjustments. The policy statement highlighted ongoing concerns about inflation remaining somewhat elevated and the economy facing stagflationary risks, with the unemployment rate still low and labor market conditions solid but showing signs of caution.
The FOMC’s “dot plot,” which reflects individual committee members’ projections for the federal funds rate, indicated that two rate cuts remain plausible by the end of 2025, though there is notable divergence among officials. Seven out of 19 members preferred no rate cuts this year, up from four in March, reflecting increased caution. The dot plot suggests the federal funds rate could decline to around 3.4% by 2027, down from current levels, but the path remains uncertain given the complex economic landscape. Fed Chair Jerome Powell cautioned that these projections are subject to significant uncertainty and will be influenced by incoming data, especially regarding inflation and growth.
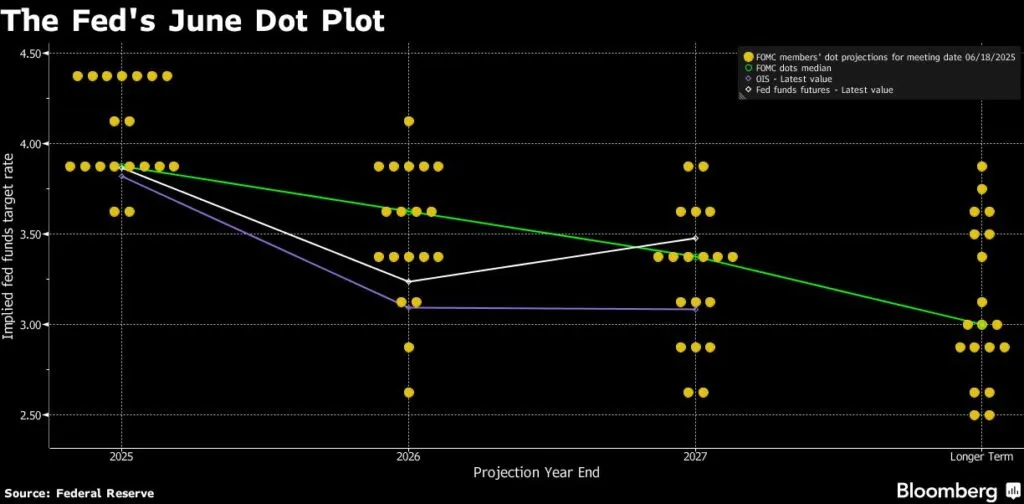
Economic projections released alongside the rate decision forecast subdued growth and persistent inflation challenges. The Fed’s participants expect GDP growth to slow to about 1.4% in 2025, with inflation remaining elevated near 3%, well above the Fed’s 2% target. The committee reaffirmed its commitment to achieving maximum employment and returning inflation to target but acknowledged the elevated uncertainty surrounding the economic outlook, including risks from trade tensions and geopolitical developments. The Fed signaled readiness to adjust policy as needed to support its dual mandate amid these ongoing challenges.
Other Economic Indicators
- Michigan Consumer Sentiment: The University of Michigan’s preliminary Consumer Sentiment Index for June 2025 showed a marked improvement, rising to 60.5 from 52.2 in May—its highest level since February and well above economist forecasts.
- NY Empire State manufacturing: The latest results from the New York Empire State Manufacturing Index for June 2025 indicate a continued downturn in manufacturing activity across New York State. The headline general business conditions index dropped sharply by seven points to -16.0, marking the fourth consecutive month of contraction and the weakest reading since March. This decline was more severe than market expectations, signaling that business conditions have deteriorated further. Both new orders and shipments fell, with the new orders index plunging to -14.2 and shipments hovering around zero, reflecting a broad-based pullback in demand and ouput.
- Retail Sales: U.S. retail sales experienced a notable decline in May 2025, falling by 0.9% month-over-month, which was steeper than the 0.6% drop anticipated by analysts. This marks the sharpest monthly decrease since January and follows a marginal 0.1% dip in April. The downturn was primarily attributed to a significant pullback in motor vehicle purchases, as consumers who had previously accelerated buying to avoid potential tariff-related price increases scaled back their spending. Despite this, retail sales were still up 3.3% compared to May 2024, indicating some resilience in consumer demand on a year-over-year basis.
- Housing Starts & Building Permits: In May 2025, U.S. housing starts fell sharply to a seasonally adjusted annual rate of 1,256,000 units, marking a 9.8% decline from April’s revised figure of 1,392,000. This level is also 4.6% below the May 2024 rate of 1,316,000, representing the lowest housing starts rate since May 2020 and the lowest in five years overall. The decline was driven primarily by a significant drop in multi-unit starts (buildings with five or more units), which fell from 472,000 in April to 316,000 in May
- Jobless Claim: The latest data for initial jobless claims in the United States, for the week ending June 14, 2025, showed a decrease of 5,000 claims to a seasonally adjusted total of 245,000. This figure was in line with economists’ expectations and marked a slight improvement from the previous week’s revised level of 250,000. Despite the decline, the level of initial claims remains elevated compared to earlier in the year, reflecting ongoing labor market softness amid economic uncertainties such as tariffs and geopolitical tensions.
BTC Price Analysis
Over the past week leading up to June 19, 2025, BTC price showed relative stability around the $105,000 mark, demonstrating resilience despite broader market volatility. After dipping to a low near $104,400, BTC bounced back to hold just below $105,000, supported by a key short-term demand zone visible on both 4-hour and daily charts. However, attempts to break above the $107,000 resistance level were consistently rejected by sellers, indicating strong downward pressure at that level and forming a symmetrical triangle pattern that suggests consolidation and indecision among traders.
Technical Analysis
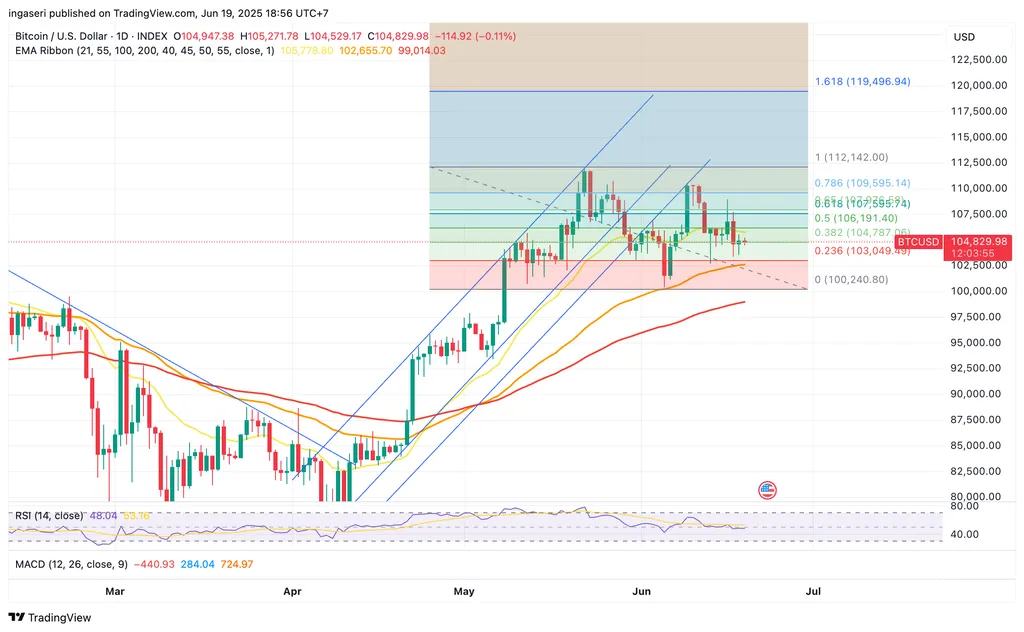
Technically, momentum indicators have been mixed. The MACD on the 30-minute chart turned downward after a brief bullish run, signaling waning upward momentum. The RSI also reflected a lack of strong directional bias, reinforcing the notion that the battle between bulls and bears remains unresolved. This technical setup, combined with the price action capped near the 50-day exponential moving average (EMA) around $107,000, suggests that BTC is currently in a consolidation phase with limited upward breakout potential in the immediate term.
Looking ahead, analysts remain cautiously optimistic about BTC’s medium-term prospects. Some forecasts project that BTC could rise to as high as $137,768 by the end of June 2025, with a strong support floor near $105,516. Meanwhile, others anticipate a trading range between $100,000 and $120,000 for the month, with a possible summer peak around $120,000 to $125,000 if BTC maintains support near current levels. Overall, while short-term price action shows consolidation and some selling pressure, the outlook remains positive for a potential rally later in the summer if key support holds.
Traders’ concerns have been growing due to the escalating Iran-Israel conflict, with Iran submitting a resolution to close the Strait of Hormuz a critical global trade route, especially for oil. As a result, BTC dropped to $98,615 on June 22. However, by June 23, BTC had rebounded back to its key psychological level of $100,000.
Altcoin Analysis
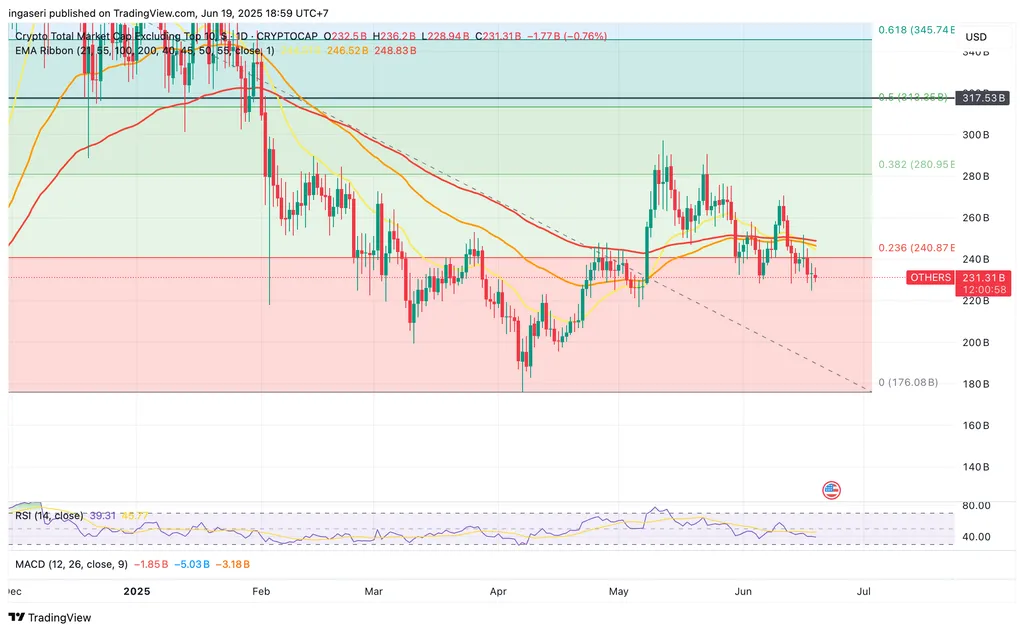
Over the past week, the broader crypto market excluding BTC showed mixed but generally cautious price action, reflecting a market still digesting recent gains and awaiting clearer directional cues. ETH, the largest altcoin by market cap, hovered just below the $2,500 level, consolidating near its 50-day average price of about $2,513. Technical indicators suggest a crucial support zone around $2,440, with potential upside toward $2,547 if bullish momentum resumes. Ethereum’s recent upgrades and scaling plans have kept investor interest elevated, contributing to a structurally positive outlook despite short-term sideways movement.
Other major altcoins like SOL and NEAR experienced modest pullbacks amid the broader market consolidation. Solana, trading near $150–$160, remains technically poised for a potential breakout, supported by recent network integrations and institutional interest. NEAR, meanwhile, traded around $2.16, slightly down from recent highs but maintaining support above $2.15. Smaller-cap altcoins such as RUNE also saw slight declines, with RUNE trading near $1.42, below its 50- and 200-day averages, indicating some continued selling pressure in mid-tier tokens.
Overall, the altcoin market is showing signs of a slow but steady buildup toward a possible “altseason” later this summer, driven by renewed institutional interest, upcoming network upgrades, and ETF-related optimism. While short-term volatility and profit-taking remain risks, many analysts highlight Ethereum, Solana, and BTC Cash as key tokens with strong breakout potential in June 2025. The market’s cautious stance is reflected in neutral sentiment indicators, with price drops often viewed as buying opportunities rather than red flags, suggesting investor confidence in a medium-term bullish trend for altcoins beyond BTC.
On-Chain Analysis
News About Altcoins
- Wall Street Analysts Predict Near-Certain Approval of Solana, XRP, and Litecoin Spot ETFs by End of 2025. Top Wall Street analysts Eric Balchunas and James Seyffart forecast near-100% chances that several altcoin spot ETFs—starting with Solana, XRP, and Litecoin—will be approved by the SEC by the end of 2025, with Dogecoin, Cardano, Polkadot, Hedera, and Avalanche following closely behind. These approvals, driven by rising demand and the precedent set by Bitcoin and Ethereum ETFs, would mark a historic milestone for crypto on Wall Street. Major institutions like BlackRock and Fidelity are actively pursuing listings, while updated filings even include staking features for Solana. Analysts believe the question is no longer if but when, and that such ETFs could act as significant price catalysts—particularly for leading altcoins like Solana.
News from the Crypto World in the Past Week
- Texas Becomes First State With Publicly-Funded Bitcoin Reserve. Texas has officially become the third U.S. state to establish a strategic Bitcoin reserve—and the first to fund it publicly—after Governor Greg Abbott signed SB 21 into law. The fund, managed independently by the Texas Comptroller, is designed to invest in Bitcoin as a strategic asset, with protections in place via HB 4488 to keep it separate from general state revenue. While initial investments may only be in the tens of millions, this move signals growing institutional interest in crypto at the state level.
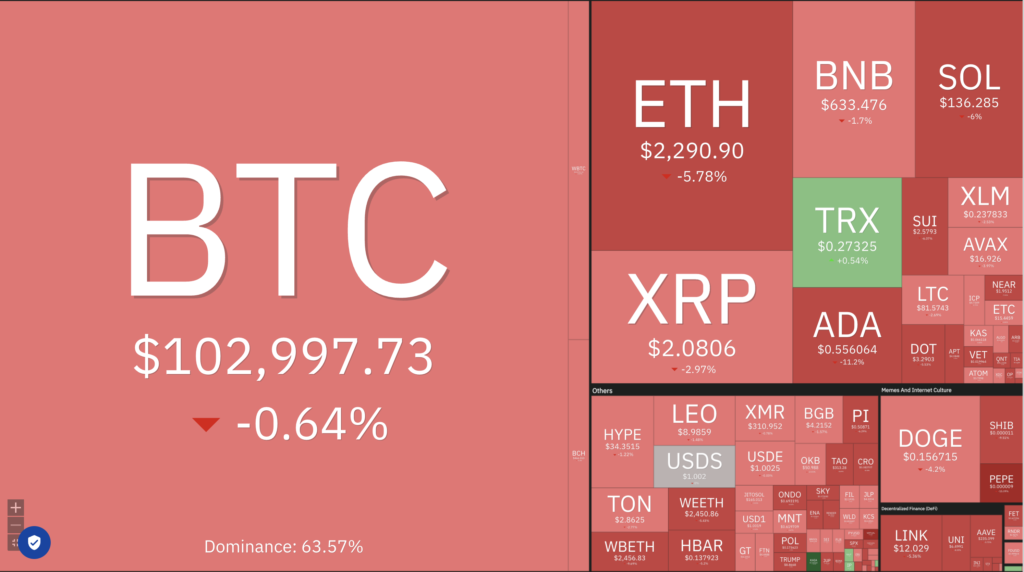
Cryptocurrencies Market Price Over the Past Week
Cryptocurrencies With the Best Performance
- Sei +18.33%
- Bitcoin Cash +6.09%
- Aerodrome Finance +5.59%
- Jito +4.49%
Cryptocurrencies With the Worst Performance
- SPX6900 (SPX) -29.91%
- Fartcoin (FARTCOIN) -26.87%
- Story (IP) -23.53%
- Virtuals Protocol (VIRTUAL) -23.10%
References
- Sander Lutz, Solana, XRP and Dogecoin ETF Approvals in 2025 Are a Near Lock, Analysts Say, decrypt, accessed on 22 June 2025.
- Zack Abrams, Texas Governor Greg Abbott signs strategic Bitcoin reserve bill into law, theblock, accessed on 22 June 2025.
Share
Related Article


See Assets in This Article
BTC Price (24 Hours)
Market Capitalization
-
Global Volume (24 Hours)
-
Circulating Supply
-