Market Analysis Mar 12th, 2024: BTC Reaches $72,700 – What’s Next?

Following last week’s market analysis, which explained the potential for Bitcoin to reach $70,000, Bitcoin (BTC) finally surpassed this price level on Monday (11/3), reaching an all-time high of $72,700. Will BTC continue to set new all-time highs (ATH) in 2024? Check out the analysis below
As usual, the Pintu trading team has gathered critical information and analyzed the general economic situation and the crypto market’s movements over the past week. However, it should be noted that all information in this Market Analysis is intended for educational purposes, not as financial advice.
Market Analysis Summary
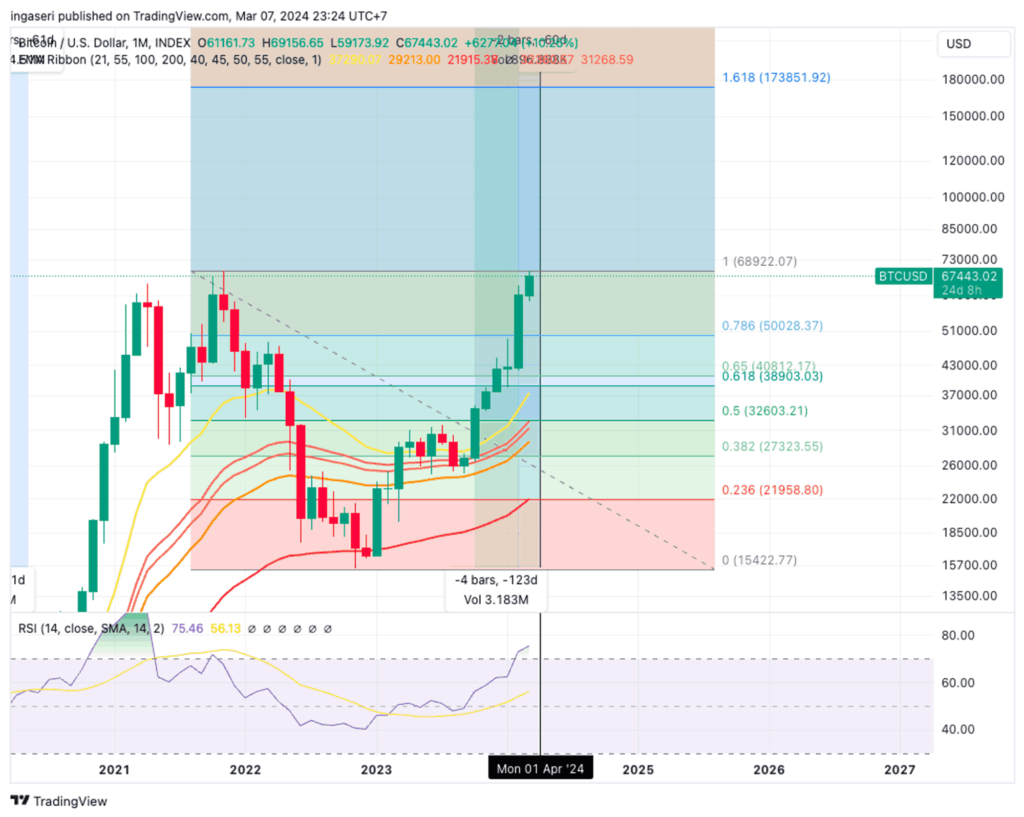
- 🆕 BTC has broken through the 100% Fibonacci retracement resistance line and is currently entering a new exploration of a new price range, a region first explored by Bitcoin.
- 💼 S&P Global U.S. Services PMI recorded a final reading of 52.3% in February.
- 👥 February witnessed the addition of 140,000 nonfarm private jobs. The US Bureau of Labor Statistics (BLS) revealed that on the final business day of January, the count of job openings was 8.86 million.
- 🟢 The University of Michigan’s consumer sentiment survey recorded a reading of 76.9 in February.
Macroeconomic Analysis
S&P Global Manufacturing Index
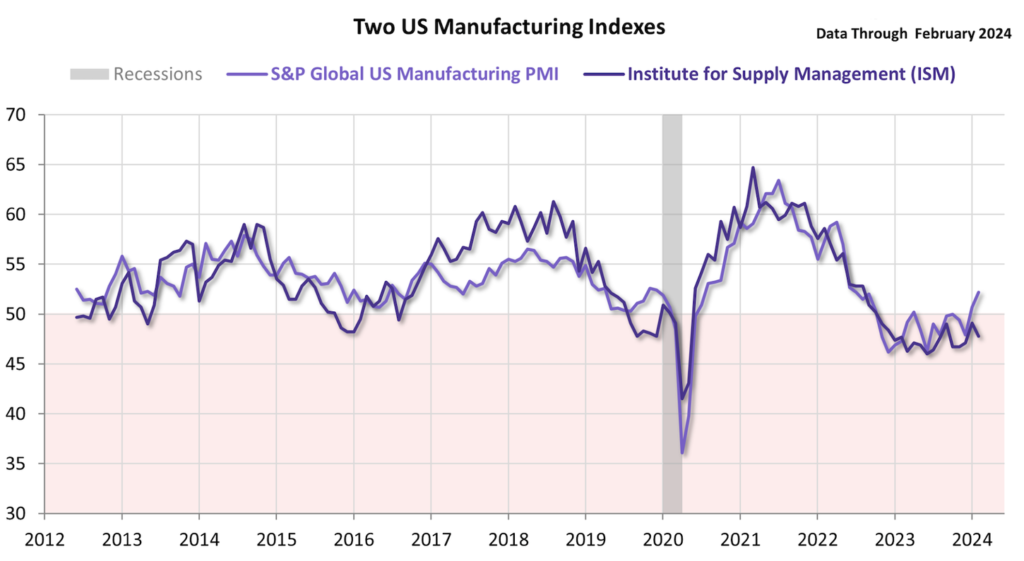
February’s S&P Global US Manufacturing PMI showed significant improvement in the US manufacturing sector. The index rose to 52.2, exceeding expectations and marking the fastest pace of growth since July 2022. This growth was driven by a surge in new orders and production with both domestic and international demand strengthening. Manufacturers also increased hiring at the fastest rate since September 2023.
Despite some challenges, the cost side showed positive signs. Improved supplier performance and greater availability of raw materials led to slower input price increases. However, manufacturers passed on rising costs by continuing to raise their selling prices. This increase was the most pronounced since April 2023.
Other Economic Indicators
- ISM Manufacturing Index: The Institute for Supply Management (ISM) Manufacturing Index for February came in lower than expected, dropping to 47.8 compared to a predicted level of 49.5. Despite this decline, there were some positive signs. Eight industries reported growth in February, up from just four in January. However, new orders continued to contract, with the sub-index falling to 49.2. However, there was a bright spot as new export orders surged by 6.4 percentage points to 51.6. Unfortunately, the employment picture remained bleak. The employment index dipped to 45.9, marking its fifth consecutive month of contraction.
- Michigan Consumer Sentiment: According to the University of Michigan consumer sentiment survey, U.S. consumer sentiment declined in February. The index reading dropped to 76.9 from 79 in January, reversing a three-month trend of increasing optimism. This decline is likely due to unexpectedly high inflation in January (3.1% year-over-year, a 0.3% increase from December). Consumers now expect inflation to rise to 3% per year, up from the previous expectation of 2.9%. The Federal Reserve also dashed hopes for a rate cut in March due to ongoing inflation concerns.
- Service PMI: On Tuesday, the Institute for Supply Management (ISM) and S&P Global released reports on the US services sector PMI for February, painting a mixed picture. The ISM index dipped to 52.6% from 53.4% in January, exceeding economist expectations of a modest decline to 53.1%. Despite the drop, the sector remains in expansion territory, staying above 50% since December 2022. Meanwhile, the S&P Global U.S. Services PMI showed a slight uptick in February, with a final reading of 52.3% (up from an initial estimate of 51.3%). This is slightly below January’s 52.5%, suggesting stable but cautious growth in the service sector.
- ADP Employment: The ADP employment report, a leading indicator of the U.S. Bureau of Labor Statistics employment report, showed that the U.S. economy added 140,000 private non-farm jobs in February. This number is an increase from January’s figure but still below expectations. The U.S. Bureau of Labor Statistics is expected to report a slightly higher new non-farm payroll number of about 150,000, with the overall estimate for all non-farm jobs reaching 190,000.
- JOLTS Job Opening: The US Bureau of Labor Statistics (BLS) revealed that on the final business day of January, the count of job openings was 8.86 million, as reported in the Job Openings and Labor Turnover Survey (JOLTS) on Wednesday. This figure was slightly lower than the revised December number of 8.88 million (originally reported as 9.02 million) and fell just short of the market’s anticipated 8.9 million.
- Initial Jobless Claim: The number of new unemployment claims in the U.S. for the week ending on March 2 was 217,000, slightly higher than expected but unchanged from the previous week. This indicates a steady pace of layoffs. The unemployment rate remains low at 1.3%, and the four-week average of claims has also decreased slightly. However, there was a slight increase in the number of people receiving unemployment benefits.
BTC Price Analysis
Bitcoin has marked a noteworthy accomplishment by attaining its record-breaking peak of $69,000 after a span of 28 months, signaling a considerable upswing in confidence within the cryptocurrency market. Nevertheless, this milestone is coupled with anticipations of increased volatility in the medium term, potentially resulting in the liquidation of numerous positions in the futures market.
BTC experienced a decline of over 10% from its recent peak, BTC faced substantial selling pressure on crypto exchanges, preventing the price from extending beyond $69,000 and causing it to drop below $60,000 at one juncture.
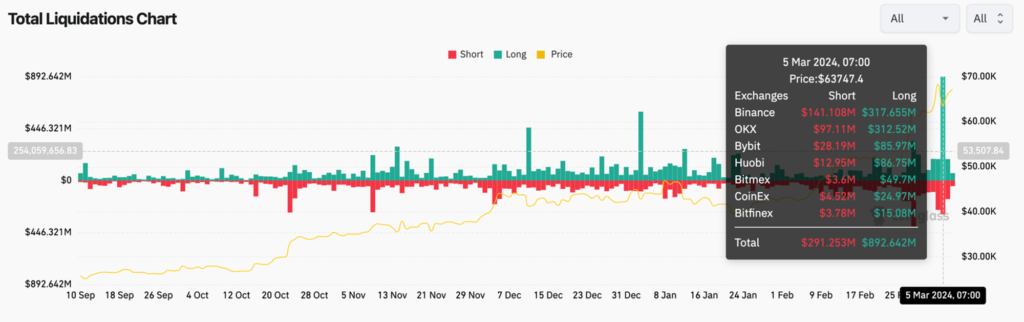
What we experienced on Tuesday night was a cascading liquidation of more than $1.1 billion in derivatives trading positions across all digital assets in the last 24 hours. Of these liquidated positions, approximately $870 million were long positions, representing wagers on the upward movement of asset prices, according to CoinGlass.
Breaking the 70K mark
BTC has broken through the 100% Fibonacci retracement resistance line and is currently entering a new exploration of a new price range, a region first explored by Bitcoin. By setting a new all-time high, this rally makes BTC’s market cap the largest asset by a quarter of a trillion in the world with a market cap of $1.4 trillion, overtaking silver’s market cap of $1.3 trillion.
On-Chain Analysis
- 📊 Exchange: As the exchange reserve continues to fall, it indicates lower selling pressure. Net deposits on exchanges are high compared to the 7-day average. Higher deposits can be interpreted as higher selling pressure.
- 💻 Miners: Miners’ are selling holdings in a moderate range compared to their one-year average. Miner’s revenue is in a moderate range, compared to its one-year average.
- 🔗 On-Chain: More investors are selling at a profit. In the middle of a bull market, it can indicate a market top. Long-term holders’ movement in the last 7days was higher than the average. If they were moved for selling, it may have a negative impact. Investors are in a belief phase where they are currently in a state of high unrealized profits.
- 🏦 Derivatives: Long-position traders are dominant and are willing to pay short traders. Buying sentiment is dominant in the derivatives market. More buy orders are filled by takers. As open interest increases, it indicates more liquidity, volatility, and attention are coming into the derivative market. The increasing trend in open interest could support the current ongoing price trend.
- 🔀 Technicals: RSI indicates an overbought condition where 77.00% of price movement in the last 2 weeks have been up and a trend reversal can occur. Stochastic indicates an oversold condition where the current price is close to its high in the last 2 weeks and a trend reversal can occur.
News About Altcoins
- PEPE Leads Meme Coin Rally Up Over 100% In A Week. Meme coins such as Pepecoin (PEPE), Shiba Inu (SHIB), and Dogecoin (DOGE) have experienced a surge, with PEPE leading the way with a 26% jump as ETH approaches the $4,000 mark, reflecting crypto market optimism. This trend highlights a strategic move by traders to capitalize on bullish conditions, despite warnings from industry experts about a potential shift back to altcoins with stronger fundamentals. The growing interest in Ethereum driven by the anticipation of a US ETF and higher demand from US investors, indicates a positive outlook for the digital asset landscape.
News from the Crypto World in the Past Week
- Ether ETF Discussions Continue, Grayscale and Coinbase Discussions with SEC. Grayscale and Coinbase recently engaged in discussions with the US Securities and Exchange Commission (SEC) to advance efforts to launch a spot ether ETF aimed at addressing regulatory concerns over investor safety. The move is Grayscale’s strategy to convert the Ethereum Trust into an ETF, potentially expanding investor access to the crypto asset. This discussion follows the SEC’s approval of a bitcoin spot ETF, which has boosted the crypto market significantly, with bitcoin and ether reaching new highs. The firms’ push for an ether ETF underscores the growing interest in making cryptocurrency investments more accessible and regulated.
Cryptocurrencies Market Price Over the Past Week
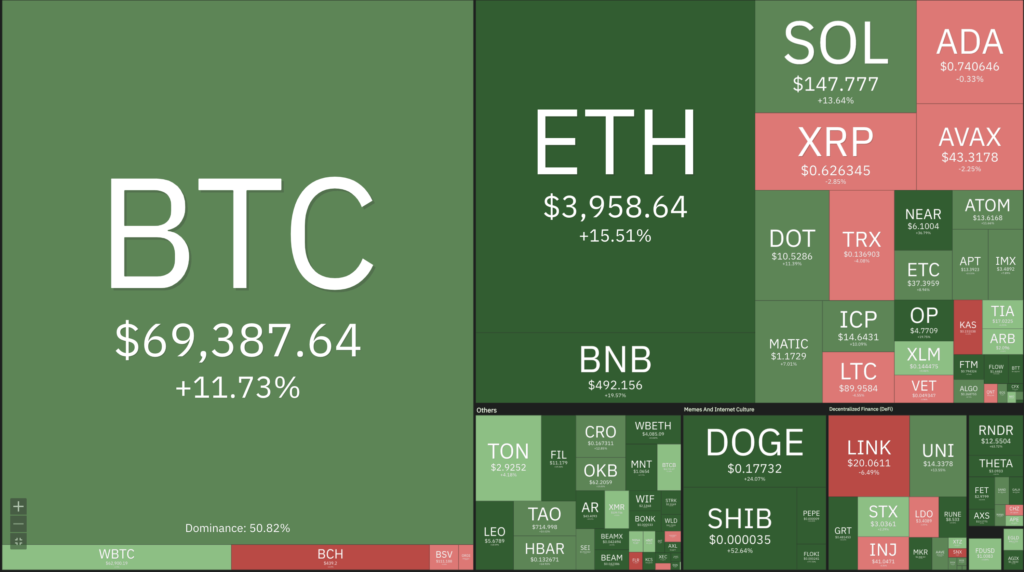
Cryptocurrencies With the Best Performance
- Pepe (PEPE) +110%
- Floki (FLOKI) +74%
- Fetch.ai (FET) +64%
- Render (RNDR) +62%
Cryptocurrencies With the Worst Performance
- Bitcoin Cash -14%
- Kaspa -10%
- Synthetix -6%
- Chainlink -6%
References
- Elizabeth Napolitano, Grayscale, Coinbase meet with SEC about spot ether ETFs, theblock, accessed on 10 March 2024.
- Shaurya Malwa, PEPE Leads Meme Coin Rally as Ether Nears $4K, Coindesk, accessed on 10 March 2024.
Share
Related Article


See Assets in This Article
Bitcoin Price (24 Hours)
Market Capitalization
-
Global Volume (24 Hours)
-
Circulating Supply
-