Market Analysis Mar 4th, 2024: BTC Poised for Potential Rally to $70k

Bitcoin’s price has caused a stir in the first quarter of 2024, reaching $64,000 and even hitting an all-time high in Indonesian Rupiah, exceeding Rp1 billion. This strong market performance suggests the potential for further price increases. Check out the analysis below.
As usual, the Pintu trading team has gathered critical information and analyzed the general economic situation and the crypto market’s movements over the past week. However, it should be noted that all information in this Market Analysis is intended for educational purposes, not as financial advice.
Market Analysis Summary
- 💪🏻 The market shows strong fundamentals and technical levels, signaling a potential sustained rally for BTC towards all-time highs near $70,000.
- 🏡 According to the Commerce Department’s Census Bureau, new home sales saw a 1.5% uptick, reaching a seasonally adjusted annual rate of 661,000 units last month.
- 🟢 Although economic activity in the US experienced a significant decline of 6.1%, economists predict there will be no recession in 2024.
- 💼 According to the Department of Labor, jobless claims rose by 13,000 to reach 215,000. The four-week moving average, standing at 212,500, exhibited a decrease of 3,000 from the previous week.
Macroeconomic Analysis
New Home Sales
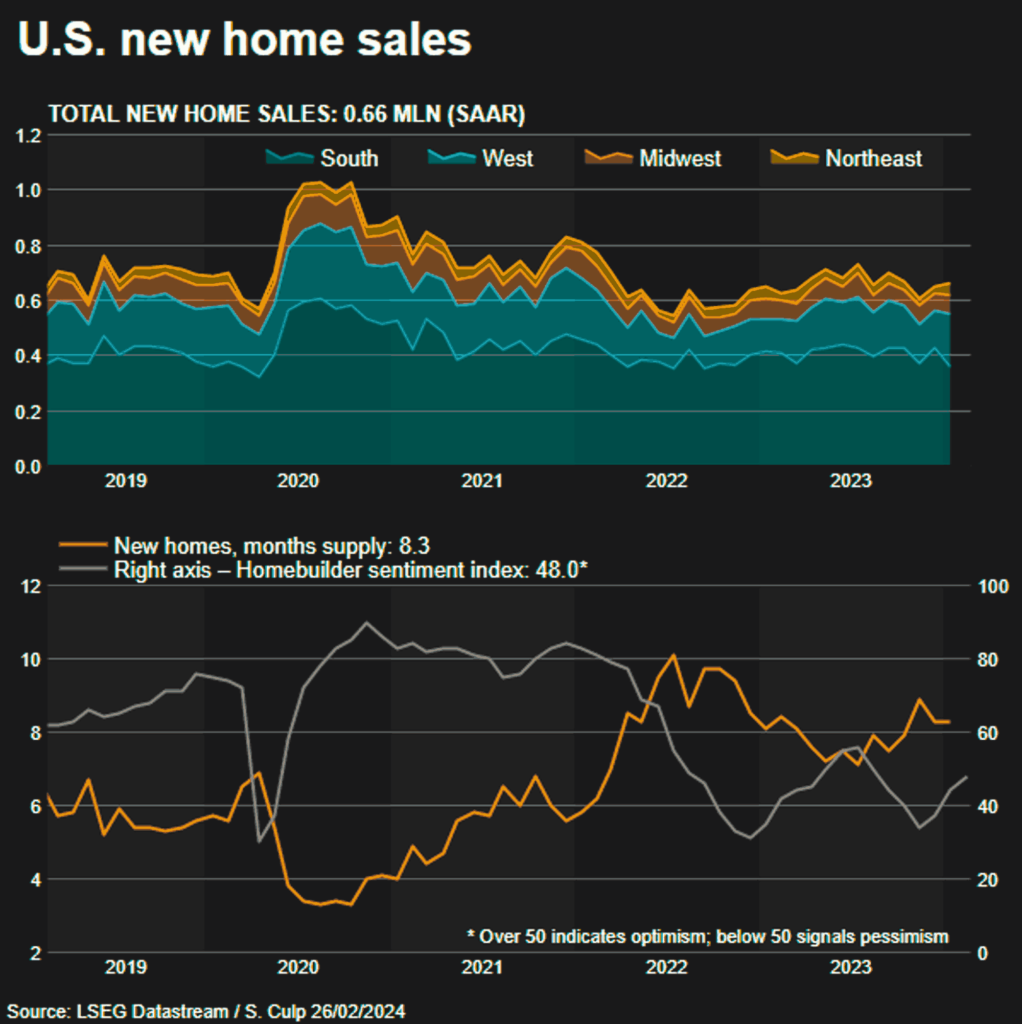
New home sales in the United States (US) in January 2024 edged up 1.5% to a seasonally adjusted annual rate of 661,000 units. This increase occurred despite a downward revision of December’s sales figure from 664,000 to 651,000 units. While the national trend showed a moderate increase, regional performance varied considerably. The Northeast and West regions experienced significant sales surges (72.0% and 38.7%, respectively), while the Midwest saw a more modest increase (7.7%). Notably, the densely populated South experienced a concerning 15.6% decline, reaching its lowest point since September 2022. Despite this mixed picture and potential moderation due to rising mortgage rates and the Federal Reserve’s delayed rate cut, the National Homebuilders Association survey suggests positive expectations for sales and buyer activity in the coming months.
Other Economic Indicators
- Durable Goods Orders: The U.S. economy experienced a significant downturn, with durable goods orders plummeting 6.1% – the steepest decline since April 2020. This drop, primarily driven by a sharp decline in commercial aircraft orders, aligns with a broader trend of weakening economic data, including retail sales, housing starts, and manufacturing production. While high-freezing temperatures in January and challenges with seasonal adjustments may have contributed, other factors are likely at play. Additionally, consumer confidence, which had risen for three consecutive months, dipped in February. Concerns about the economic outlook, the labor market, and the upcoming presidential election likely influenced this decline, even as inflation expectations reached their lowest point in nearly four years. Despite these setbacks, economists are not currently forecasting a recession for 2024.
- GDP Growth Rate: The U.S. Commerce Department revised U.S. GDP growth for the fourth quarter of 2023 downward slightly to 3.2%. Despite this revision, the underlying strength of the economy was reaffirmed, with the outlook remaining positive. This revision stemmed from adjustments in inventory investment but was partially offset by increases in consumer spending, residential investment, and business investment. These data points reveal the economy’s resilience in the face of challenges, including the Federal Reserve’s aggressive interest rate hikes intended to combat inflation. A robust labor market with high wages and healthy consumer spending further bolstered momentum, helping the economy avoid a recession.
- Jobless Claims: U.S. jobless claims for the week ending February 24 unexpectedly rose by 13,000 to 215,000, exceeding analysts’ predictions of 210,000. Despite this increase, the four-week moving average fell slightly to 212,500. Meanwhile, continuing claims surged by 45,000 to 1.91 million, surpassing the estimate of 1.88 million and marking the highest level for the four-week moving average since December 11, 2021. These developments come as investors and analysts await the February jobs report, which is expected to show a slight improvement in the unemployment rate to 3.6% from 3.7% and a decrease in nonfarm payroll additions to 202,500 compared to January’s 353,000, offering insights into the dynamics of the still-robust labor market.
- Personal Income & Spending: According to a release from the Bureau of Economic Analysis on Thursday, personal consumption expenditures (PCE) in the United States increased by 0.2% in January compared to the previous month. This moderate growth aligns with analysts’ expectations. Additionally, personal income witnessed a more substantial month-on-month increase of 1%.
- PCE Index: In terms of inflation metrics, the PCE Price Index registered a 0.3% uptick in January compared to December, indicating a gradual escalation in prices. The core PCE Price Index, excluding the volatile categories of food and energy, experienced a higher monthly increase of 0.4%. On a year-over-year basis, the core index recorded a 2.8% rise.
BTC Price Analysis
Wednesday witnessed a surprising surge in Bitcoin’s value, climbing from a low of $56,738 to $63,913. This unexpected move triggered widespread price gains in altcoins, with ETH taking the lead and reaching $3,500. The market exhibits robust fundamentals and strong technical levels, signaling a potential sustained rally towards the all-time high, approaching $70,000. Furthermore, there is optimism about Bitcoin’s eventual ascent beyond the $70,000 mark.
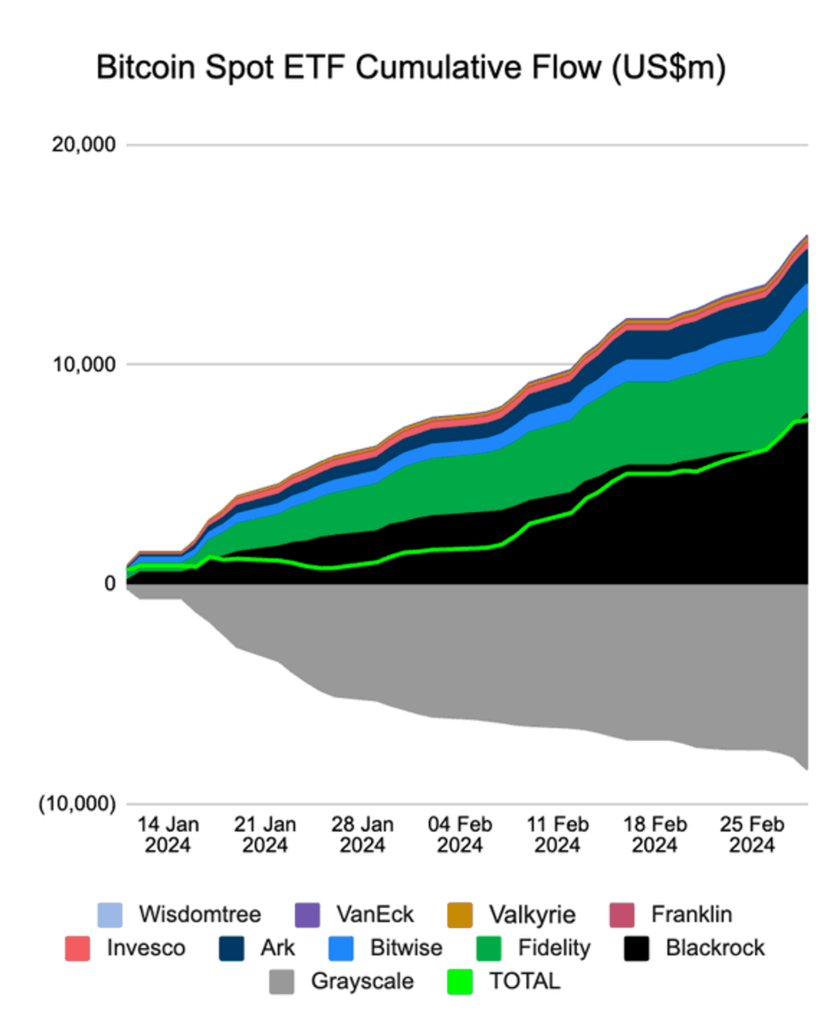
Several factors are propelling BTC on its unyielding upward trajectory. The introduction of spot Bitcoin ETFs in January has significantly altered the crypto landscape, impacting not only Bitcoin but also major altcoins like ETH and Solana .
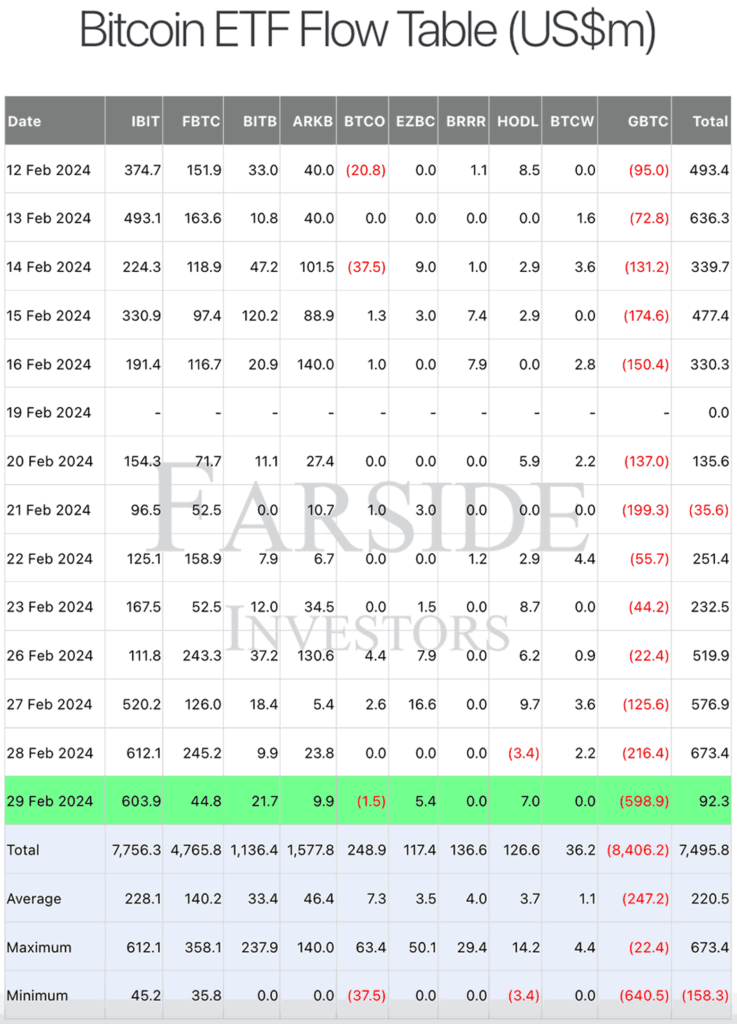
The BTC ETF flow indicated a substantial bullish trend, with the total net inflow reaching $673 million on February 28.
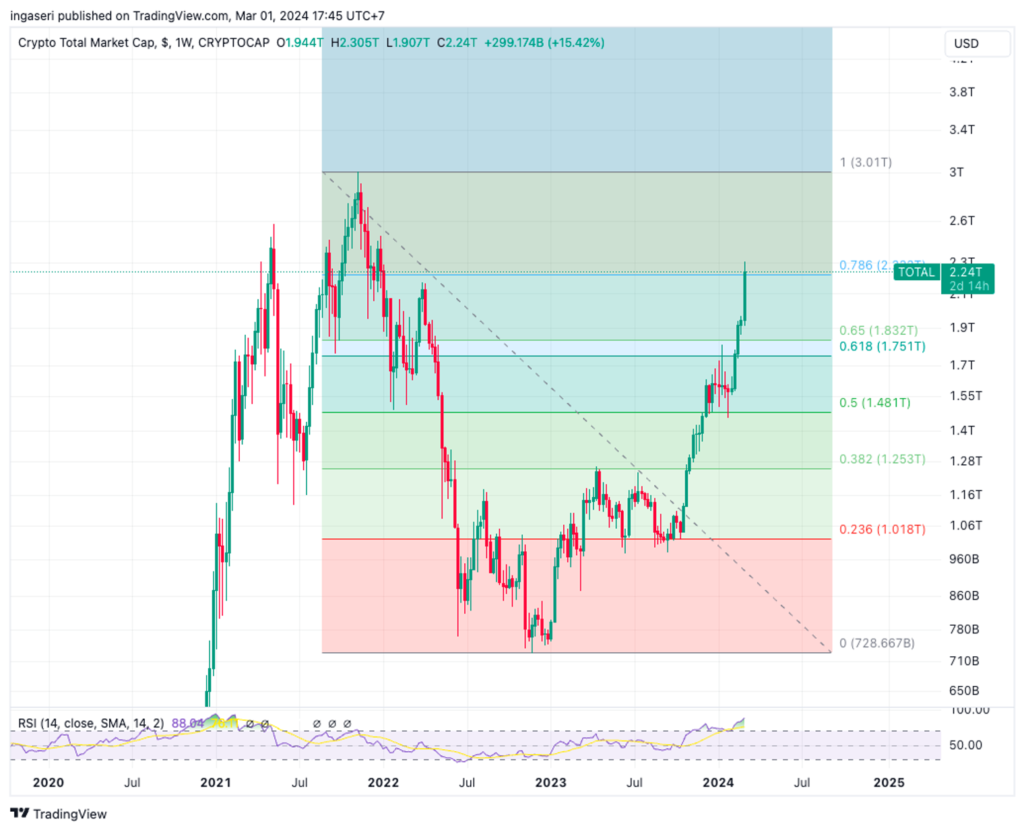
Total Crypto Market
The overall cryptocurrency market achieved a record high of $2.3 trillion before retracing to the $2.24 trillion level.
On-Chain Analysis
- 📊 Exchange: As the exchange reserve continues to fall, it indicates lower selling pressure. Net deposits on exchanges are high compared to the 7-day average. Higher deposits can be interpreted as higher selling pressure.
- 💻 Miners: Miners’ are selling holdings in a moderate range compared to their one-year average. Miner’s revenue is in a moderate range, compared to its one-year average.
- 🔗 On-Chain: More investors are selling at a profit. In the middle of a bull market, it can indicate a market top. Long-term holders’ movements in the last week were higher than the average. If they were moved for selling, it may have a negative impact. Investors are in a belief phase where they are currently in a state of high unrealized profits.
- 🏦 Derivatives: Long-position traders are dominant and are willing to pay short traders. Selling sentiment is dominant in the derivatives market. More sell orders are filled by takers. As open interest increases, it indicates more liquidity, volatility, and attention are coming into the derivative market. The increasing trend in OI could support the current ongoing price trend.
- 🔀 Technicals: RSI indicates an overbought condition where 83.00% of price movement in the last 2 weeks has been up and a trend reversal can occur. Stochastic indicates a neutral condition where the current price is in a moderate location between the highest-lowest range of the last 2 weeks.
News About Altcoins
- Analysts Predict Altcoin Season Coming Soon Amid Meme Token Rally. Analysts foresee a potential “altcoin season,” where alternative cryptocurrencies outperform Bitcoin, following the recent surge in meme coins like DOGE, SHIB, BONK, PEPE, and dogwifhat (WIF). This speculation arises as Bitcoin nears its all-time highs, having gained 48% year-to-date, while the broader altcoin market has lagged. Analysts from K33 Research and Swissblock point to Ether (ETH) breaking above $3,500 as a potential confirmation of the altcoin season’s start. The recent rally in dog-themed meme coins, up 40%-100%, is seen as an early indicator of this trend. However, analysts caution against attempting to time the market, highlighting the added risk factors of Bitcoin ETFs and emphasizing that a broader wave of retail investment in altcoins is necessary for a substantial market uptick.
News from the Crypto World in the Past Week
- Grayscale warns of several factors that could impact Bitcoin’s valuation. The first factor is that US debt is increasing by about $100 trillion per 100 days. Then high inflation and interest rate delays could hamper the rise in crypto valuations. Although Bitcoin price performed very well in February, Grayscale advises investors to monitor the upcoming inflation report as well as the Fed’s meeting in March which may affect the future valuation of crypto assets.
Cryptocurrencies Market Price Over the Past Week
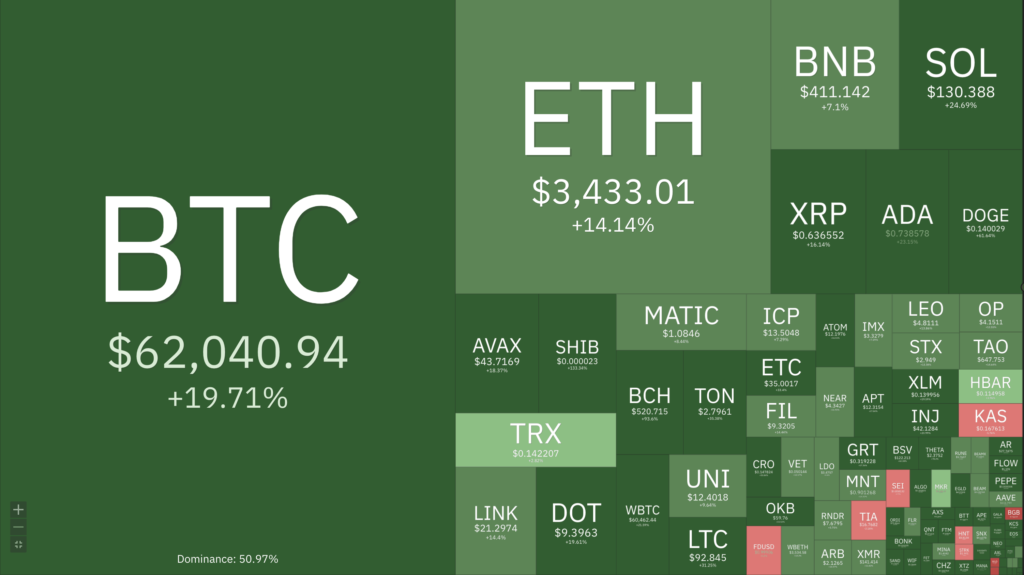
Cryptocurrencies With the Best Performance
- Pepe (PEPE) +226%
- Shiba Inu (SHIB) +136%
- Bonk (BONK) +110%
- Bitcoin Cash +94%
Cryptocurrencies With the Worst Performance
- Worldcoin (WLD) -12.91%
- Blur -4.07%
- Celestia (TIA) -3.54%
- Sui -0.73%
References
- Adam James, Stubborn inflation and rate-cut delays may hamstring crypto valuation increases: Grayscale, theblock, accessed on 3 March 2024.
- Krisztian Sandor, Meme Coin Rally May Signal Impending Altcoin Season; This Is the Sign to Watch, coindesk, accessed on 3 March 2024.
Share
Related Article


See Assets in This Article
BTC Price (24 Hours)
Market Capitalization
-
Global Volume (24 Hours)
-
Circulating Supply
-