Market Analysis May 29th 2023: Crypto Market Still Unstable, BTC Holds Support at MA 200

The crypto market continues to exhibit no significant indications of a positive market reversal. Over the past week, Bitcoin and Ethereum have been trading sideways, exhibiting stability at their respective support levels. However, macroeconomic indicators present a contrasting picture with a substantial surge in business activity in the United States (US), accompanied by a rise in new home sales. For a comprehensive report, refer to the market analysis below.
The Pintu trading team has gathered critical information and analyzed the general economic situation and the crypto market’s movements over the past week. However, it should be noted that all information in this Market Analysis is intended for educational purposes, not as financial advice.
Market Analysis Summary
- 💪🏻 Business activity in the US peaked in May 2023, reaching a 13-month high, driven by robust growth in the service sector, and an augmentation in the US Composite PMI Production Index to 54.5. However, the manufacturing sector exhibited a decline.
- 🔝 New single-family home sales in the US rose by 4.1% in April 2023, achieving the highest level in 13 months.
- 📈 The Core Personal Consumption Expenditure (PCE) Index in the US escalated to 4.4% in April, exceeding market projections, indicative of potent inflationary pressure.
- ✍🏻 The Federal Reserve is shifting towards a data-centric approach in determining interest rate policies. Views among Federal Reserve members are divided regarding the necessity for further interest rate hikes.
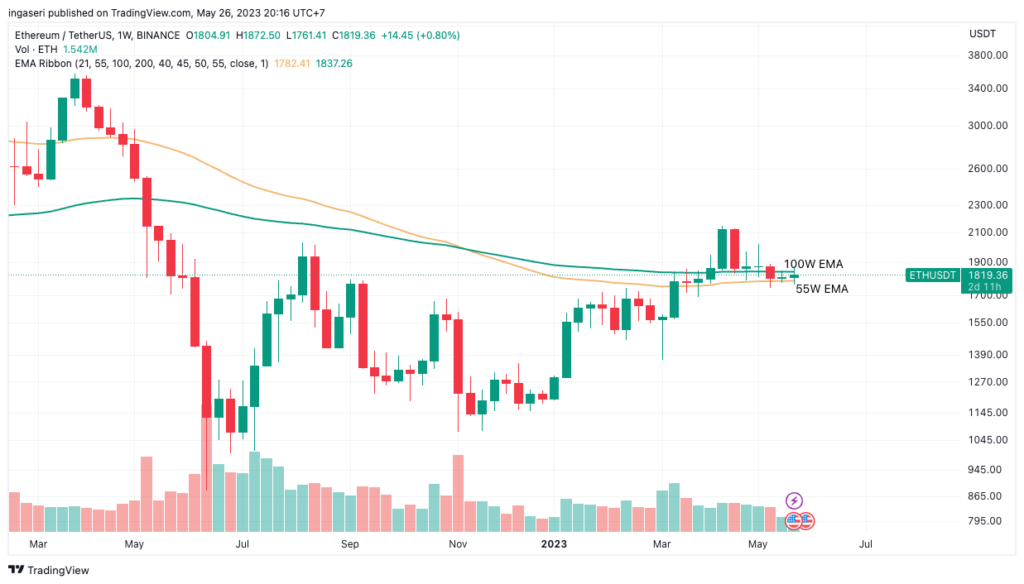
- 🔴 Bitcoin (BTC) and Ethereum (ETH) are experiencing lateral movement, each finding support at the 200-week Moving Average (MA) and the 100-week Exponential Moving Average (EMA) respectively.
Macroeconomic Analysis
Business activity in the United States experienced a surge in May, reaching a 13-month apex driven by substantial expansion in the service sector. This surge in business activity serves as the latest indicator that the economy has garnered momentum in the second quarter despite increasing recession risks.
The US Composite PMI Production Index, which monitors both the manufacturing and service sectors, also experienced a similar surge. Reported by S&P Global on Tuesday, it reached 54.5 in May compared to 53.4 in the previous month. It should be noted that this is the fourth consecutive month that the PMI has remained above 50, a sign of growth in the private sector.
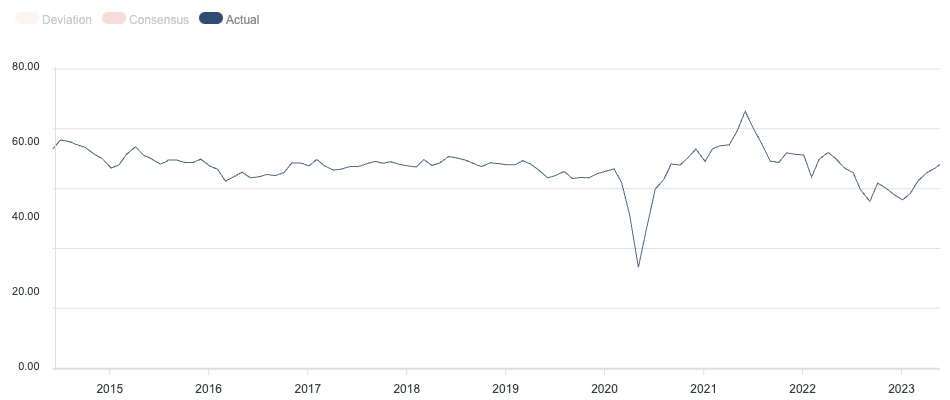
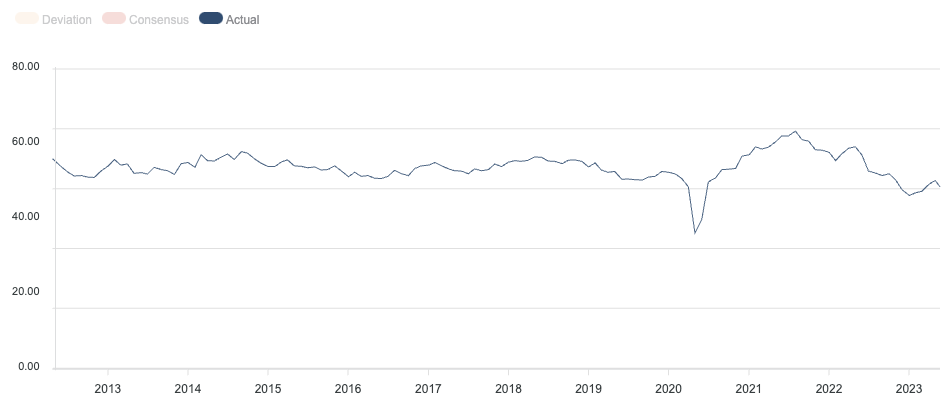
However, the manufacturing sector saw a decline in activity as evidenced by the S&P Global Manufacturing PMI Index, which fell from 50.2 to 48.5, below the consensus of 50 and indicating contraction.
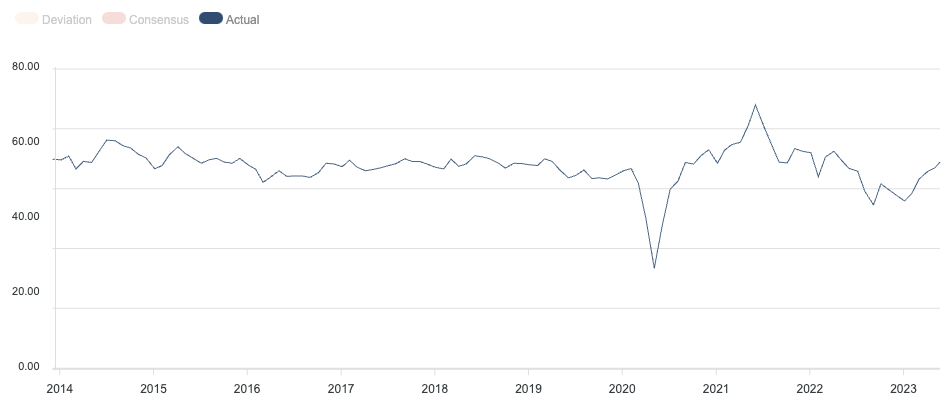
In stark contrast to the manufacturing sector, the services PMI actually beat market expectations of 52.6, rising from 53.6 to 55.1. This is the highest reading in 13 months.
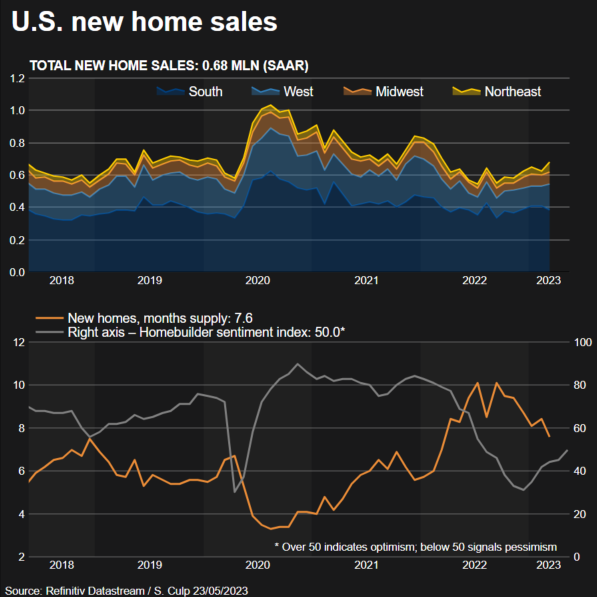
Sales of new single-family homes in the U.S. surged to a 13-month high in April 20-23. This was a 4.1% increase versus the consensus forecast of a 2% decline, reaching a seasonally adjusted annual rate of 638,000 units. This is the highest level of sales since March 2022. Despite the increase in sales, March’s figures were revised downward to 656,000 units from the previously reported 683,000 units.
This increase in new home sales could be attributed to the limited availability of previously owned homes on the market, as well as a notable decrease in prices compared to the high levels observed last year.
Tuesday’s report from the Commerce Department followed last week’s data, which showed a surge in permits for future single-family home construction. Moreover, with homebuilder confidence hitting a 10-month high in May, there is currently no evidence that the recent tightening of credit conditions has had a negative impact on the housing market. It should be noted that the housing sector has been the most affected by the Federal Reserve’s aggressive interest rate hike cycle, which is the fastest rate hike cycle since the 1980s.
Regarding the future direction of interest rates, the minutes released last Wednesday (5/24) indicated a divergence of opinion among Fed members. Some members felt that additional rate hikes may be necessary. Others, however, argued in anticipation of a slowdown in growth that could obviate the need for further monetary tightening.
The Federal Open Market Committee (FOMC), a key interest rate setting body, decided at its last meeting to omit a key sentence from its post-meeting statement. The phrase, which previously implied that “additional policy tightening may be warranted,” was removed.
Currently, the Fed seems to be shifting to a more data-driven approach. Under this approach, several factors will be critical in determining whether or not the rate hike cycle will continue. The Fed emphasized the importance of analyzing a wide range of data and indicators when making decisions about interest rates.
The minutes also noted that FOMC members spent time discussing the financial system in the banking industry. The FOMC noted that an anticipated contraction in lending due to pressures in the banking industry could potentially push the economy into a recessionary state.
The FOMC also highlighted the issue of the national debt ceiling. They reiterated the importance of raising the debt limit in a timely and appropriate manner to avoid the risk of catastrophic damage to the financial system and the broader economy.
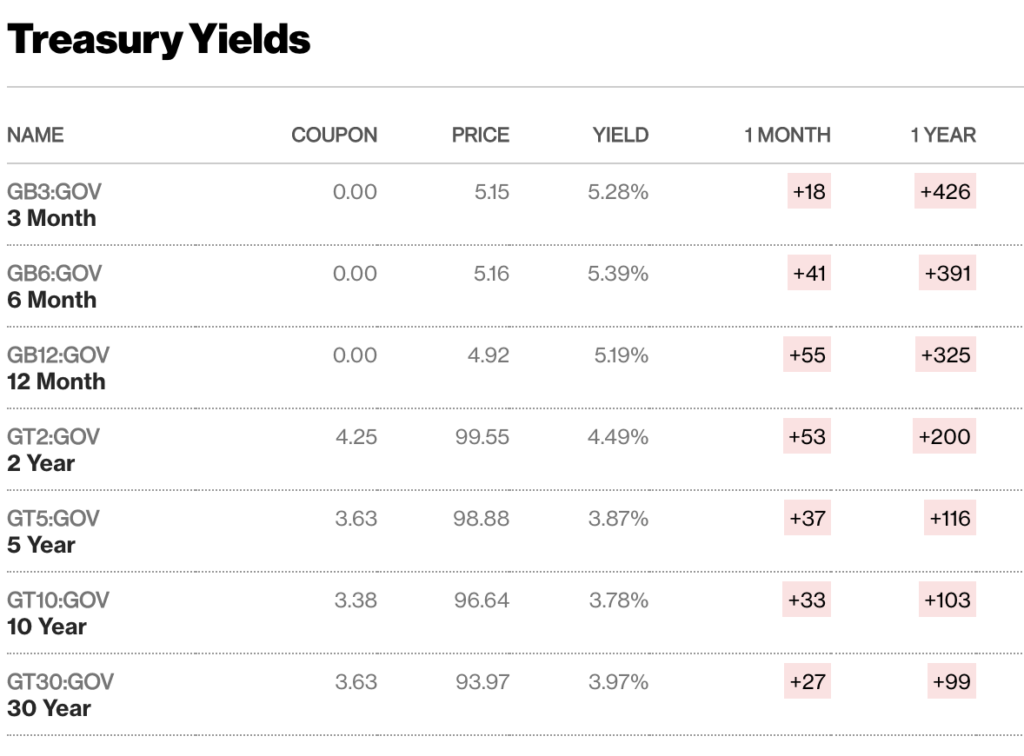
Following the release of the minutes of the Federal Reserve’s May meeting, it was noted that Treasury yields rose on Wednesday.
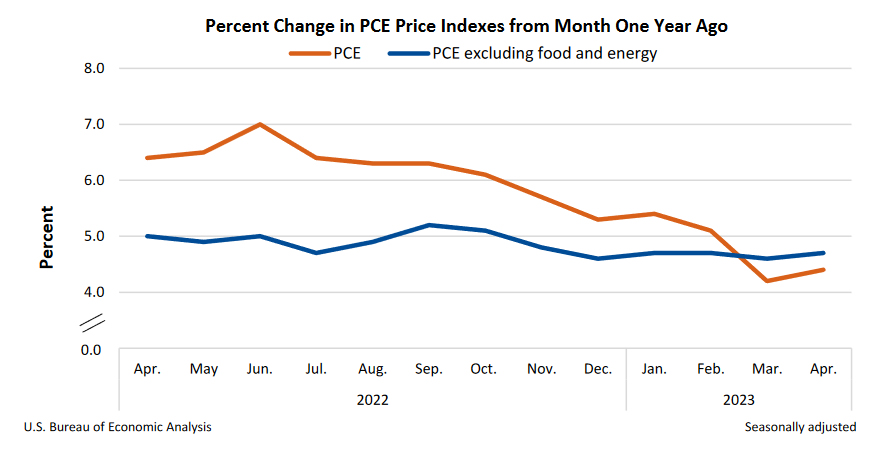
Last Friday, the U.S. released the Personal Consumption Expenditures Core Price Index (PCE) for April. This index is a key inflation indicator for the Federal Reserve. The index posted a slight increase due to a rebound in consumer spending, indicating that inflationary pressures in the economy remain strong. Data-wise, the PCE rose to 4.4% in April, up from 4.2% in the previous month of March and beating the market’s forecast of 3.9%.
The annual increase in the Core PCE price index, the Federal Reserve’s preferred measure of inflation, also rose slightly to 4.7% from 4.6% in the same period, beating analysts’ estimates of 4.6%. Both monthly core PCE inflation and PCE inflation increased by 0.4%.
The report also revealed several other important findings, such as the growth of personal income, which increased by 0.4% on a monthly basis. Meanwhile, personal spending posted a significant increase of 0.8%.
In practice, the Federal Reserve tends to scrutinize the inflation index known as the Personal Consumption Expenditures Price Index more closely than the more popular Consumer Price Index published by the government.
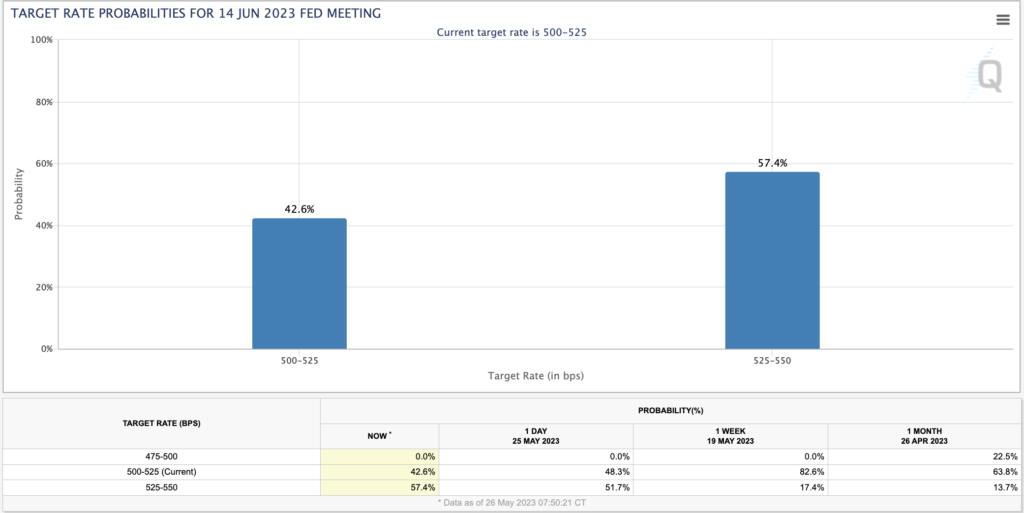
Currently, the probability of a hike in the target rate has risen significantly from week to week, from 17.4% a week ago to the current 57.4% probability.
BTC & ETH Price Analysis
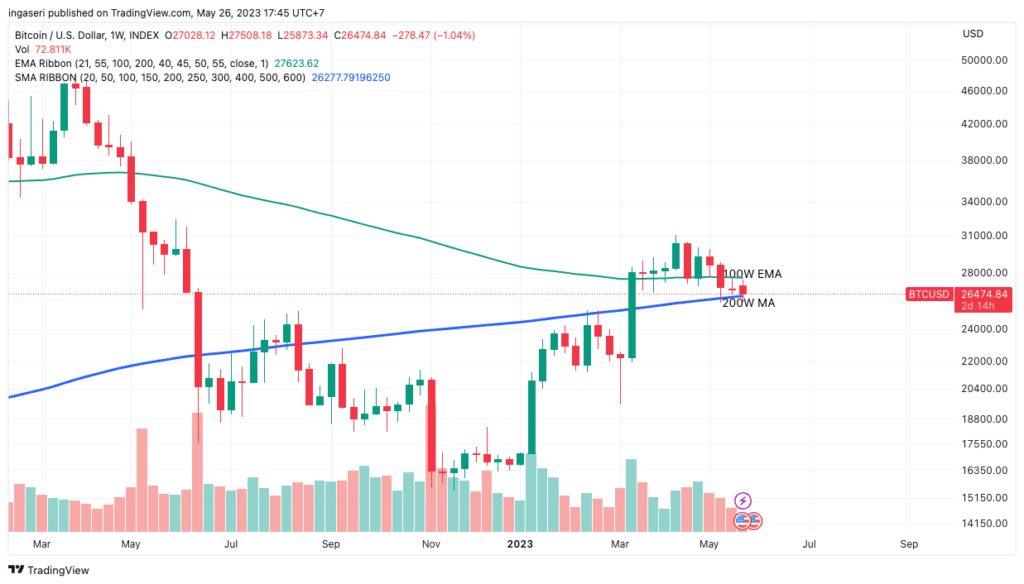
Despite the lack of significant movement related to interest rate hikes, Bitcoin (BTC) has been trading sideways for the past week, finding solid support at the 200-week moving average (MA). Ideally, if BTC manages to close the week above this support, it would establish a significant support level for BTC. It is worth noting that BTC’s maximum pain in June was at a price of $24,000. This maximum pain refers to the strike price at which the underlying asset would result in the greatest financial loss for the majority of option holders at expiration. According to maximum pain theory, the price of options tends to converge on the maximum pain price, potentially causing a maximum number of options to expire worthless. In some cases, the maximum pain price is the same as the option’s strike price.
Over the past week, Ethereum (ETH) has also spent its third week under the 100-week Exponential Moving Average (EMA), mirroring BTC’s sideways movement and finding its support at the 55-week EMA. Specifically, ETH is at a resistance point of 1840 and a support level of 1780.
On-Chain Analysis
- 📊 Exchange: As the exchange reserve continues to rise, it indicates higher selling pressure. Net deposits on exchanges are low compared to the 7-day average. Lower deposits can be interpreted as lower selling pressure.
- 💻 Miners: Miners’ are selling more holdings compared to its one-year average. Miner’s revenue is in a moderate range, compared to its one-year average.
- 🔗 On-chain: More investors are selling at a profit. In the middle of a bull market, it can indicate a market top. Long term holders’ movement in the last 7days were lower than the average. They have a motive to hold their coins. Investors are in an anxiety phase where they are currently in a state of moderate unrealized profits.
- 🏦 Derivatives: Long position traders are dominant and are willing to pay to short traders. Buying sentiment is dominant in the derivatives market. More buy orders are filled by takers. As open interest decreases, it indicates investors are closing futures positions and possibility of trend reversals. In turn, this might trigger the possibility of long/short-squeeze caused by sudden price movement or vice versa.
- 🔀 Technicals: RSI indicates a neutral condition. Stochastic indicates a neutral condition where the current price is in a moderate location between the highest-lowest range of the last 2 weeks.
News About Altcoins
- Ether (ETH) balance on exchanges approaches all-time low. Ether (ETH) holdings on cryptocurrency exchanges are nearing an all-time low, signaling a notable decline in the amount of ETH being stored on trading platforms. This pattern indicates that an increasing number of investors are withdrawing their ETH from exchanges, potentially reflecting a shift towards long-term investment strategies or decentralized exchanges. The limited availability of ETH on exchanges may also contribute to upward pressure on prices within the market.
- Multichain team rumored to be arrested, DeFiBridge Moves Assets to Fantom Network for Security. Multichain, a cross-chain bridge, was the subject of rumors that some of its team members had been arrested in Shanghai. This led to a decline in the price of its native token, MULTI, and a surge in the volume of assets being transferred off the platform. Fantom, a blockchain that is heavily integrated with Multichain, was also affected by the crisis. DeFiBridge, a decentralized finance (DeFi) bridge connecting multiple blockchains, successfully shifted its operations to the Fantom blockchain. This move was made due to concerns over security and scalability on the Binance Smart Chain (BSC). The migration process involved the transfer of approximately $1.5 billion in locked assets from BSC to Fantom. The move to Fantom offers DeFiBridge users faster transaction speeds, lower fees, and increased network stability.
News from the Crypto World in the Past Week
- Breaking News! Hong Kong Opens Great Opportunity for Retail Crypto Investors! Hong Kong is set to allow crypto trading for retail investors with appropriate safeguards in place. The Securities and Futures Commission (SFC) will implement regulations for virtual asset trading platforms, including enhanced due diligence and disclosure standards. Platform operators complying with these standards can apply for licenses, while those failing to meet the criteria are expected to wind down their operations. Furthermore, SFC prohibits reward programs related to specific virtual assets and certain services like deposits and loans are still not permitted.
- Beijing Unleashes Web3 Innovation with Release of White Paper, Embracing Crypto and NFTs. Beijing has released a white paper on Web3 innovation and development. The white paper, released by the Beijing Municipal Science and Technology Commission, recognizes Web3 technology as an “inevitable trend for future Internet industry development.” The paper outlines a number of areas where Beijing is looking to promote Web3 innovation, including blockchain, decentralized finance, and non-fungible tokens. The release of the white paper comes at a time when China is increasingly warming up to the cryptocurrency industry. In May, a segment on cryptocurrency aired on state-owned television, and Binance CEO Changpeng Zhao has said that he believes China is “showing signs of opening up” to the industry.
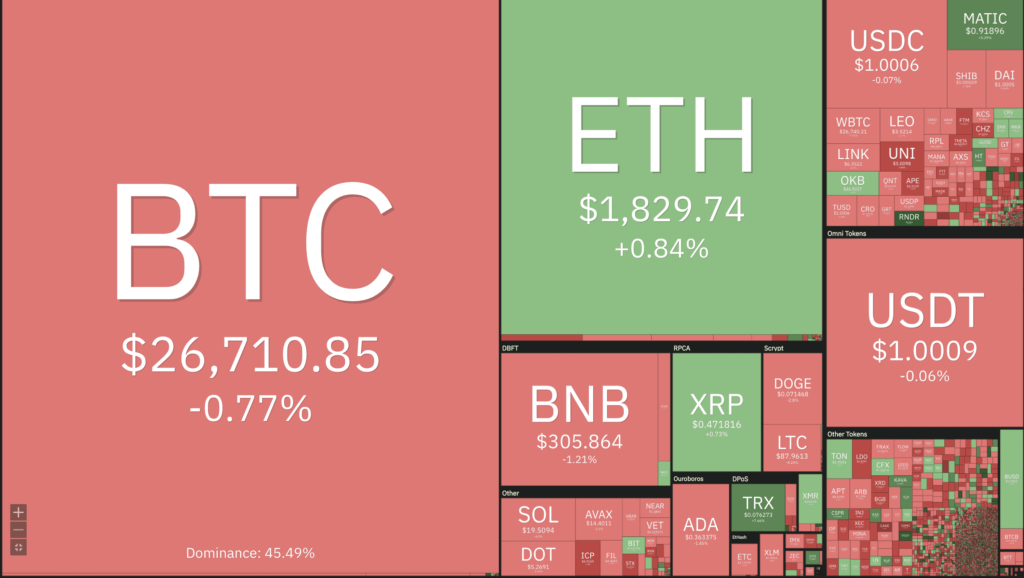
Cryptocurrencies Market Price Over the Past Week
Cryptocurrencies With the Best Performance
- KAVA +11,03%
- Tron +7,40%
- IOTA (MIOTA) +6,21%
- Polygon (MATIC) +5,50%
Cryptocurrencies With the Worst Performance
- GMX (GMX) -13,89%
- Fantom -10,86%
- Stacks (STX) -9,74%
- Algorand (ALDO) -9,43%
References
- Sam Reynolds, Ether Balance on Exchanges Nears All-Time Low, Coindesk, accessed on 27 May 2023.
- Kiuyan Wong, Annabelle Droulers, Hong Kong Lets Retail Investors Trade Crypto in New Rules, Bloomberg, accessed on 27 May 2023.
- Amaka Nwaokocha, Beijing releases white paper for Web3 innovation and development, Cointelegraph, accessed on 29 May 2023.
- Pedro Solimano, Panic Over $1.5 Billion DeFi Bridge Multichain Shifts to Fantom, Decrypt, accessed on 29 May 2023.
Share
Related Article


See Assets in This Article
BTC Price (24 Hours)
Market Capitalization
-
Global Volume (24 Hours)
-
Circulating Supply
-