Market Analysis Nov 4th, 2024: BTC Ends October Strong as U.S. Election Looms

The ‘Octobull’ proved to be more than just a figure of speech, as Bitcoin closed October positively, hovering around the $72,000 mark. As we enter the first week of November, crypto investors are gearing up for the upcoming U.S. presidential election, which could significantly impact the growth of the crypto market. Check out the analysis below.
Market Analysis Summary
- 📝 BTC is currently displaying strong bullish momentum, reaching its highest level since March of this year. There is support at $70,200, which aligns with the 1.0 Fibonacci retracement line
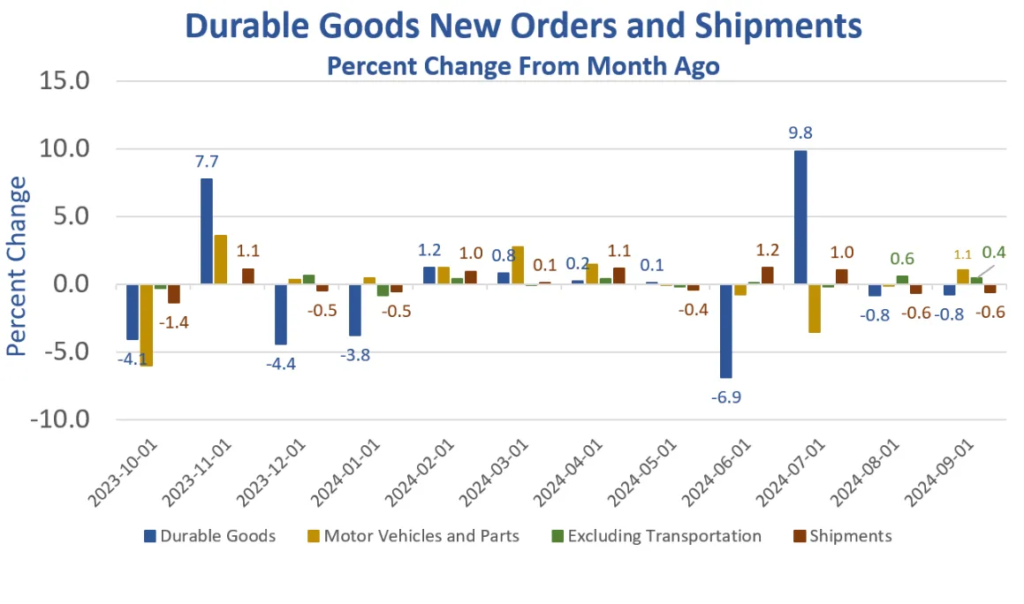
- 📉 Government data released on Friday showed that U.S. durable goods orders declined in September.
- ⤴️ The U.S. goods trade deficit widened to $108.2 billion in September, marking a 14.9% increase from the previous month.
- 💼 The U.S. Bureau of Labor Statistics (BLS) reported on Tuesday that the number of job openings stood at 7.44 million on the last business day of September.
- 📈 October’s Michigan Consumer Sentiment Index rose to 70.5, reaching its highest level since April. The results surpassed economists’ expectations, while consumer inflation expectations remained within the pre-pandemic range.
Macroeconomic Analysis
Durable Goods
Government data released on Friday showed that U.S. durable goods orders declined in September, driven by significant decreases in defense and civilian aircraft orders.
According to the Census Bureau, orders for tangible items expected to last at least three years fell by 0.8% month-over-month to approximately $284.77 billion. This drop was slightly less than the consensus estimate of a 1% decrease. In August, durable goods orders had also declined by 0.8%.

In September, new orders for transportation equipment decreased by 3.1% month-over-month to $95.43 billion. This decline was driven by a roughly 24% drop in orders for defense aircraft and parts and a 23% slump in the nondefense segment. However, orders for motor vehicles and parts rose by 1.1%, according to the report.
Excluding transportation equipment, new orders increased by 0.4% last month, outperforming the Bloomberg estimate of a 0.1% decrease. Government data showed that orders for fabricated metal products went up, while those for machinery, computers, and electronic items declined.
Shipments of manufactured durable goods fell by 0.6% to $287.30 billion last month, with transportation equipment shipments decreasing by 2.4%.
Government data indicates that new orders for nondefense capital goods decreased by 4.5% to $84.11 billion, while shipments fell by 3.6%. Meanwhile, orders for defense capital goods rose by 6.4% to $17.51 billion, although shipments in this category declined by 0.8%.
Inventories reached $528.26 billion last month, slightly down from $529.24 billion in August, according to the data.
Other Economic Indicators
- Michigan Consumer Sentiment: The Michigan Consumer Sentiment Index increased to 70.5 in its final October reading, surpassing both the preliminary figure earlier this month and the September reading. Economists had predicted a reading of 69.0 for the month. While consumers’ assessments of current economic conditions have improved, their expectations for future economic performance have slightly diminished. This month’s increase was primarily due to modest improvements in buying conditions for durables, in part due to easing interest rates
- Goods Trade Balance: The U.S. goods trade deficit widened to $108.2 billion in September, marking a 14.9% increase from the previous month. Exports fell by $3.6 billion from August, totaling $174.2 billion. In contrast, imports rose by $10.4 billion compared to the prior month, reaching $282.4 billion.
- JOLTs Job Opening: The U.S. Bureau of Labor Statistics (BLS) reported on Tuesday that the number of job openings stood at 7.44 million on the last business day of September, according to the Job Openings and Labor Turnover Survey (JOLTS). This figure is down from the revised 7.86 million openings in August (originally reported as 8.4 million) and falls short of the market expectation of 7.99 million.
- ADP Employment: The ADP National Employment Report—a key metric of private, non-farm employment in the United States—has shown a significant increase. The report, based on payroll data from approximately 400,000 U.S. business clients, revealed a rise of 233,000 jobs, far exceeding expectations. In conclusion, the latest ADP Nonfarm Employment Change report has outperformed expectations, signaling strong economic growth. The higher-than-expected job creation is a positive indicator for the U.S. economy and could influence the Federal Reserve’s policy decisions in the coming months.
- GDP Growth Rate: The United States’ Gross Domestic Product (GDP) is projected to have grown at an annualized rate of 2.8% in the third quarter. This growth rate falls short of the market forecast of 3% and follows a 3.0% expansion in the second quarter. The report also revealed that the Gross Domestic Product Price Index increased by 1.8% during the July-September period, down from a 2.5% rise in the previous quarter. Meanwhile, the core Personal Consumption Expenditures (PCE) Price Index climbed by 2.2% on a quarterly basis, lower than the 2.8% growth recorded in the second quarter but exceeding forecasts of a 2.1% gain.
- PCE index: The PCE Index, a key indicator of changes in consumer purchasing trends and inflation reported an actual increase of 0.3%. This index measures the price changes of goods and services purchased by consumers for consumption, excluding food and energy costs.
- Initial Jobless: Initial claims for state unemployment benefits decreased by 12,000 to a seasonally adjusted 216,000 for the week ending October 26, marking the lowest level since May. Economists had anticipated 230,000 claims for the latest week. Unadjusted claims fell by 3,349 to 200,132 last week. The number of people receiving benefits after an initial week of aid dropped by 26,000 to a seasonally adjusted 1.862 million during the week ending October 19.
BTC Price Analysis
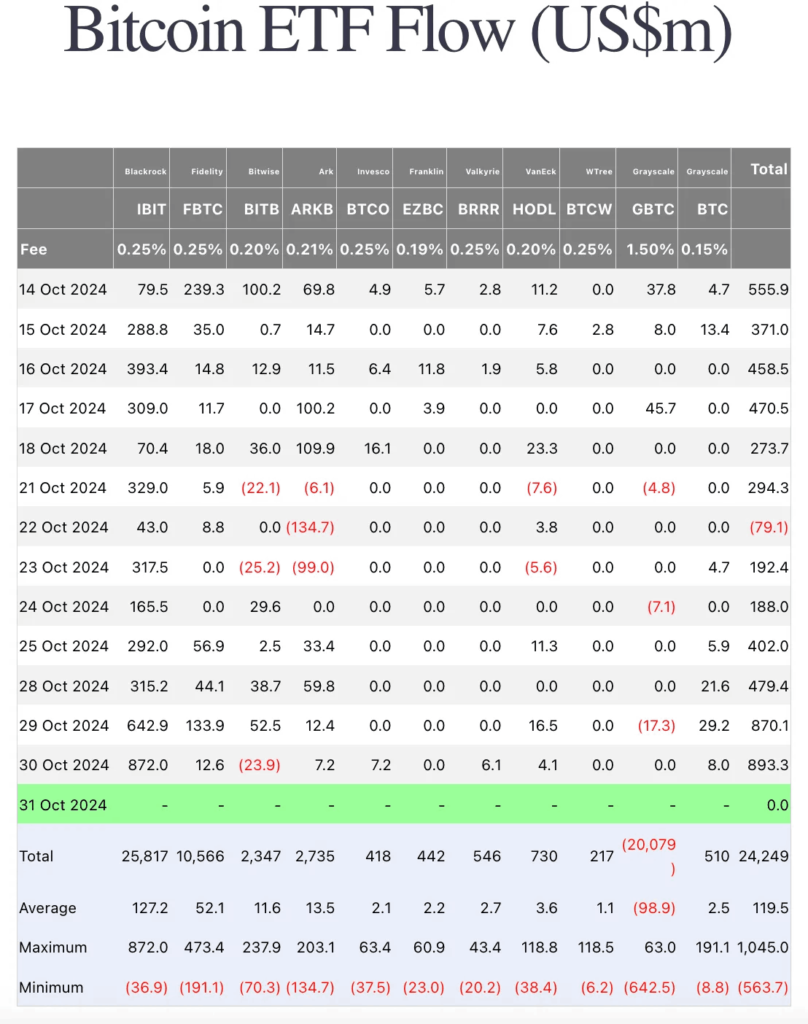
BTC is trading steadily around $70,000-72,000 on after a four-day rally. Institutional demand remains robust, evidenced by over $896 million in inflows into U.S. spot Bitcoin ETFs on Wednesday. Business intelligence firm MicroStrategy revealed plans to raise $750 million to acquire more Bitcoin. However, traders should exercise caution, as data indicates that some are taking profits following the recent surge.
Institutional demand is rising despite a slight price decline observed on Wednesday. Data from Coinglass shows that U.S. spot Exchange Traded Funds (ETFs) experienced inflows of $896.30 million—the second-largest single-day inflow on record. The BlackRock ETF (IBIT) contributed $875 million to these inflows during the same period. If this trend continues, it could further fuel the ongoing Bitcoin price rally.

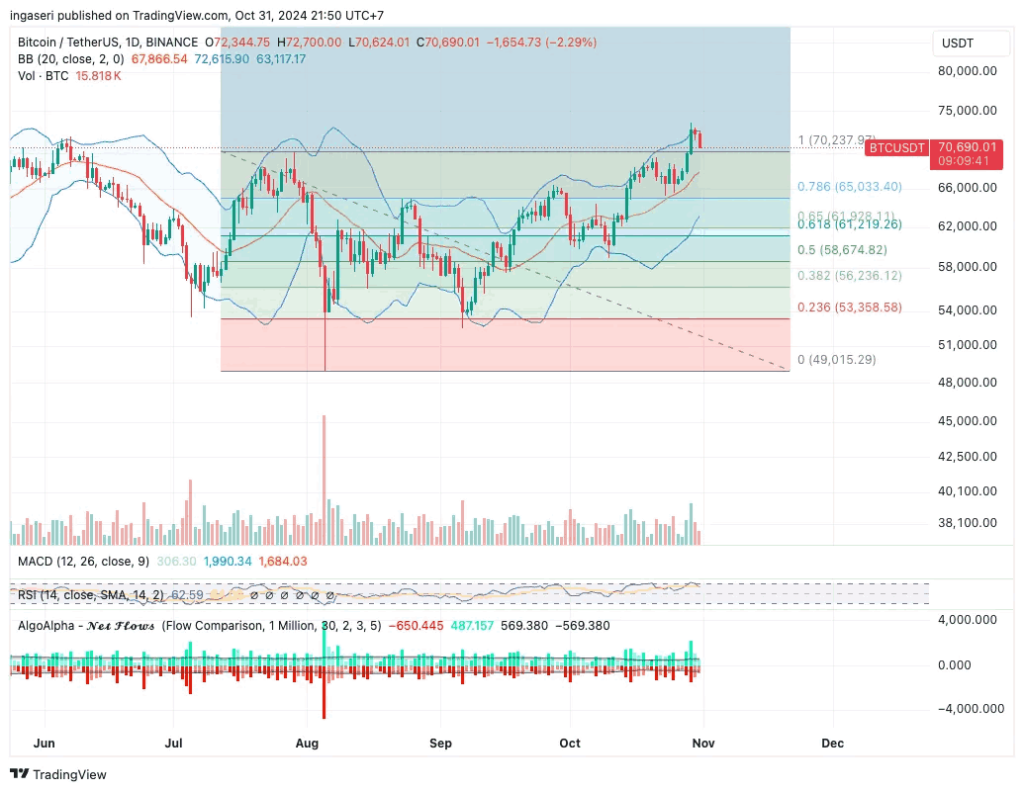
BTC is currently displaying strong bullish momentum, reaching its highest level since March of this year. There is support at $70,200, which aligns with the 1.0 Fibonacci retracement line. If this support level is broken, the next support is expected around $65,000.
If BTC fails to hold the $70,200 support and subsequently the $65,000 level, the next support zones could be around $62,000 and $60,000, based on historical price action and Fibonacci retracement levels.
On the upside, breaking past immediate resistance at $73,000 could open the path toward previous all-time highs. Traders might watch for resistance around $75,000 and $80,000 as potential targets.

On-Chain Analysis
- 📊 Exchange: As the exchange reserve continues to fall, it indicates lower selling pressure. Net deposits on exchanges are high compared to the 7-day average. Higher deposits can be interpreted as higher selling pressure.
- 💻 Miners: Miners’ are selling holdings in a moderate range compared to its one-year average. Miner’s revenue is in a moderate range, compared to its one-year average.
- ⛓️ On-chain: More investors are selling at a profit. In the middle of a bull market, it can indicate a market top. Investors are in a belief ****phase where they are currently in a state of high unrealized profits.
- 🏦 Derivative: Long position traders are dominant and are willing to pay to short traders. Selling sentiment is dominent in the derivatives market. More sell orders are filled by takers. As OI increases, it indicates more liquidity, volatility, and attention are coming into the derivative market. The increasing trend in OI could support the current ongoing price trend.
- 🔀 Technicals: RSI indicates a neutral condition. Stochastic indicates a neutral condition where the current price is in a moderate location between the highest-lowest range of the last 2 weeks.
News About Altcoins
- Popcat Hits a New Record High. Popcat (POPCAT), a popular meme coin on the Solana network, surged 11% in the past 24 hours, reaching a new all-time high of $1.75. This surge has propelled POPCAT to the second-largest meme coin on Solana, with a market capitalization exceeding $1.6 billion, trailing only Dogwifhat (WIF). The overall market cap of Solana meme coins has climbed to over $12 billion, reflecting a nearly 7% increase in a single day.
News from the Crypto World in the Past Week
- The Crucial Role of Crypto Investors in the 2024 U.S. Presidential Election. For the first time, cryptocurrency could play a significant role in the 2024 U.S. presidential election, with crypto investors emerging as an influential new voting bloc. It’s estimated that between 7% and 21% of Americans own crypto, and 73% of them consider a candidate’s stance on the industry to be a deciding factor in their vote. This crypto voting power is especially impactful in key swing states like Arizona and Georgia. While Donald Trump has shown support by pledging to establish a bitcoin reserve and ease regulations, the Biden-Harris administration is generally viewed as less crypto-friendly due to its strict regulatory policies. Although it’s still unclear who will be more pro-crypto, the role of crypto investors is expected to grow in future elections, providing an opportunity for candidates who support the industry to strengthen their political futures.
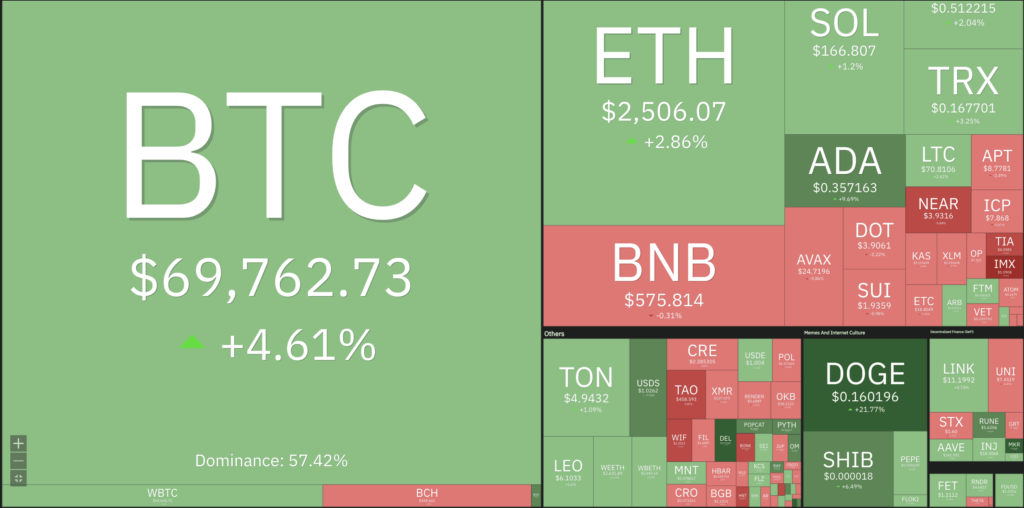
Cryptocurrencies Market Price Over the Past Week

Cryptocurrencies With the Best Performance
- Dogecoin +18,67%
- Raydium +13,21%
- Maker +11,89%
- THORChain (RUNE) +11,59%
Cryptocurrencies With the Worst Performance
- Immutable -19,06%
- Celestia (TIA) -14,66%
- cat in a dogs world (MEW) -14,53%
- Beam (BEAM) -12,67%
References
- Vivian Nguyen, Popcat hits new ATH, leads Solana meme coin rally, Cryptobriefing, accessed on 2 November 2024.
- Kelly O’Grady, Why cryptocurrency owners could impact the U.S. presidential election, Cbsnews, accessed on 2 November 2024.
Share
Related Article
See Assets in This Article
4.9%
0.0%
2.0%
0.0%
0.0%
BTC Price (24 Hours)
Market Capitalization
-
Global Volume (24 Hours)
-
Circulating Supply
-


