Market Analysis November 24, 2025: Bitcoin and Solana Recovery Potential

Article Summary
- Bitcoin has experienced 4 consecutive bearish weekly closes and has lost its gains in 2025. However, there is potential for a reversal to $95,000 and $100,000 to test the psychological levels.
- Ethereum is weaker than Bitcoin, as seen from its daily and 4-hour charts. Closest Support is at $2,623, and the area around $2,200 for a potential reversal.
- Solana is similar to Bitcoin, with bullish candlesticks forming in its daily and 4-hour charts. SOL’s RSI shows a potential reversal.
Currently, Bitcoin has experienced 4 consecutive bearish weekly closes and has lost its gains in 2025. Many analysts have stated that Bitcoin and the crypto market in general have entered a bear market phase with predicted bottoms such as $75,000, $40,000, and even $35,000.
However, if we look at the 1-day timeframe, there is a possibility for Bitcoin and the crypto market as a whole to experience a rebound this week. There are no events scheduled this week that could introduce macro volatility, so the focus this week will be on technical analysis to anticipate the direction of market movement.
Bitcoin (BTC) Analysis
Hope amidst Bearish Momentum
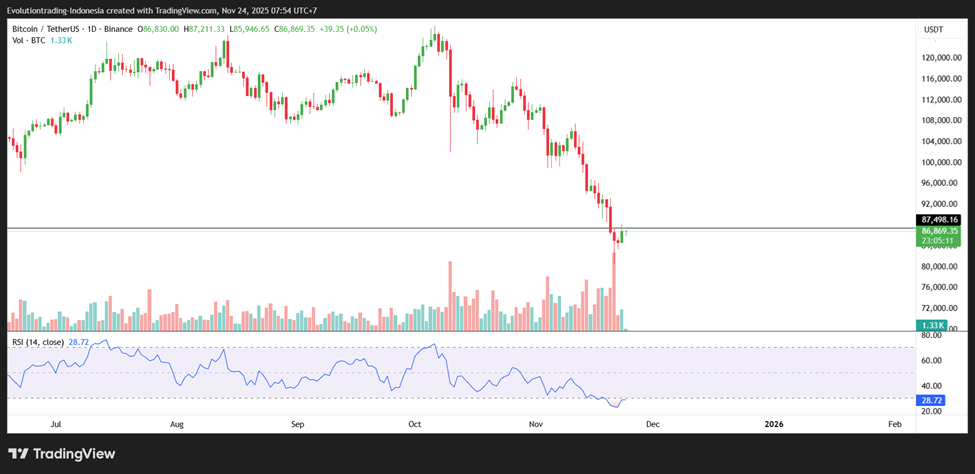
Bitcoin took center stage this week with the formation of a bullish candlestick on the 1-day timeframe and the creation of a large trading volume around $83,000. Although many technical indicators are still showing bearish signals, oscillator indicators such as RSI are showing a potential reversal.
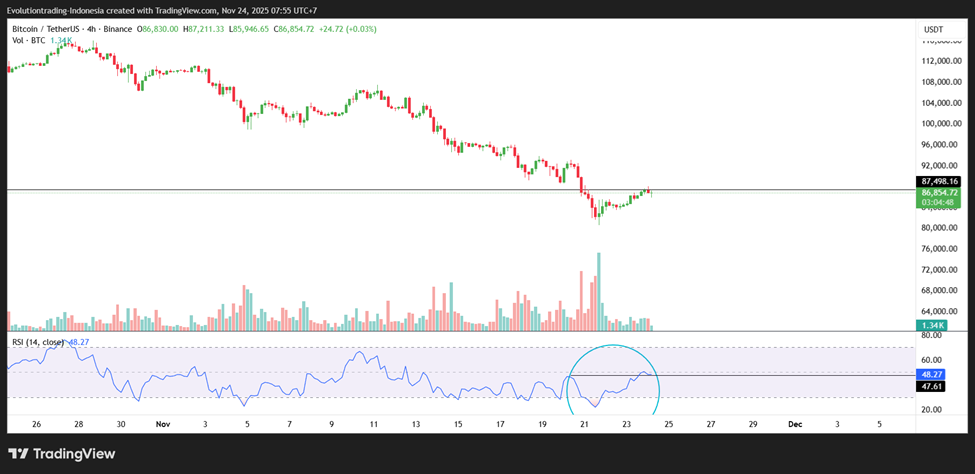
On the 4-hour timeframe, Bitcoin’s Relative Strength Index (RSI) is already showing a very strong potential reversal. The RSI value has returned from the oversold area and formed a higher high. For further upside confirmation, we can monitor whether Bitcoin can break its support-become-resistance level in the $87,500 area.
Some key points for Bitcoin:
- Bullish Candlestick Formation on the 1-day Timeframe: Is a strong bullish indication.
- The RSI on the 4-hour Timeframe shows a potential reversal: As the RSI rises out of the oversold area and forms a higher high, it signals the formation of bullish momentum.
- Resistance level at $87,500: This level needs to be broken for further confirmation of Bitcoin. If broken, then Bitcoin has the potential to rise further to $95,000 and $100,000 to test the psychological levels.
Ethereum (ETH) Analysis
Weaker than Bitcoin
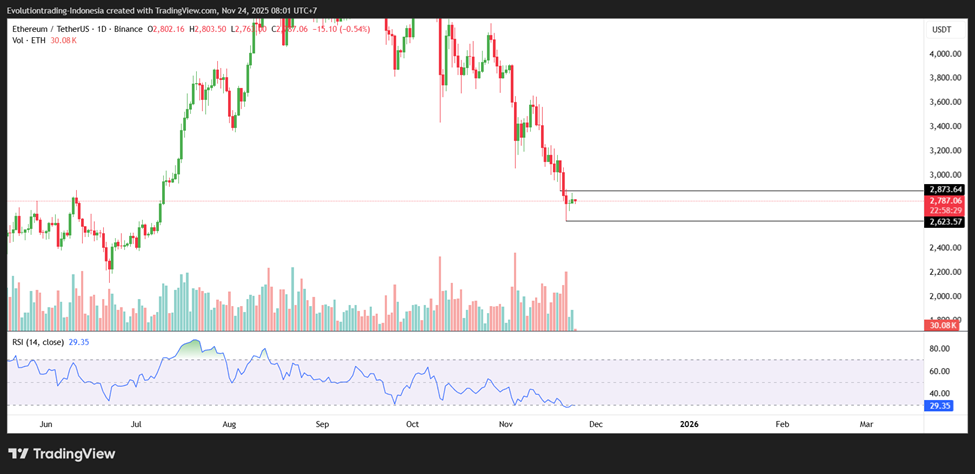
Unlike Bitcoin, Ethereum shows weaker momentum when viewed from the formation of candlesticks on the 1-day timeframe. This is also reinforced by the RSI indicator which did not form a higher high.
Currently, the $2,783 level will be an important level for Ethereum. If Ethereum can break that level, then Ethereum will have the potential to rise further.

Some key points for Ethereum:
- The need for bullish momentum that can take Ethereum through the $2,783 level: This level is an important support that becomes resistance.
- Closest Support is at $2,623 and the area around $2,200 which is the level we can monitor in case of a decline in Ethereum.
Solana Analysis (SOL)
Potential for Recovery

Solana’s price movement is similar to Bitcoin, with the formation of a bullish candlestick on the 1-day timeframe and a large trading volume in the area around $120. Although many technical indicators are still showing bearish signs, oscillator indicators such as RSI are showing a potential reversal.
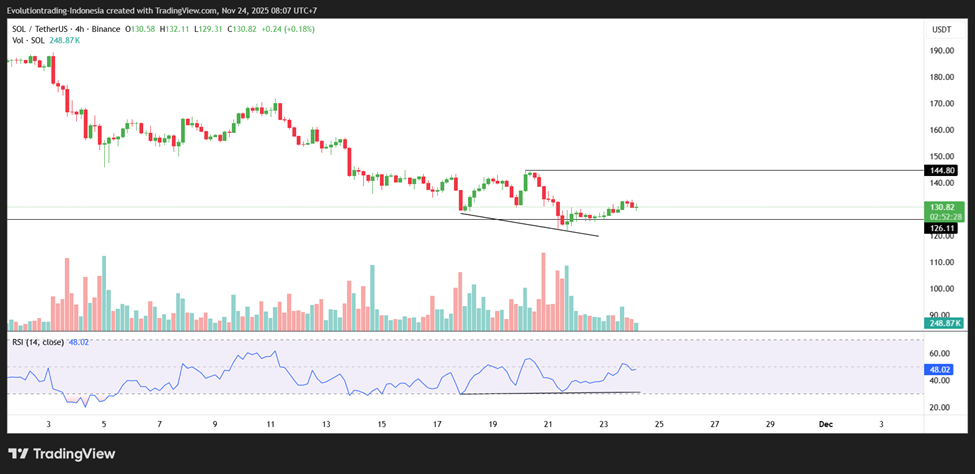
On the 4-hour timeframe, the Relative Strength Index ( RSI) for Solana is already showing a very strong reversal potential with a bullish divergence, which is a fairly strong reversal signal.
Some key points for Solana:
- Bullish Candlestick Formation on the 1-day Timeframe: This is a strong bullish indication.
- RSI on the 4-hour Timeframe shows a potential reversal: Potential reversal after a bullish divergence.
On-Chain Analysis: Extreme Fear
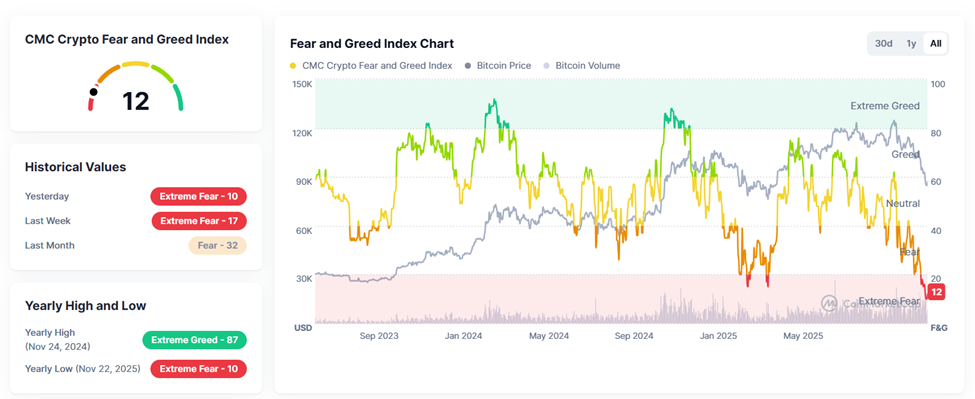
The Fear and Greed Index is currently showing a value of 12, or extreme fear, signaling mass fear in the market. Historically, this level is the lowest level in the past 2 years, although there is an increase from yesterday’s value of 10. Some traders will use this extreme fear value to look for “buy the dip” opportunities.
Altcoin Market News
- Chainlink ($LINK): The first LINK ETF product will launch next week.
- Avail ($AVAIL): The Avail Nexus mainnet will be launched in the near future. Avail Nexus will eliminate the need to use bridges when moving assets to other blockchains.
- Hyperliquid ($HYPE): Hyperliquid team’s tokens will be unlocked for the first time on November 29. The tokens unlocked are worth $312 million (as of November 24).
Crypto Performance in the Last Week
Top Performing Cryptocurrencies
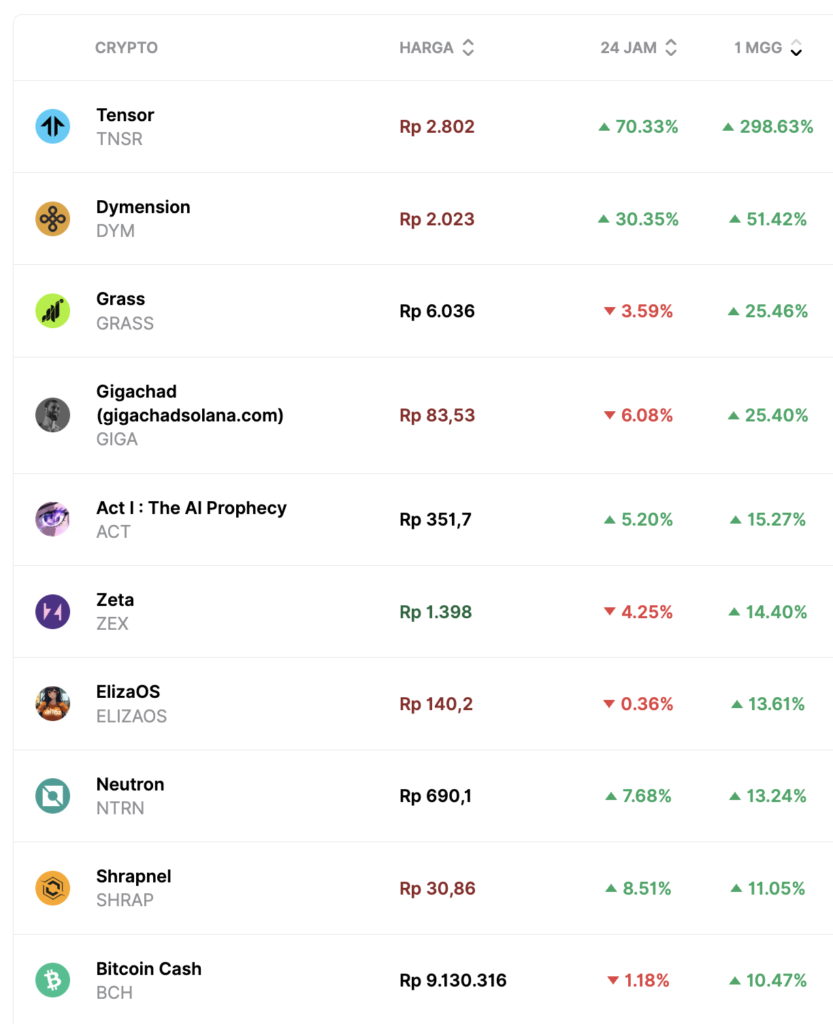
- Tensor ($TNSR) +298%
- Dymension ($DYM) +51.4%
- Grass ($GRASS) +25.4%
- Gigachad ($GIGA) +25.4%
Worst Performing Cryptocurrencies

- Fwog ($FWOG) -39%
- Starknet ($STRK) -37.5%
- Perpetual Protocol ($PERP) -34.4%
- WalletConnect ($WCT) -32.61%
Share