Market Analysis Oct 30th, 2023: Uptober Confirmed with BTC Surging by 30%

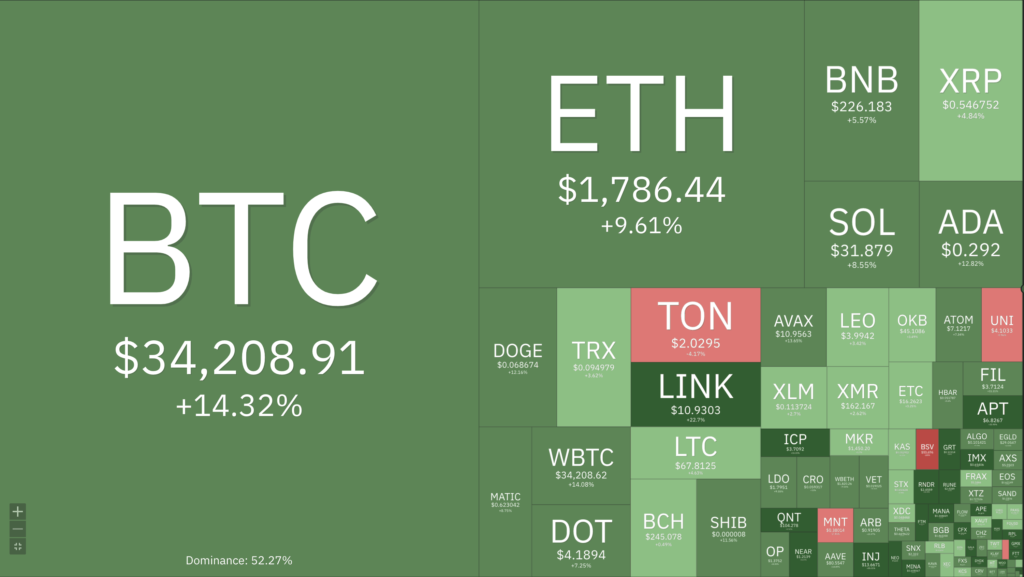
Cryptocurrency investors are rejoicing as bitcoin prices soared to $35,000, pushing the overall crypto market up a substantial 9%. The much-anticipated “Uptober” appears to be in full swing for crypto investors, especially given the recent positive momentum in the U.S. macroeconomy, which is expected to have a favorable impact on the cryptocurrency market. Read on below for a comprehensive market analysis.
The Pintu trading team has gathered critical information and analyzed the general economic situation and the crypto market’s movements over the past week. However, it should be noted that all information in this Market Analysis is intended for educational purposes, not as financial advice.
Market Analysis Summary
- 🦾 Data from the Bureau of Economic Analysis (BEA) shows that in the third quarter, the U.S. economy expanded by 4.9%, surpassing economists’ projections of 4.3%.
- 💼 According to a report from the Department of Labor, unemployment claims increased by 10,000 to 210,000 for the week ending on October 21.
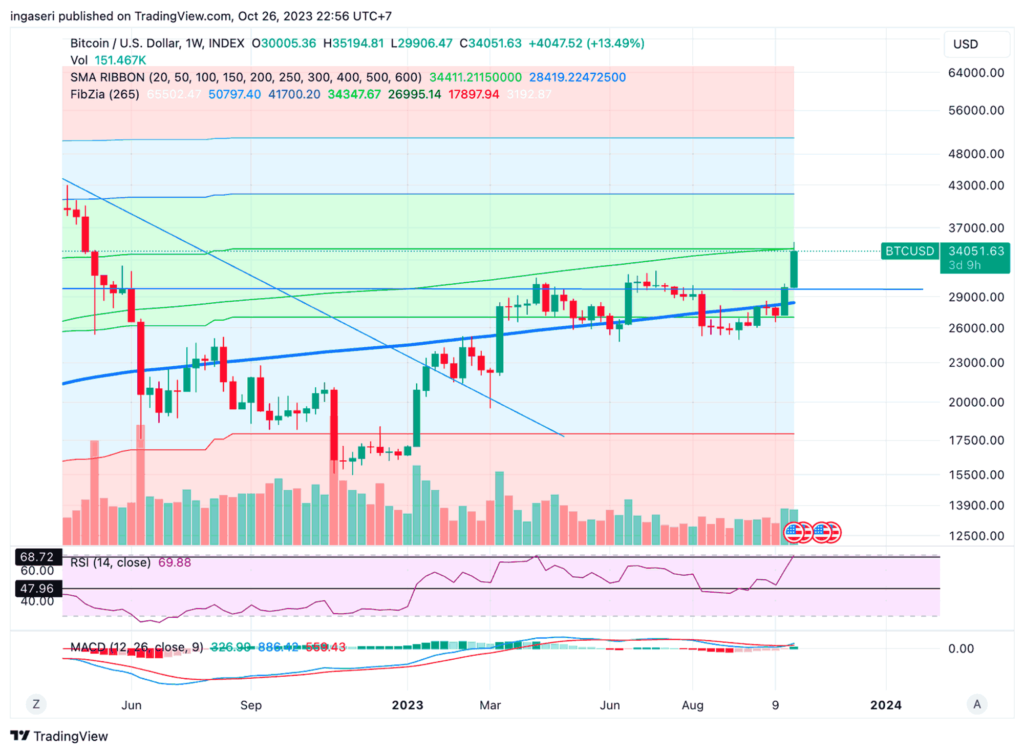
- 📈 BTC has shown a positive performance, surging by 13% over the course of the week. Currently, BTC finds psychological support at the US$30,000 level and resistance at US$34,000.
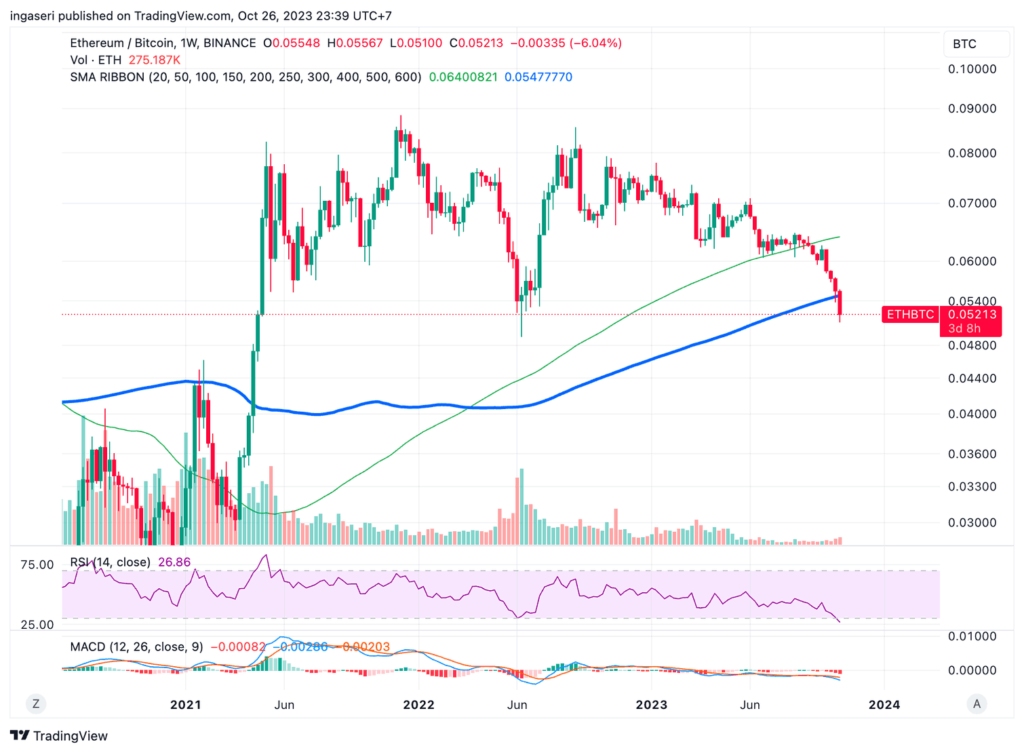
- 👀 ETH whales have shown low interest due to ETH’s failure to break above the US$1,860 threshold. If ETH continues to trade below this level, its performance is likely to be weaker compared to BTC.
Macroeconomic Analysis
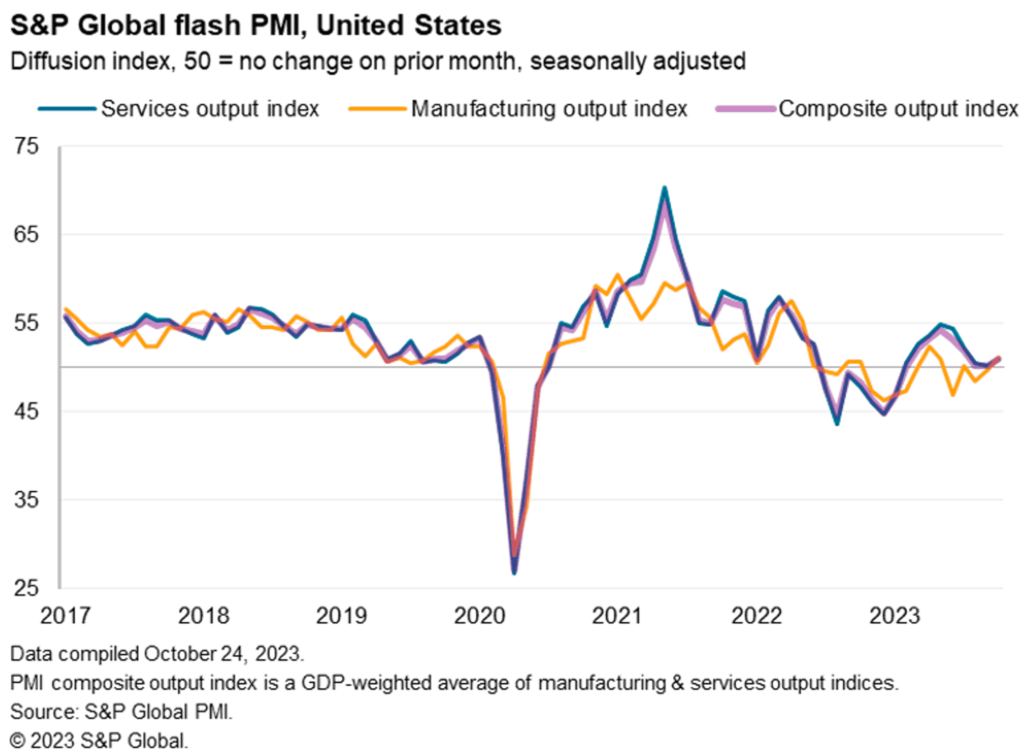
This week’s market analysis begins with a focus on the growth of economic activity in the private sector of the United States (US), highlighting several key points:
- The Standard & Poor’s (S&P) Global Composite Purchasing Managers’ Index (PMI) rose from 50.2 in September to 51 in early October.
- The manufacturing PMI rose from 49.5 to 50, beating the forecast of 49.5.
- The services PMI also improved, rising from 50.1 to 50.9.
With the moderate uptrend in economic activity, the market is optimistic about the potential for a soft landing for the US economy. This sentiment persists despite rising geopolitical concerns and domestic political tensions.
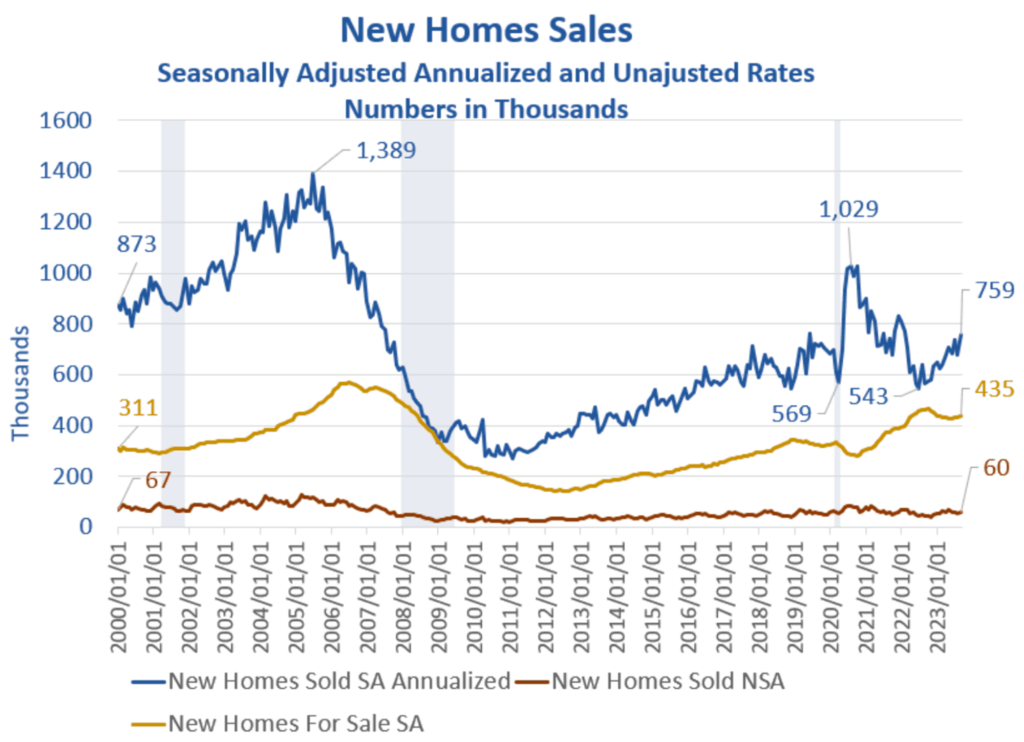
Another improvement was seen in new home sales in September, which showed a significant increase of 12.3% to a seasonally adjusted annual rate of 759,000. This is a significant increase from the revised 676,000 rate recorded in August, as reported jointly by the U.S. Department of Housing and Urban Development and the Census Bureau. This increase is particularly notable given that mortgage interest rates are above 7%.
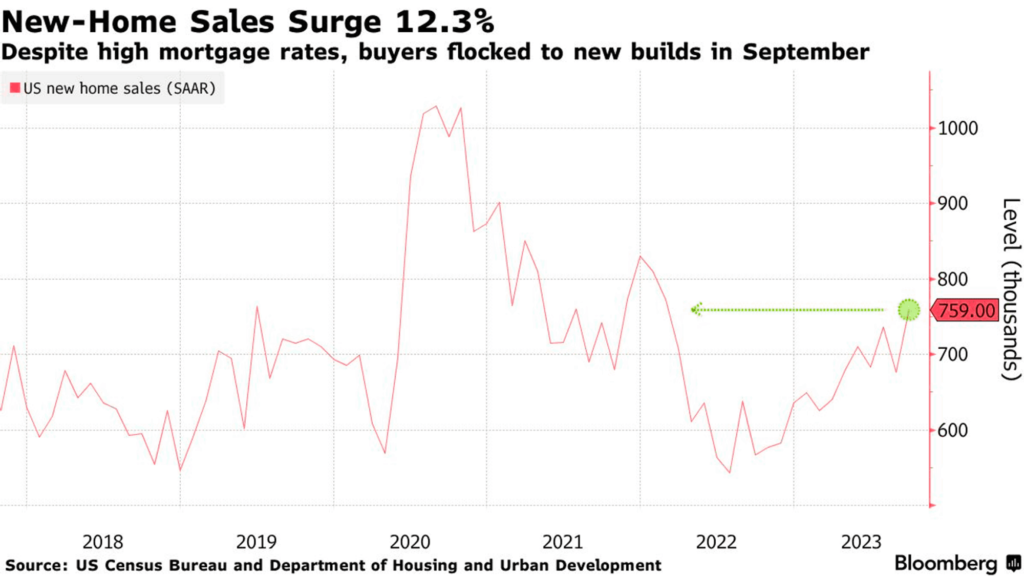
These numbers represent the fastest pace of sales since February 2022, beating the 680,000 sales rate that analysts were expecting.
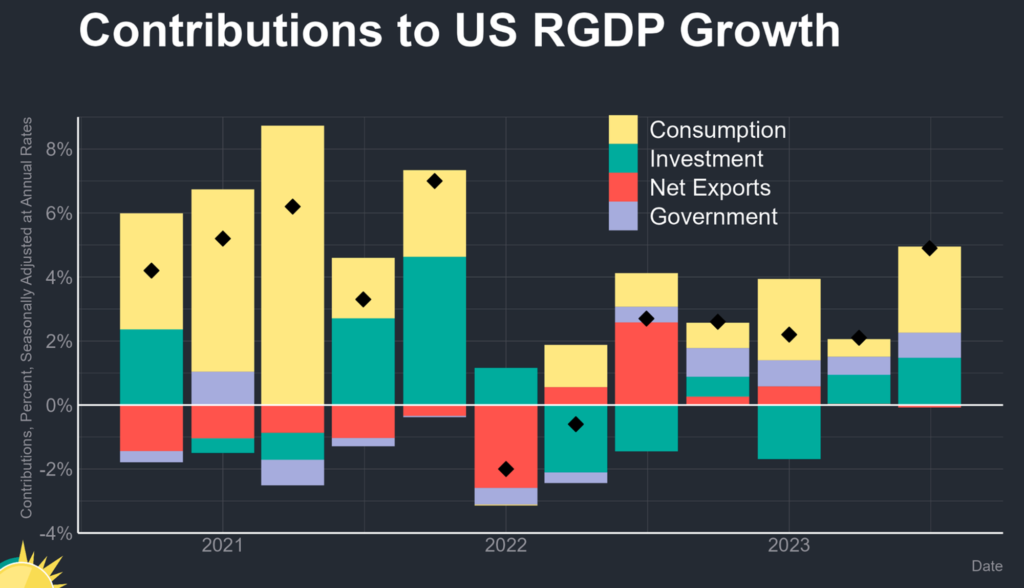
From an economic standpoint, the U.S. economy continues to grow, according to the Bureau of Economic Analysis (BEA). In the third quarter, the U.S. economy expanded by 4.9%, exceeding economists’ forecasts of 4.3%. This expansion marked a significant increase from the 2.1% growth rate in the second quarter.
Excluding the years affected by the pandemic, this growth rate is the highest since 2014. In fact, these figures are double the growth rate observed in the first half of 2023.
Gross domestic product (GDP) growth was also better than expected, mainly due to a 4% increase in real consumer spending from July to September. Consumer spending alone contributed 2.69% to the final GDP figure.
In addition, robust government spending at the federal, state and local levels played a critical role in the strong GDP performance:
- Federal spending rose 6.2%,
- National defense spending rose 8%,
- State and local government spending was up a substantial 3.7%.
In total, government spending at all three levels contributed 1.5% to the overall growth rate. The BEA data indicate that the acceleration in real GDP was the result of an increase in private inventory investment, a surge in exports, and an increase in residential fixed investment.
In addition, personal consumption expenditures (PCE) prices rose from 2.5% to 2.9%, while core PCE, which excludes the volatile energy and food components, fell to 2.4%, better than the 3.7% expected in the prior quarter.
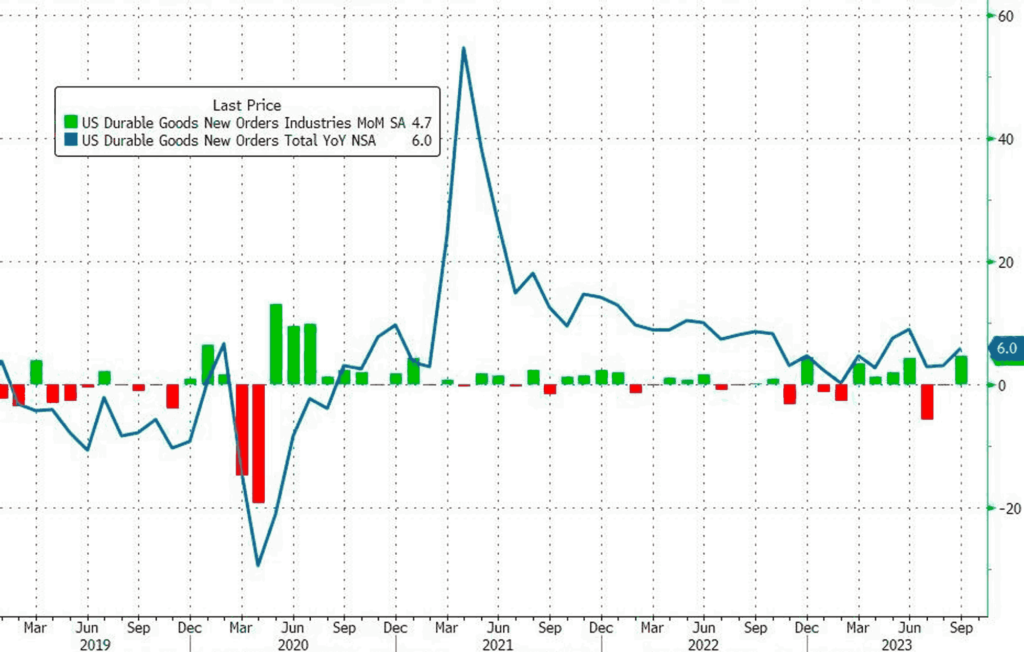
Concurrent with the GDP release on October 26th, the Census Bureau released two reports: durable goods orders rose 4.7% in September, beating the consensus estimate of 1.7%. Second, the trade deficit widened to $85.78 billion last month, according to the Census Bureau’s initial estimate.
On the financial front, the U.S. market partially recovered in pre-market trading on October 26, with major benchmark indices posting losses of up to 0.6%.
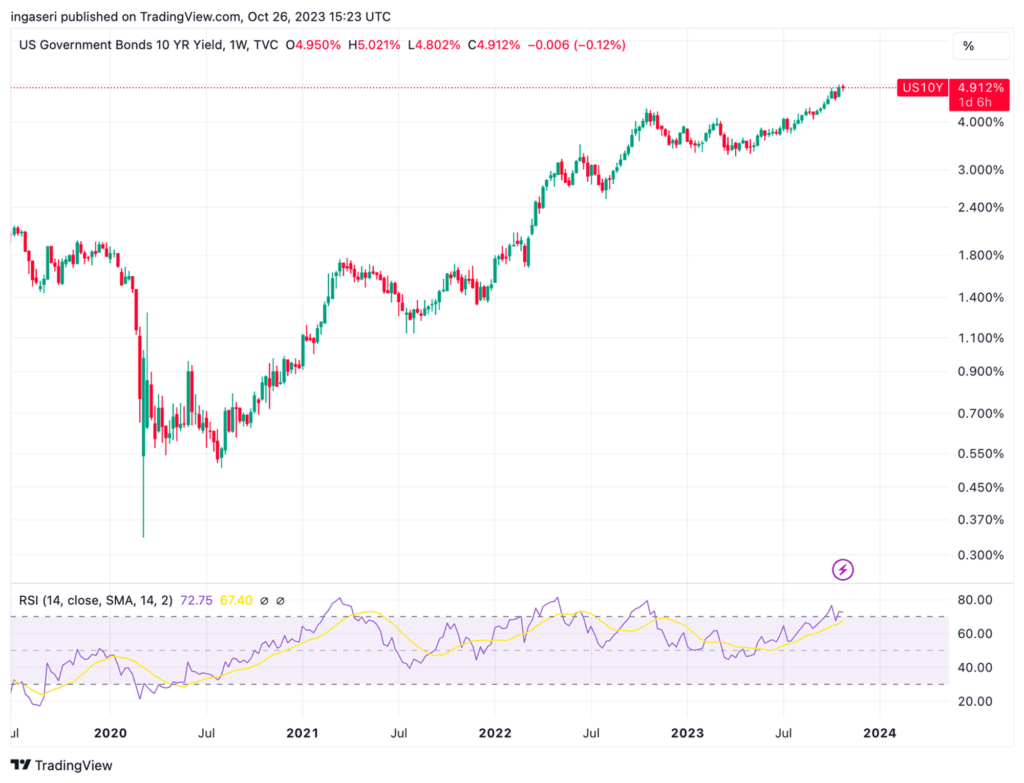
Bond yields were broadly lower, with the 10-year yield falling nearly 3 basis points to around 4.925 percent. The 2-year yield fell 2.5 basis points to below 5.1%, and the 30-year yield fell more than 2 basis points to below 5.07%.
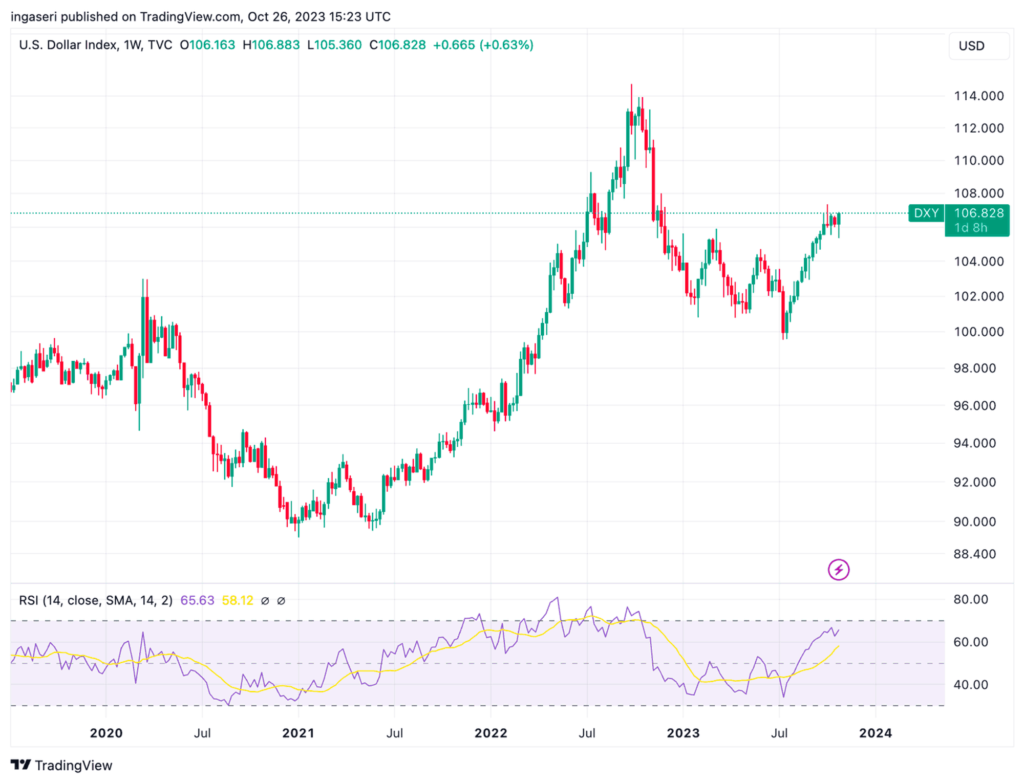
The U.S. Dollar Index (DXY), which measures the greenback against a basket of currencies, rose 0.2% to 106.82.
Turning to the unemployment claims data, the Department of Labor reported last week that jobless claims rose by 10,000 to 210,000 for the week ending October 21st. It is important to note that the prior week had seen the lowest level of jobless claims in eight months.
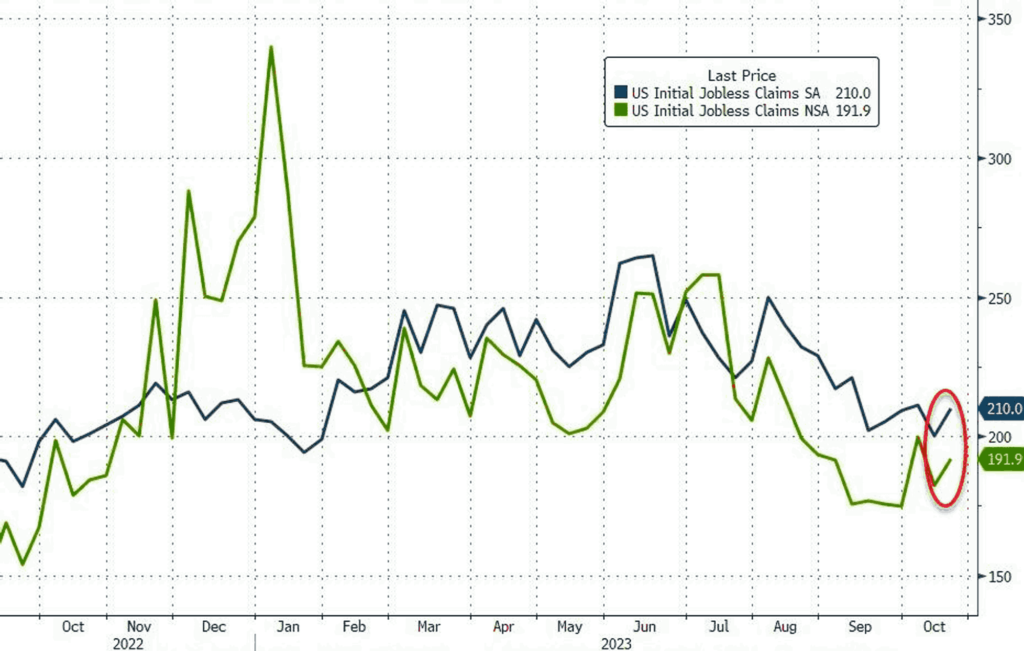
The low level of jobless claims indicates that employment conditions remain strong, which may signal that economic growth will not slow in the fourth quarter. Therefore, the Federal Reserve may need to consider further interest rate hikes.
The low level of jobless claims suggests a lack of layoffs. Conversely, a continued rise in claims could indicate a potential slowdown in hiring.
Looking at the four-week moving average of claims, which helps smooth out some of the week-to-week volatility, claims rose slightly by 1,250 to 207,500.
BTC & ETH Price Analysis
BTC rose 13% over the week to $35K, surpassing multiple critical technical and on-chain price levels that were clustered around $28,000. This development is a noteworthy demonstration of strength. The total crypto market rose 9% to 1.26 Trillion USD this week.
The move was influenced by activity in the derivatives markets, including two short squeezes that led to the liquidation of 60,000 BTC worth of futures positions, along with a significant increase of $4.3 billion in open interest for options calls.
Profit seekers in the BTC market seized the opportunity to lock in recent gains on Wednesday, causing the cryptocurrency to retreat from its recent peak above $35K. This decline occurred in anticipation of the Fed Chair upcoming speech.
Long-term investors appear unfazed by the price fluctuations seen this week. The supply held by long-term holders has reached new all-time highs, and the levels of revived supply volumes remain inconsequential.
The current support level for BTC is at the psychological level of $30,000, with resistance at $34,000.
Last week, ETH surpassed the $1,730 mark, putting more than 61% of holders in a profitable position. With the market maintaining a positive sentiment, ETH holders showed no tendency to engage in massive selling activity. In addition, open interest increased, indicating traders’ willingness to navigate the increased market volatility. This metric experienced a rapid increase of $400 million in just a few hours, reaching a current total of $5.7 billion.
However, it’s important to note that any bad news could trigger a massive liquidation, especially as ETH whales have shown little interest as ETH has failed to break above $1,860. Indicators showed a significant drop of $2.5 billion in whale transfers last week. In addition, since October 23rd, the exchange’s net flow has shifted positively, reflecting a significant increase in deposits to exchanges compared to withdrawals. This could indicate further potential volatility.
It is important for investors to closely monitor the performance details of ETH vs. BTC. This performance comparison has reached its lowest point since April 2021, when BTC reached its early peak in the previous bull market at $65,000. If ETH continues to trade below this level, it is likely that it will underperform BTC.
On-Chain Analysis
- 📊 Exchange: As the exchange reserve continues to rise, it indicates higher selling pressure. Net deposits on exchanges are low compared to the 7-day average. Lower deposits can be interpreted as lower selling pressure.
- 💻 Miners: Miners’ are selling holdings in a moderate range compared to its one-year average. Miner’s revenue is in a moderate range, compared to its one-year average.
- 🔗 On-Chain: More investors are selling at a profit. In the middle of a bull market, it can indicate a market top. Long term holders’ movement in the last 7days was lower than the average. They have a motive to hold their coins. Investors are in an anxiety phase where they are currently in a state of moderate unrealized profits.
- 🏦 Derivatives: Long position traders are dominant and are willing to pay to short traders. Selling sentiment is dominant in the derivatives market. More sell orders are filled by takers. As open interest increases, it indicates more liquidity, volatility, and attentio n are coming into the derivative market. The increasing trend in open interest could support the current ongoing price trend.
- 🔀 Technicals: The relative strength index (RSI) indicates an overbought condition where 94.00% of price movement in the last 2 weeks have been up and a trend reversal can occur. Stochastic indicates a neutral condition where the current price is in a moderate location between the highest-lowest range of the last 2 weeks.
News About Altcoins
- The launch of Arbitrum Orbit for crypto transaction efficiency. Arbitrum has announced the launch of Orbit on the mainnet, enabling the creation of smart contracts with Rust, C and C++, while remaining compatible with EVM. This innovation aims to reduce the cost of gas for complex crypto transactions. The Orbit chain will also automatically adopt enhancements from Arbitrum Nitro without requiring DAO approval, opening up opportunities for permissionless verification and further cost reductions.
- The POL token upgrade is now live and operational on the Ethereum mainnet. The latest version of the POL token has been successfully implemented, running seamlessly in conjunction with the release of Polygon 2.0. This pivotal development marks a significant stride towards scaling Ethereum and solidifying its position as the Value Layer of the Internet. The POL token facilitates the support of an expansive ecosystem consisting of ZK-based L2 chains through its innovative native re-staking protocol. This protocol equips POL token holders with the ability to validate a variety of chains and fulfill diverse roles within each, thereby transforming the POL token into a highly productive asset.
- Chainlink is set to launch Staking v0.2. With the release of Chainlink Staking v0.2, stakers will have access to a range of innovative features designed to provide more control, enhanced security, and greater transparency. The launch of Chainlink Staking v0.2 is poised to propel the Chainlink ecosystem to new heights. The Unbonding Mechanism, liquid rewards, and a seamless transition for existing users are all set to transform the way staking operates, making it more accessible and secure than ever before.
News from the Crypto World in the Past Week
- Rising open interest in CME bitcoin futures challenges Binance. According to a report by @VetleLunde dated October 24, open interest in CME bitcoin futures has surpassed 100,000 BTC for the first time, with a net increase of 4,380 BTC on the 23rd. CME’s market share of bitcoin derivatives contracts has reached an all-time high of 25%, rapidly approaching Binance’s market share of 29%. Concurrent with the growth in open interest (OI), the annual premium for 1-month bitcoin futures has climbed to 13%, significantly higher compared to ETH.
Cryptocurrencies Market Price Over the Past Week
Cryptocurrencies With the Best Performance
- Injective Protocol (INJ) +51,76%
- THORChain +34,90%
- Gala +33,37%
- Neo (NEO) +30,72%
Cryptocurrencies With the Worst Performance
- Bitcoin Cash -1,55%
- Mantle (MNT) -1,42%
- Uniswap -1,39%
References
- Vetlunde, CME BTC futures OI has breached 100k BTC for the first time ever., X, accessed on 29 October 2023.
- Arbitrum, Arbitrum Orbit is mainnet-ready!, X, accessed on 29 October 2023.
- 0xPolygonLabs, The POL token upgrade is now live on Ethereum mainnet, X, accessed on 29 October 2023.
- ChainLinkGod, #Chainlink Staking v0.2 is launching later this year, X, accessed on 29 October 2023.
Share
Related Article


See Assets in This Article
0.0%
0.0%
0.0%
0.0%
0.0%
BTC Price (24 Hours)
Market Capitalization
-
Global Volume (24 Hours)
-
Circulating Supply
-