Market Analysis Sep 23rd, 2024: Technical Indicators Point to $67k Bitcoin Rally

Bitcoin holders are celebrating a recent surge in price, thanks to the Federal Reserve’s decision to lower interest rates. While the cryptocurrency has seen a positive uptick, it’s still facing challenges in breaking through key resistance levels to secure a strong close for September.
As usual, the Pintu trading team has gathered critical information and analyzed the general economic situation and the crypto market’s movements over the past week. However, it should be noted that all information in this Market Analysis is intended for educational purposes, not as financial advice.
Market Analysis Summary
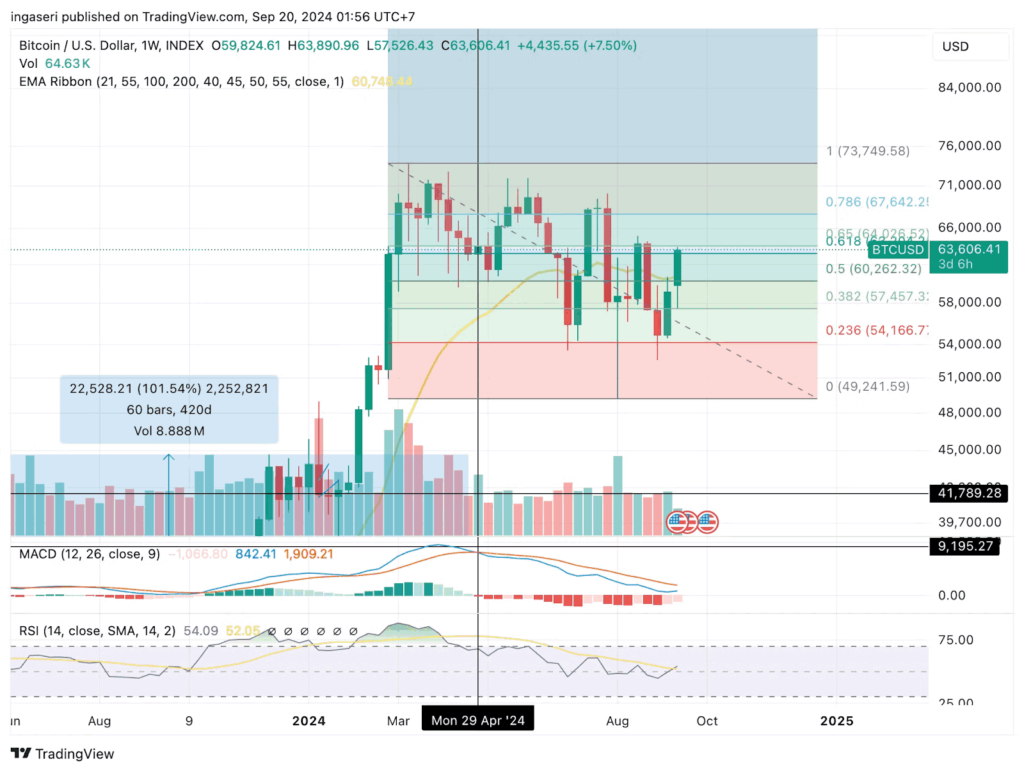
- 📝 BTC gets rejected in the Fibonacci golden ratio as resistance, crossing this area will make BTC spring towards the 67K price point.
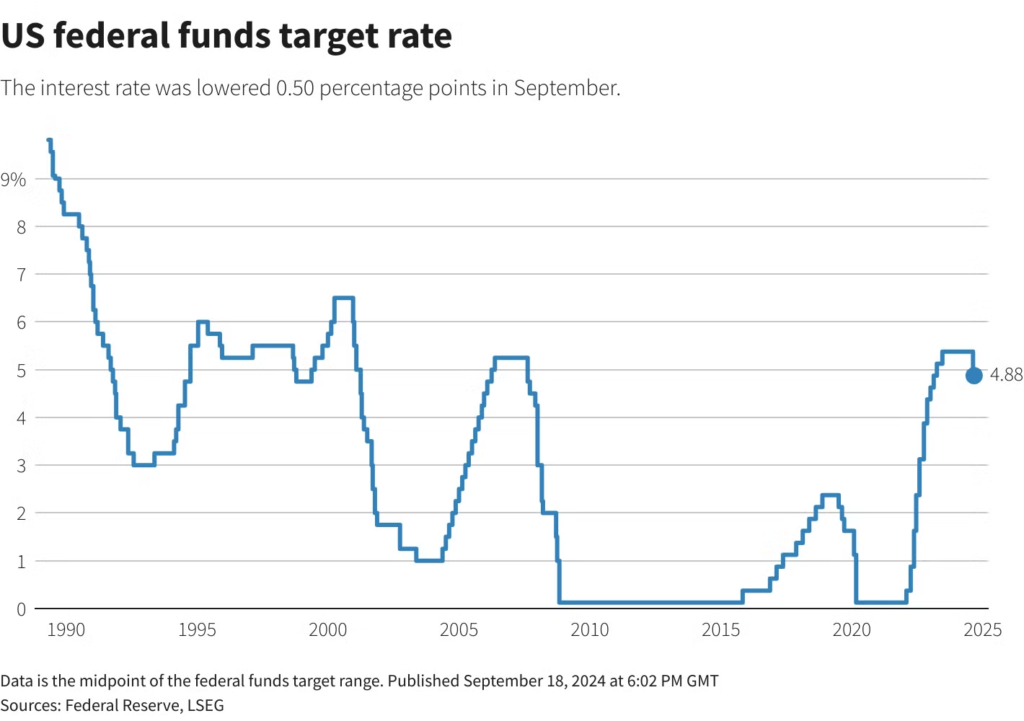
- 🟢 The Fed cuts interest rates for the first time since March 2020 with a significant half-point reduction.
- 📈 Consumer sentiment reached its highest level since May 2024, marking the second consecutive monthly increase and rising by about 2% from August.
- ✅ New York Federal Reserve’s Empire State business conditions index soared by 16.2 points in September, reaching 11.5, the first positive reading since last November.
Macroeconomic Analysis
Fed Interest Rate
The Fed slashed interest rates for the first time since March 2020 with a significant half-point reduction. This cut is expected to lower borrowing costs for mortgages, credit cards, and other loans.
The decision marks a key moment in the Fed’s battle against inflation, which had kept rates at a 23-year high for over a year. Following the announcement, stock markets experienced some volatility. The half-point cut, though not unanimously agreed upon, signals the Fed’s urgency to provide swift economic relief from high borrowing costs. In recent days, there were strong calls for the central bank to make a decisive start to the rate-cutting cycle.

Other Economic Indicators
- Michigan Consumer Sentiment: Consumer sentiment reached its highest level since May 2024, according to the preliminary September report of the Michigan Consumer Sentiment Index. The index increased by 1.1 points (1.6%) from August’s final figure, rising to 69.0, surpassing the expected forecast of 68.3. This improvement was mainly driven by better buying conditions for durable goods, with consumers seeing prices as more favorable.
- NY Empire State Manufacturing Index: New York’s manufacturing sector experienced growth this month, as the New York Federal Reserve’s Empire State business conditions index soared by 16.2 points in September, reaching 11.5, the first positive reading since last November. Economists had anticipated a continued contraction for the 11th straight month, with forecasts projecting a negative 3.9 reading.
- Retail Sales: Retail sales rose by 0.1% last month, following a revised 1.1% increase in July, according to the Census Bureau of the Commerce Department. Economists had predicted a 0.2% decline, following an initially reported 1.0% rise in July, with estimates ranging from a 0.6% drop to a 0.6% gain. On an annual basis, retail sales were up 2.1% in August.
BTC Price Analysis
BTC trading volume surged, following the Fed’s announcement of a 50 basis point interest rate cut.
The combination of high trading volume and the liquidity setup seen over the past six months could signal upcoming market volatility. The current spot volume is nearly 30% higher than the August daily average, suggesting stronger liquidity during recovery periods compared to sell-offs. Note that macro events like the Fed’s interest rate cut release the “pressure” that has built up, often leading to heightened market volatility.
Market inflows and outflows have muted, indicating Bitcoin has entered a state of “equilibrium.” Moreover, net realized profit and loss are balanced, while absolute realized profit and loss has decreased significantly since Bitcoin’s all-time high in March, reflecting low buy-side pressure and demand in the current price range.
The supply of BTC is also at a notably low level, with only 4.7% of the on-chain value held in these wallets, pointing to constrained supply. There is also increasing stablecoin supply, now at $160.4 billion, could potentially shift this dynamic by injecting purchasing power into the market.
Price rose 7.5% over the week and gets rejected in the Fibonacci golden ratio as resistance, crossing this area will make BTC spring towards the 67K price point.

On-Chain Analysis
- 📊 Exchange: As the exchange reserve continues to fall, it indicates lower selling pressure. Net deposits on exchanges are high compared to the 7-day average. Higher deposits can be interpreted as higher selling pressure.
- 💻 Miners: Miners’ are selling holdings in a moderate range compared to its one-year average. Miner’s revenue is in a moderate range, compared to its one-year average.
- 🔗 On-Chain: More investors are selling at a profit. In the middle of a bull market, it can indicate a market top. Long term holders’ movement in the last 7 days was lower than the average. They have a motive to hold their coins. Investors are in a belief phase where they are currently in a state of high unrealized profits.
- 🏦 Derivatives: Long position traders are dominant and are willing to pay to short traders. Buying sentiment is dominant in the derivatives market. More buy orders are filled by takers. As open interest increases, it indicates more liquidity, volatility, and attention are coming into the derivative market. The increasing trend in OI could support the current ongoing price trend.
- 🔀 Technicals: RSI indicates a overbought condition where 72.00% of price movement in the last 2 weeks have been up and a trend reversal can occur. Stochastic ndicates a neutral condition where the current price is in a moderate location between the highest-lowest range of the last 2 weeks.
News About Altcoins
- $CATI Token is Now Available on the PINTU App! The tap-to-earn game Catizen has launched its CATI token on the TON blockchain, with 150 million tokens, or 15% of the total 1 billion supply, distributed to users through an airdrop as part of Season 1, despite a two-month delay. The majority of the 340 million CATI tokens allocated for airdrops will be distributed through quarterly campaigns. With 39 million total users on the platform, Telegram continues to expand its crypto ecosystem through games like Catizen, Hamster Kombat, and Notcoin, which leverage the TON blockchain.
News from the Crypto World in the Past Week
- Nasdaq to List Options on BlackRock’s Bitcoin ETF. The U.S. Securities and Exchange Commission (SEC) has given Nasdaq the green light to list options contracts on BlackRock’s spot Bitcoin ETF, the iShares Bitcoin Trust, under the ticker symbol IBIT. This approval aligns options trading on the Bitcoin ETF with the established procedures for other ETF options. IBIT options must adhere to both initial and ongoing listing requirements. Bloomberg ETF analyst Eric Balchunas anticipates that more comparable offerings will receive regulatory approval in the coming months.
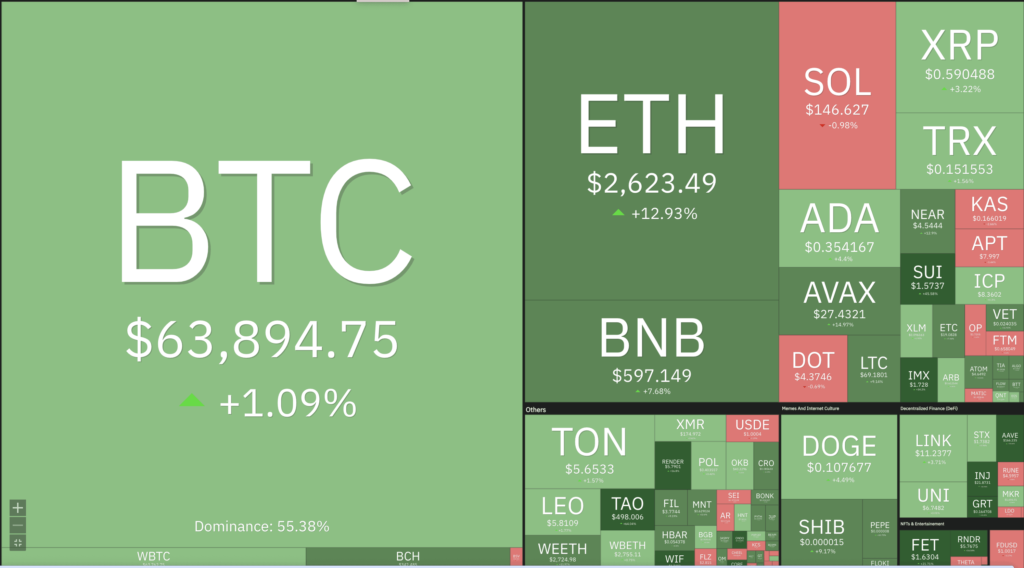
Cryptocurrencies Market Price Over the Past Week

Cryptocurrencies With the Best Performance
- Sui +37,83%
- Celestia +32,99%
- Fantom +28,72%
- Bittensor (TAO) +22,57%
Cryptocurrencies With the Worst Performance
- SATS -11,50%
- Helium -10,32%
- Maker (MKR) -8,91%
- Notcoin (NOT) -6,76%
References
- James Hunt, Telegram game Catizen’s token goes live for exchange trading amid community airdrop, theblock, accessed on 21 September 2024.
- Ryan S. Gladwin, ‘Catizen’ Telegram Game Reveals Airdrop Pass as CATI Token Launches, decrypt, accessed on 21 September 2024.
Share
Related Article
See Assets in This Article
0.0%
0.0%
0.0%
0.0%
0.0%
FTM Price (24 Hours)
Market Capitalization
-
Global Volume (24 Hours)
-
Circulating Supply
-


