Market Analysis Sep 4th 2023: BTC Drops Below 200 & 250-Day Moving Averages After Momentary Spike

The crypto market has yet to show any signs of recovery, especially with Bitcoin continuing its downward trend for the past three weeks. Historically, BTC prices have always performed poorly in September. So how is BTC performing this September? Read the analysis below.
The Pintu trading team has gathered critical information and analyzed the general economic situation and the crypto market’s movements over the past week. However, it should be noted that all information in this Market Analysis is intended for educational purposes, not as financial advice.
Market Analysis Summary
- 🟢 Data from the U.S. Bureau of Labor Statistics shows a decline in job opportunities for the first time since 2021, falling below nine million. This decline is consistent with an increase in layoffs, but is viewed positively by the Federal Reserve as a step toward fighting inflation.
- 📈 Inflation, as measured by personal consumption expenditures (PCE), has risen to 3.3% per year.
- ⬇️ U.S. trade shows a deficit of $91.2 billion in July.
- 👥 The U.S. unemployment rate rose slightly to 3.8%, but an additional 736,000 people actively looked for work, which is seen as a positive sign.
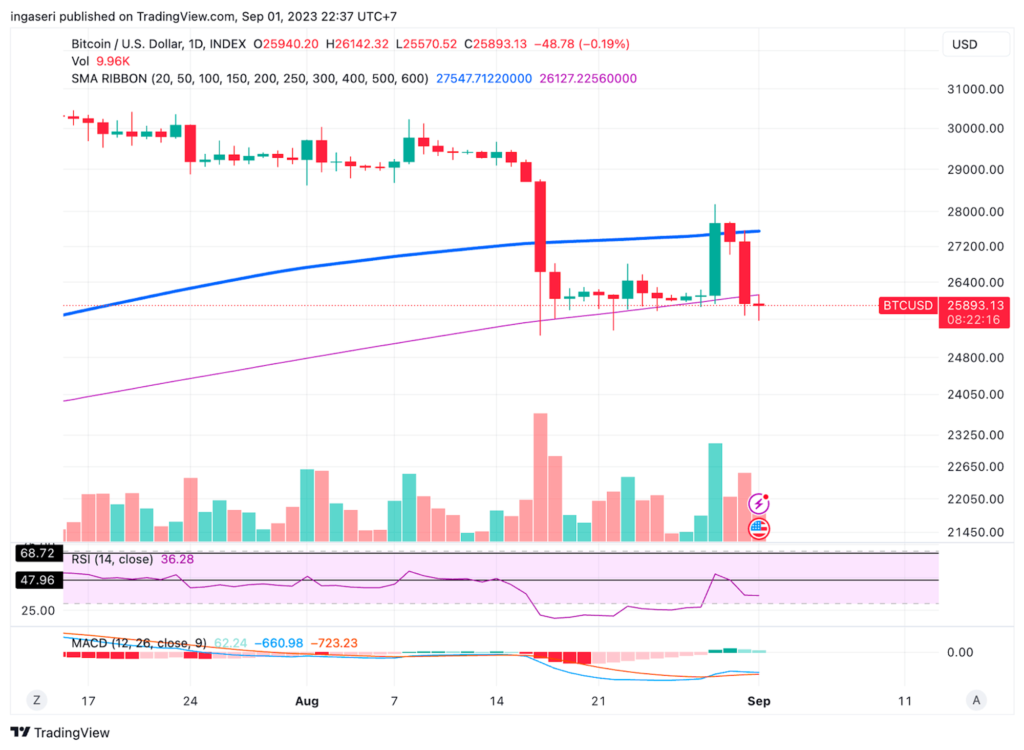
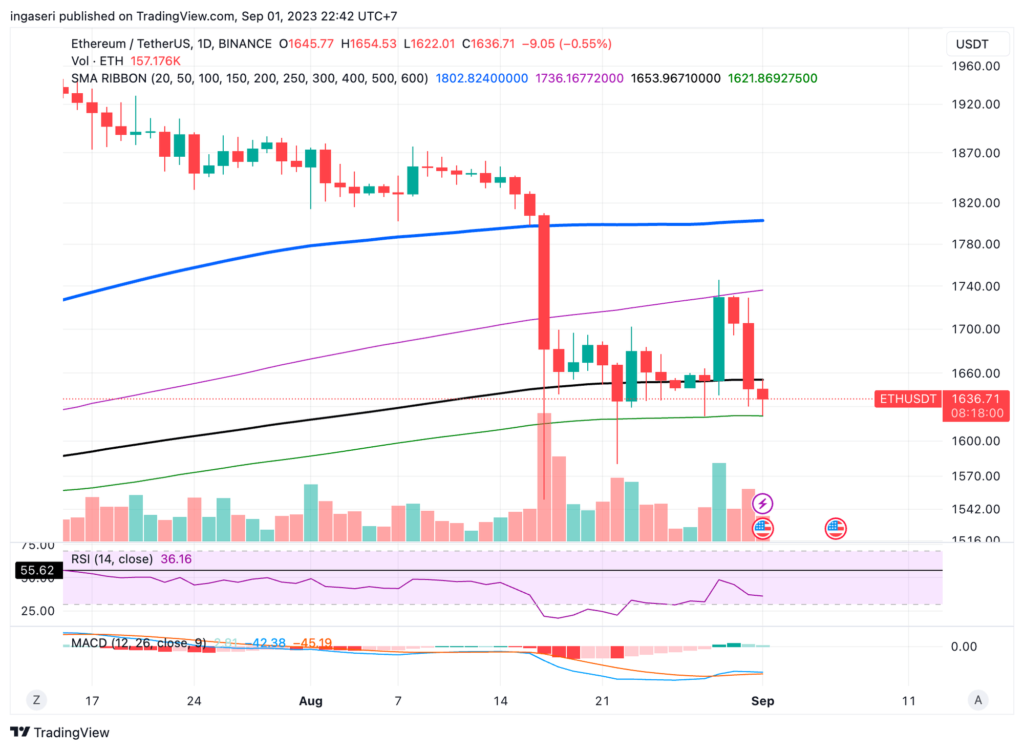
- ✍🏻 Bitcoin (BTC) and Ethereum are in a bearish trend. BTC rallied briefly, but then fell back below its 200 and 250 day moving averages. ETH faces its strongest support at $1620.
Macroeconomic Analysis
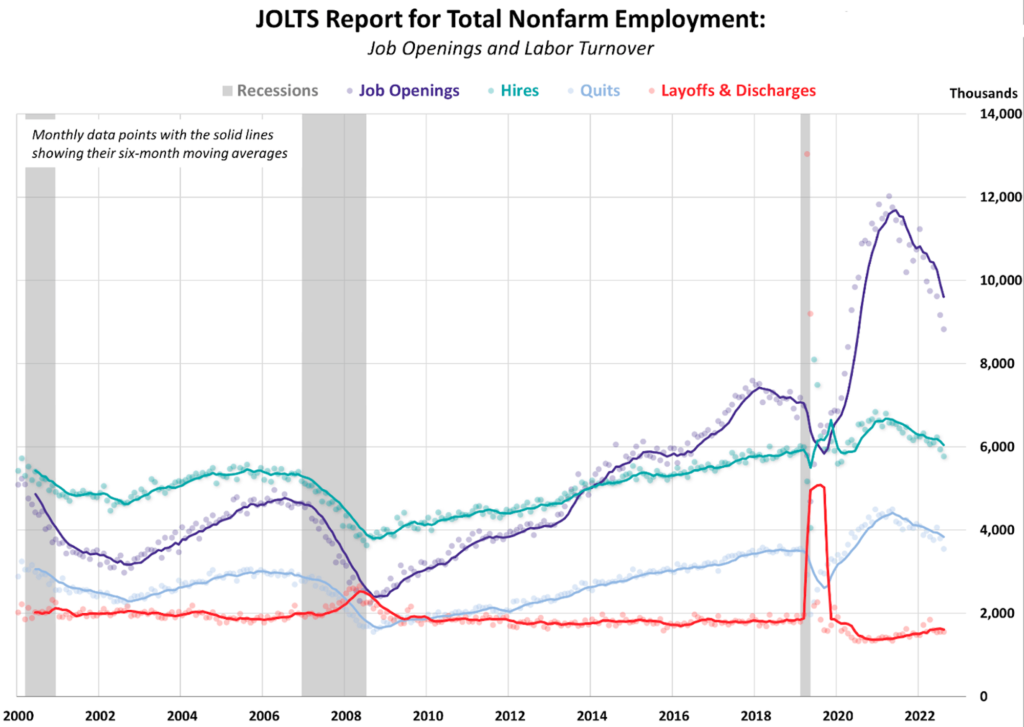
According to the latest data released by the Bureau of Labor Statistics last Tuesday, the number of job openings in the United States fell for the third consecutive month, dropping below 9 million for the first time since early 2021. In addition, fewer workers are choosing to quit their jobs, fewer companies are hiring, and layoffs have increased slightly. This indicates a shift toward more stable and balanced conditions in the U.S. labor market.
According to the BLS’s Job Openings and Labor Turnover Survey (JOLTS), job openings fell to a seasonally adjusted 8.827 million in July, down from 9.165 million in June and below the expected 9.465 million. This is the smallest total number of job openings since March 2021, resulting in a ratio of 1.5 job openings per unemployed person.
The U.S. jobs data was well received by the Federal Reserve, which continues to seek a tighter labor market to combat inflation. Inflationary pressures can arise from an imbalance between the supply and demand for labor, which can lead to wage increases. To curb rising prices, the central bank has even raised interest rates to dampen demand.
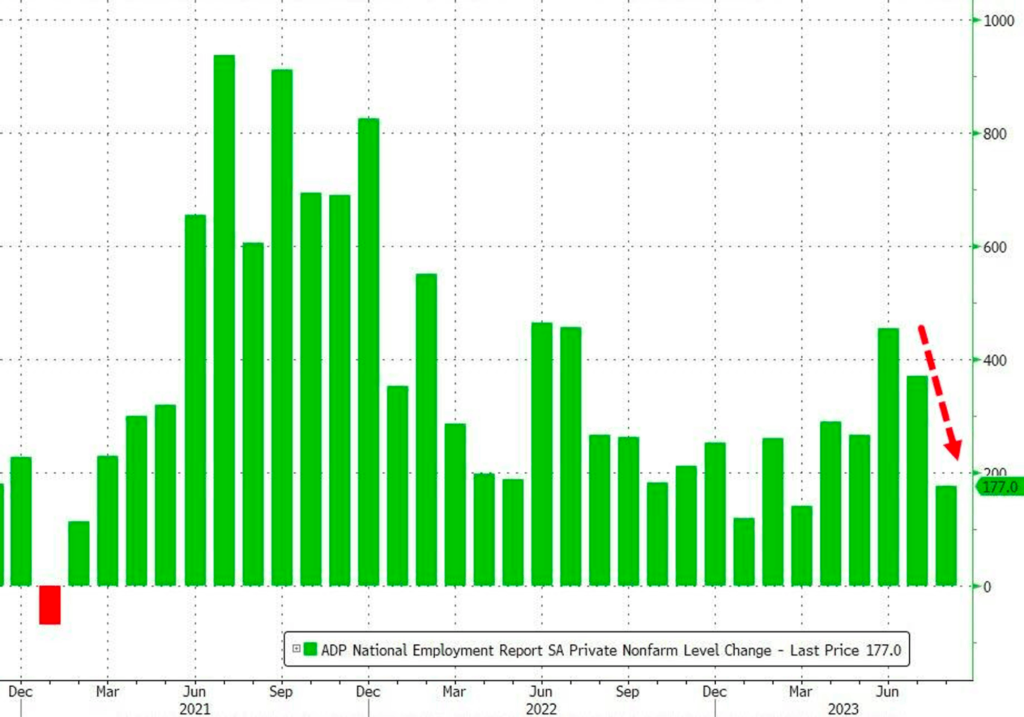
The slowing momentum in the labor market is also evident in the weaker-than-expected growth in U.S. private payrolls. According to the ADP National Employment Report released on Wednesday, private payrolls increased by 177,000 positions last month. This figure falls short of the 195,000 new jobs economists had forecast. However, revised data for July paints a more positive picture, showing an increase of 371,000 jobs, higher than the previously reported 324,000.
In addition, job openings reached a two-and-a-half-year low in July, indicating that the labor market remains tight. Faced with recruiting challenges amid the COVID-19 pandemic, most employers are opting to retain their existing workforce.
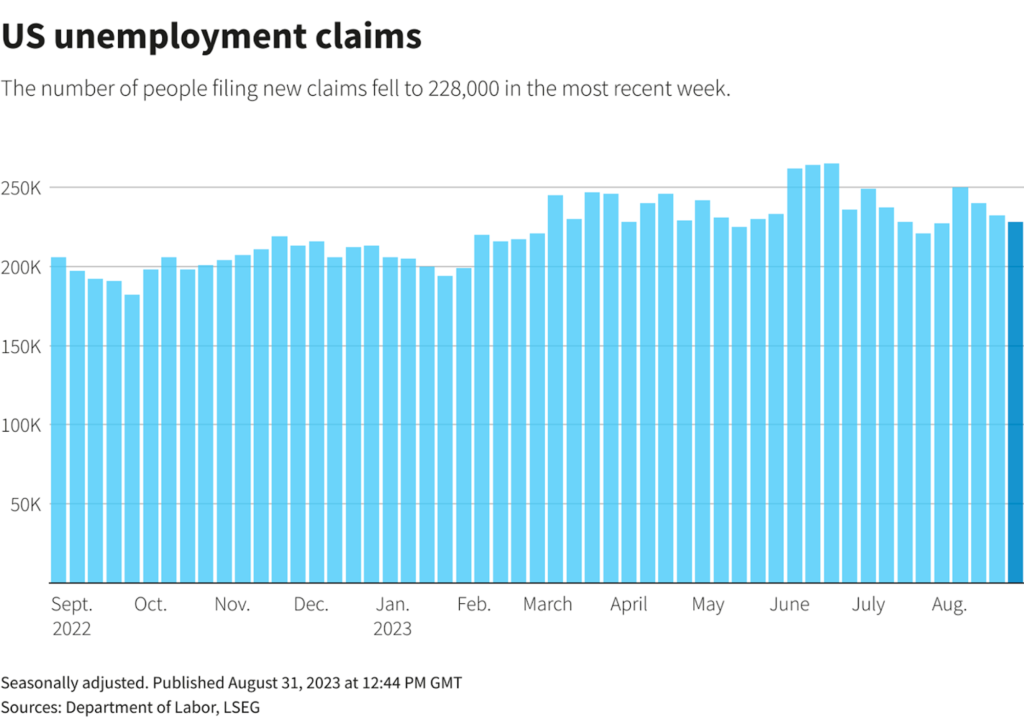
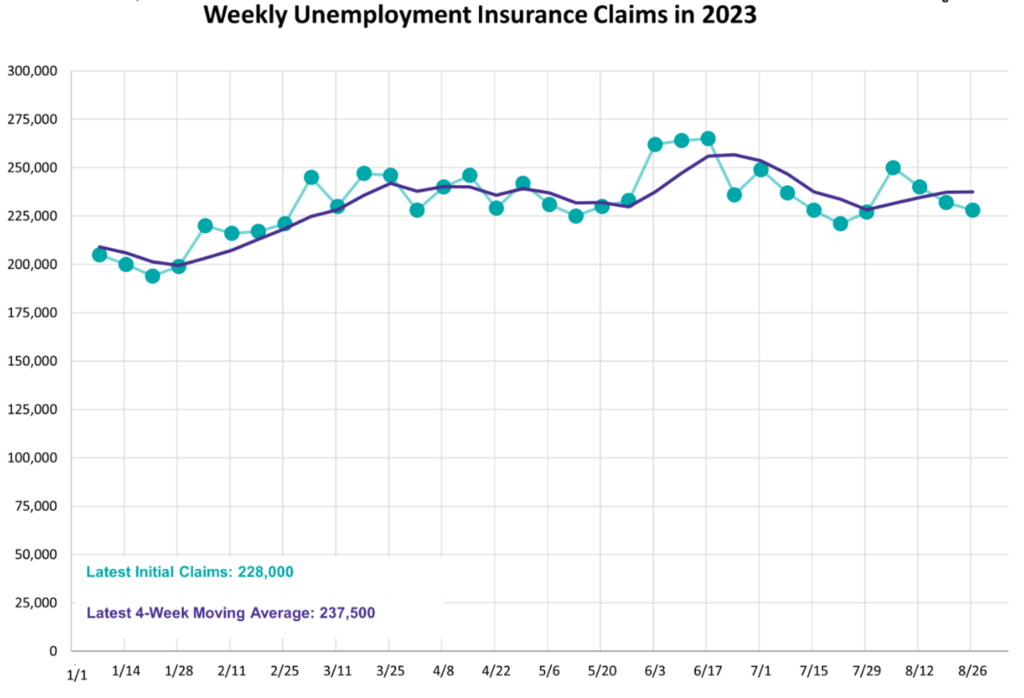
A separate report from the Labor Department on Thursday showed that initial claims for state unemployment benefits fell by 4,000 to a seasonally adjusted 228,000 for the week ended August 26. Economists had forecast 235,000 claims for last week.
The four-week moving average for claims, which smooths out some of the weekly fluctuations, increased by 250 to 237,500. Initial claims are considered a proxy for the number of layoffs that occurred in a given week.
Continuing jobless claims rose by 28,000 to 1.73 million, above the prior estimate of 1.71 million.
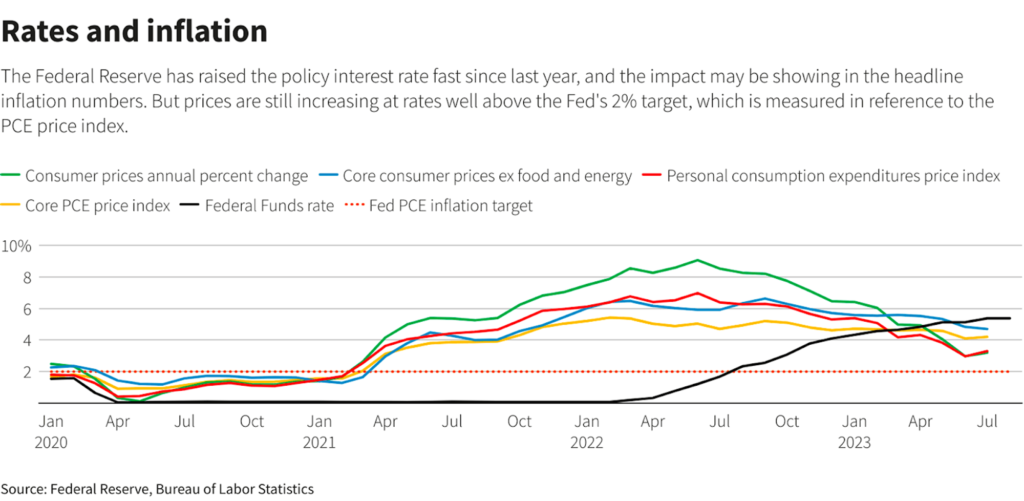
Inflation in the U.S., as measured by the Personal Consumption Expenditures (PCE) index, also rose to an annual rate of 3.3% in July. This increase is in line with market forecasts. The core PCE annual rate, the Federal Reserve’s preferred measure of inflation, rose 4.2%, a slightly stronger rate than the 4.1% increase in June. As expected, both the PCE price index and the core PCE price index increased 0.2% on a monthly basis.
Additional findings from the report indicate that personal income increased by 0.2%. Meanwhile, consumer spending, which accounts for more than two-thirds of U.S. economic activity, rose 0.8%. Slightly revised data for June showed that spending rose 0.6%, up from the previously reported 0.5%. Economists had forecast a 0.7% increase in spending.
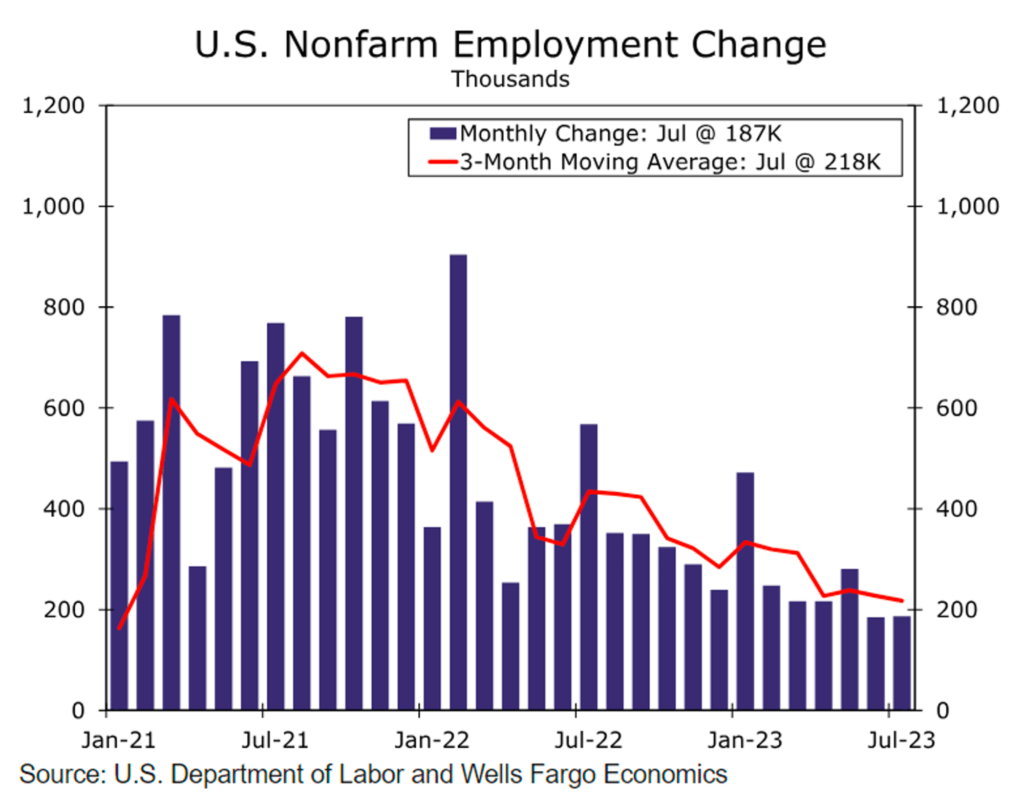
U.S. companies added 187,000 jobs in August, pointing to a slowing but still robust labor market as the Federal Reserve implements higher interest rates.
From June through August, the economy added 449,000 jobs, the lowest three-month total in three years. In addition, the U.S. government revised job gains for June and July down by 110,000.
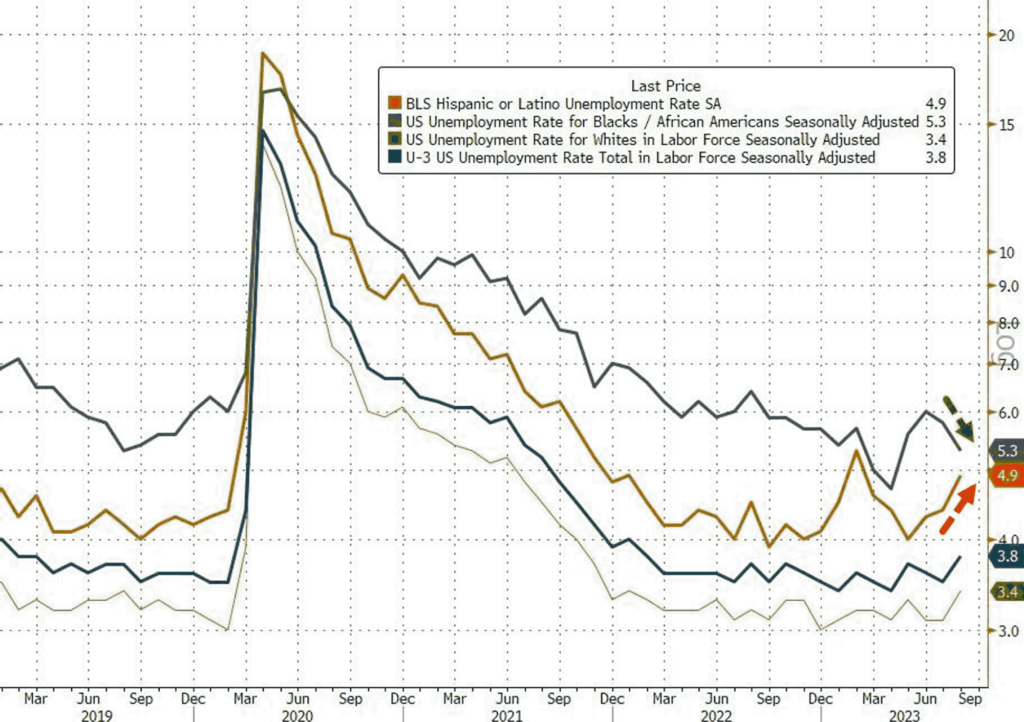
Still on the topic of the labor market, the latest report from the Department of Labor shows that the unemployment rate rose from 3.5% to 3.8%, marking the highest level since February 2022. While this may seem low, there is a bright side: 736,000 people have started actively looking for work. It’s worth noting that only people who are actively looking for work are counted as unemployed.
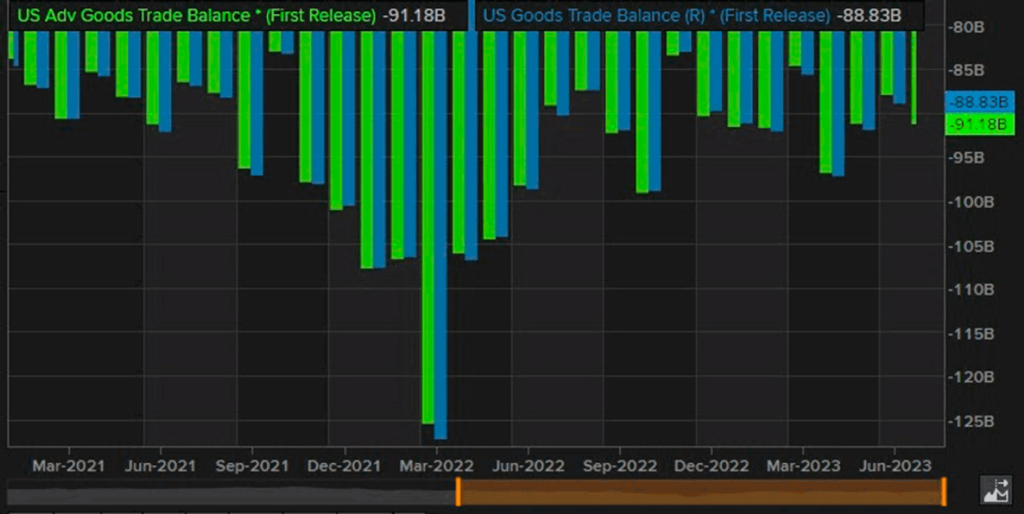
On the trade front, the U.S. goods trade deficit widened 2.6% to $91.2 billion in July. It was previously reported at $87.84 billion, but was revised to $88.8 billion for June. Despite the deficit, both imports and exports increased in July, as follows:
- Exports increased from $162.4 billion to $164.8 billion, up $2.4 billion from June.
- Imports reached $256.0 billion compared to $251.3 billion in June, an increase of $4.7 billion from June.
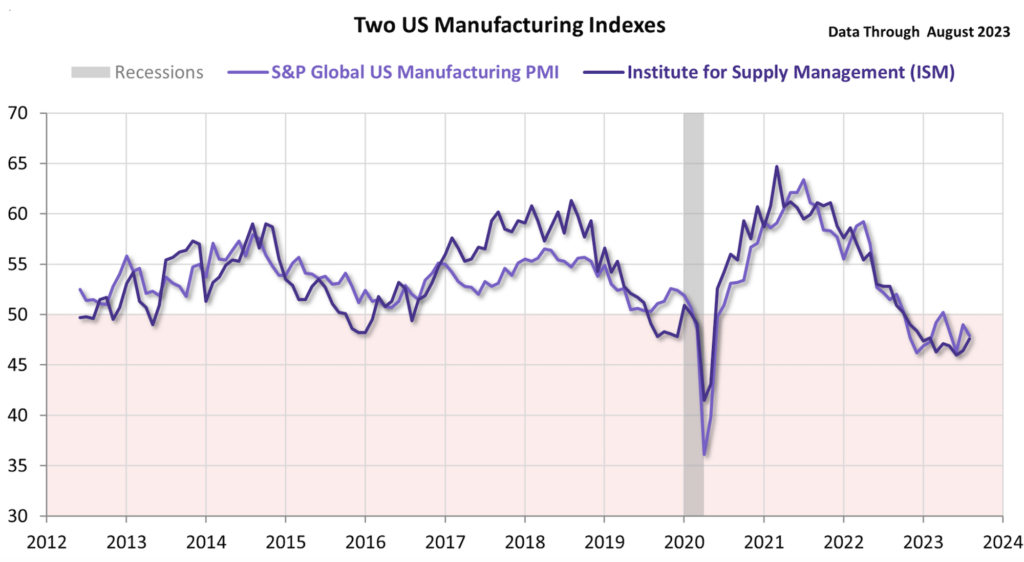
On the manufacturing front, the U.S. Global S&P Manufacturing Purchasing Managers’ Index (PMI) fell to 47.9 in August from 49.0 in July. However, the August reading was above expectations of 47.0.
The Institute for Supply Management released its ISM Manufacturing PMI report for August on September 1st. According to the report, the ISM Manufacturing PMI rose from 46.4 in July to 47.6 in August, beating the analyst consensus of 47. A reading below 50 indicates contraction in the manufacturing sector.
BTC & ETH Price Analysis
BTC is also still in a downtrend, falling 0.7% last week. Although there was a brief spike above the 200-day moving average, driven by the news of Grayscale’s victory in the SEC lawsuit regarding bitcoin ETF reviews, BTC fell back below the 200 & 250-day moving averages by the end of the week.
The price of ETH was rejected by the 250-day moving average before falling between the 300 and 400-day moving averages. The strongest current support for ETH is at the $1620 price level. A break below the $1620 support level could lead to a deeper decline with the next support area at $1400.
On-Chain Analysis
- 📊 Exchange: As the exchange reserve continues to fall, it indicates lower selling pressure. Net deposits on exchanges are high compared to the 7-day average. Higher deposits can be interpreted as higher selling pressure.
- 💻 Miners: Miners’ are selling holdings in a moderate range compared to its one-year average. Miner’s revenue is in a moderate range, compared to its one-year average.
- 🔗 On-Chain: More investors are selling at a profit. In the middle of a bull market, it can indicate a market top. Long term holders’ movement in the last 7days were lower than the average. They have a motive to hold their coins. Investors are in a fear phase where they are currently with unrealized profits that are slightly more than losses.
- 🏦 Derivatives: Long position traders are dominant and are willing to pay to short traders. Selling sentiment is dominent in the derivatives market. More sell orders are filled by takers. As open interest increases, it indicates more liquidity, volatility, and attention are coming into the derivative market. The increasing trend in open interest could support the current ongoing price trend.
- 🔀 Technicals: Relative Strength Index (RSI) indicates a neutral condition. Stochastic indicates a neutral condition where the current price is in a moderate location between the highest-lowest range of the last 2 weeks.
News About Altcoins
- Mantle, a pioneering Web3 platform built on top of Ethereum’s Layer 2 Mantle network, has launched Mantle Journey, an innovative incentive program designed to increase community engagement across the Mantle ecosystem. The program features a unique digital identity token called the Mantle Journey Soulbound Token (MJSBT) and uses a community engagement index to measure user contributions both on and off the chain. The program launches with a prize pool of $20 million MNT and additional bonuses. Mantle Journey aims to deepen user engagement by offering a mix of on-chain and off-chain rewards. This initiative sets a new standard for user engagement in the layer 2 blockchain space by connecting social media profiles to blockchain identities and utilizing a mileage-based reward structure.
- Uniswap Labs has announced that the next version of its decentralized exchange, Uniswap v4. V4 will be launched following the completion of the Ethereum London upgrade, which is currently in the testnet phase. The upcoming v4 release will continue to build on Uniswap V3’s concentrated liquidity framework and introduce a number of new features. These include hook functionality, singleton contracts, flash accounts, integrated ETH support, compatibility with ERC-1155 accounts, improved governance capabilities and a new donation feature. These enhancements are designed to increase the platform’s flexibility and ability to integrate with other protocols.
News from the Crypto World in the Past Week
- OpenSea has submitted two Ethereum enhancement requests (ERC-7496 and ERC-7498) and two Seaport enhancement requests (SIP-14 and SIP-15) to develop an ecosystem for redeemable NFTs. These unique NFTs offer the ability to be exchanged for other on-chain or off-chain items. OpenSea has initiated a proof-of-concept testing phase where users can create “Baby Burn” eggs through OpenSea’s Drop page, which can then be destroyed in exchange for a “Burnie”. OpenSea aims to extend this on-chain exchange functionality to all content creators and intends to broaden the standard for on-chain exchange.
- In an OTC (over-the-counter) scam that affected multiple teams and investors, the $GBOT team lost a significant amount of money. A scammer posing as a high net worth individual interested in purchasing 2500 $GBOT tokens ($200,000) successfully convinced the team to proceed with the transaction. Both parties selected a trusted escrow agent to handle the transaction. The fraudster proved ownership of his address by sending small test transactions and used social engineering tactics to trick the escrow agent into thinking he had sent 116.2 ETH as payment. Fooled by the ruse, the escrow released the $GBOT tokens to the scammer, who immediately sold them for 54 ETH ($90,000). The scam has caused quite a stir in the Arbitrum space and serves as a cautionary tale for OTC transactions.
Cryptocurrencies Market Price Over the Past Week
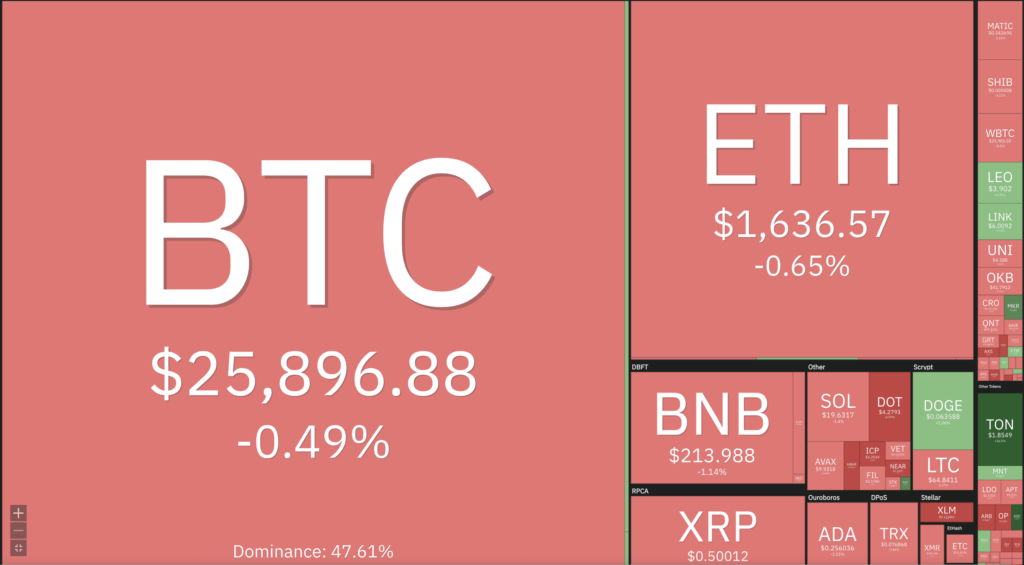
Cryptocurrencies With the Best Performance
- MIOTA (IOTA) +12.74%
- THORChain +10.63%
- Maker (MKR) +8.74%
- Mantle (MNT) +4.63%
Cryptocurrencies With the Worst Performance
- Sui (SUI) -14.63%
- Hedera -13.77%
- GMX (GMX) -10.66%
- Optimism -10.15%
References
- Lidia Yadlos, Mantle Unveils the ‘Mantle Journey’: 20 Million $MNT Reward Pool in Season Alpha, Blockster, accessed on 3 September 2023.
- Ryan Ghods, OpenSea’s open standard and roadmap for redeemable NFTs, Opensea, accessed on 3 September 2023.
- Hayden Adam, Our Vision for Uniswap v4, Uniswap, accessed on 3 September 2023.
- AmirOrmu, There has been an ongoing OTC scam recently, which has affected many legit teams and whales, X, accessed on 3 September 2023.
Share
Related Article
See Assets in This Article
BTC Price (24 Hours)
Market Capitalization
-
Global Volume (24 Hours)
-
Circulating Supply
-
