Market Insights: 6-12 February 2022

Bitcoin (BTC) Price Movement
Over the past week, we have seen an increase in the price of BTC indicating a breakout of the downward trend since November 2021. We have seen BTC rise from the $37k range to almost $46K on 10 February before settling on the current price of 42K range.
From a technical analysis perspective, which can be seen in the chart below, BTC managed to break above the 21 (yellow line) and 55 days EMA (orange line), only to be resisted by the 100 days EMA (red line), and then back to be below the 55 days EMA.
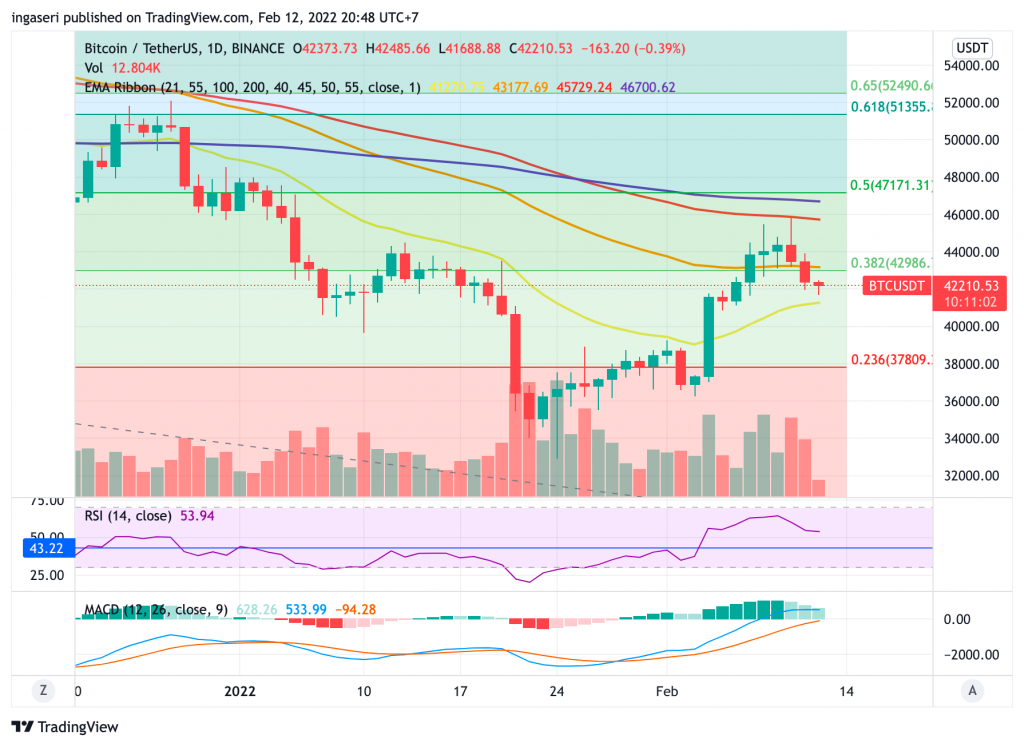
💡 Exponential Moving Average is an indicator that shows the movement of asset prices when averaged over a certain period of time. For example, the 21-day EMA shows the average line of price movement over the last 21 days. This makes it easier for traders to see price trends.
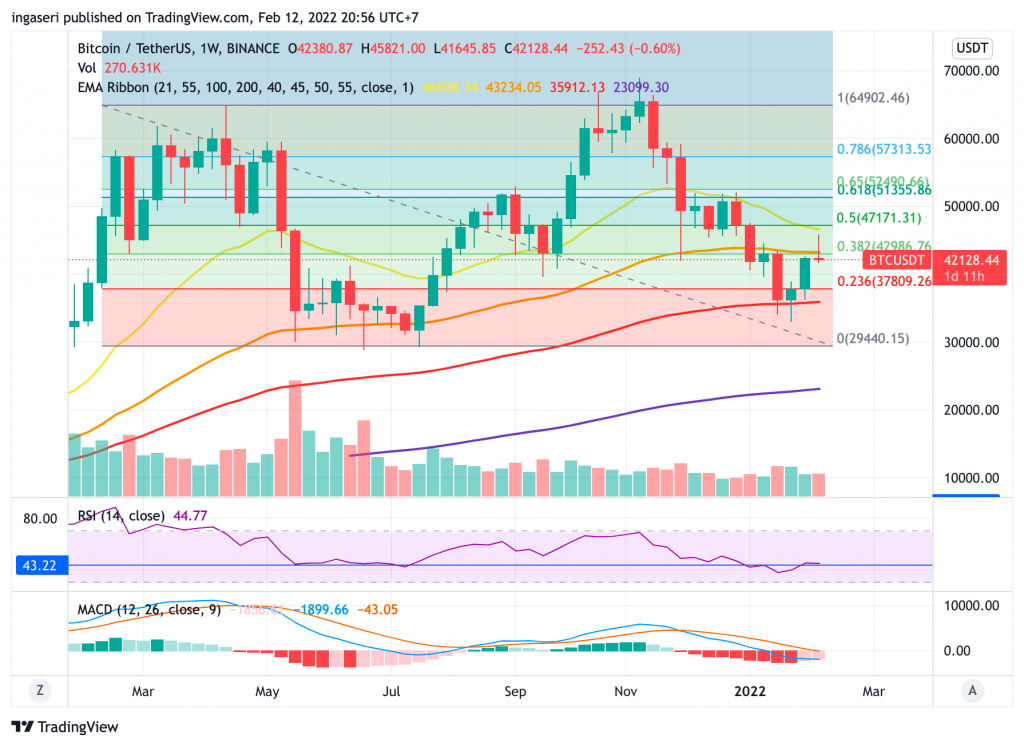
On the longer-term analysis, that is the weekly chart, we have seen the candle break out the 55 weeks EMA, nearly closing in the 21 weeks EMA. What was seemingly impossible last week (closing in 21 weeks EMA), seemed plausible. However, when the Consumer Price Index (CPI) data got out that inflation is at 7.5%, it retraced down below the 55 weeks EMA.
What is behind this BTC price movement?
- 📈 Consumer Price Index Inflation Data: The first thing that affected the movement of BTC price was inflation data from the Consumer Price Index (CPI), which was higher than expected. Many predict that interest rates could rise by more than 1.75% by the end of the year to contain inflation. This can also indicate a potential weakening in the value of risky assets.
- 🚩 Fed Emergency Meeting: The Fed (Central Bank of the United States of America) has also announced an emergency meeting on Monday, which indicates a very hawkish signal to the market as a whole, or a market signal for a tightening/contractive monetary policy.
- 😥 The potential threat of invasion of Ukraine by Russia: The threat of invasion of Ukraine by Russia has the potential to cause risk-off or conditions when investors and traders are more dominant to avoid risk by selling assets that are considered risky. This has the potential to lower stock and crypto prices and drive up commodity prices.
What else should we pay attention to from last week’s market movements?
- 📊 Another interesting chart to look at is the Adjusted Bitcoin Supply Shock. In the Adjusted Bitcoin Supply Shock, there is a convergence between price action and demand for investors, meaning that when BTC prices decline again, there is a movement of long-term BTC holders to accumulate BTC.
- 💵 Another on-chain data worth noting is the huge influx of stablecoins into the exchange over the last few weeks. This could mean lots of people moving stablecoins as collateral for exchanges or lots of people getting ready to accumulate crypto assets.
What’s new in the cryptocurrency industry?
- 🎞 Netflix to Produce Documentary About Bitfitnex Case: The team behind “Tiger King” and Fyre Festival documentary “FYRE” join forces to produce a new series for Netflix based on the true story of Ilya “Dutch” Lichtenstein and Heather Morgan, who were arrested this week and was charged with conspiring to launder about $4.5 billion in Bitcoin.
- 💰 Polygon (MATIC) Raised $450M Funding: Polygon raised $450m in funding in a recent funding round led by Sequoia Capital India as well as an investment from SoftBank’s Vision Fund 2. This funding round brings Polygon’s public valuation to $20 billion.
Reference
- Decrypt. Bitfinex Hack and Bitcoin Laundering Scheme Coming to Netflix. Accessed on 14 February 2022.
- Reuters. Polygon raises $450 mln from Sequoia Capital India, SoftBank Vision Fund 2, others. Accessed on 14 February 2022.
Share