What Is Money Flow in Crypto?

In the fast-paced world of crypto, many traders and investors tend to focus solely on price and trading volume, overlooking one crucial indicator: money flow. This indicator reveals the movement of funds entering or leaving an asset, helping to gauge the strength of buying interest and selling pressure. By understanding money flow, traders can distinguish between a healthy price rally and one driven merely by shallow speculation, allowing them to build smarter and more focused trading strategies.
Article Summary
- 💸 Money Flow: An indicator used to measure the flow of capital moving in and out of a crypto asset or network.
- 📊 Importance of Money Flow: A metric that provides additional insights for analyzing market movements.
- 🚀 Strategies Using Money Flow: Money Flow can be combined with other indicators or price chart patterns to develop effective trading strategies.
What Is Money Flow?
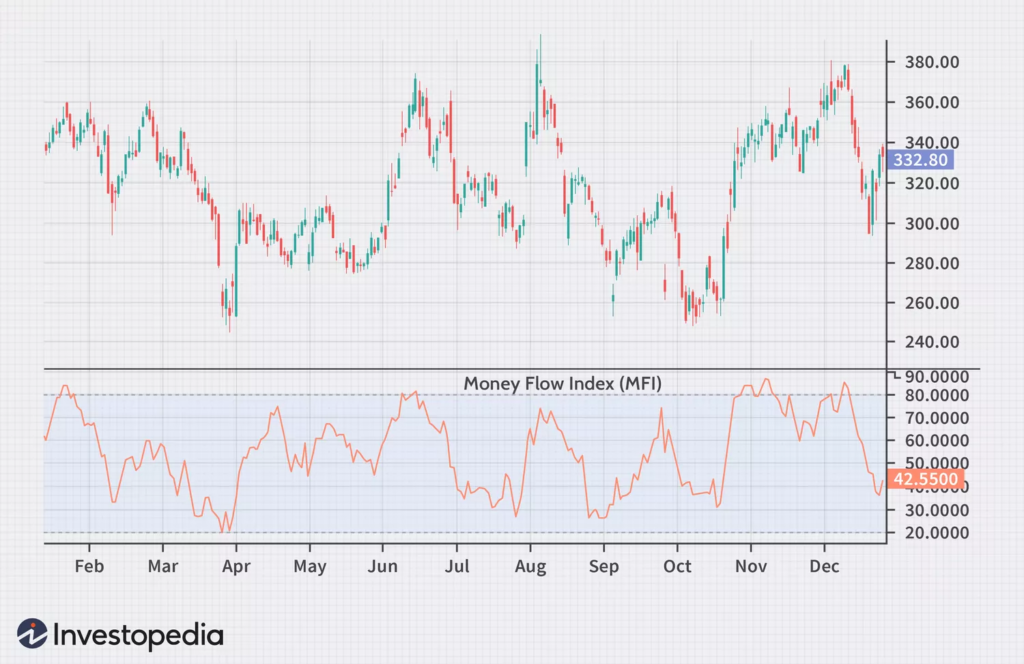
Money flow is a metric that measures the movement of capital entering or exiting a cryptocurrency asset. It is calculated using the typical price, which is the average of the highest, lowest, and closing prices, multiplied by the trading volume over a specific period. However, money flow is rarely calculated manually. Most traders and investors instead rely on the Money Flow Index (MFI), a technical indicator that combines price movements and trading volume to provide a more comprehensive view of market activity.
The Money Flow Index (MFI) displays a value ranging from 0 to 100. A reading above 80 is typically seen as a sign of an overbought condition, suggesting that the price may be too high and could face a correction. Conversely, a reading below 20 indicates an oversold condition, meaning the price may be undervalued and could experience an upward move. According to CoinMarketCap and Investopedia, a price increase accompanied by high trading volume reflects strong capital inflows, while a price decline with high volume signals significant selling pressure.
The Money Flow Index (MFI) is one of the most popular tools for measuring money flow, as it is considered reliable in reflecting the inflow and outflow of funds within an asset. However, in practice, money flow can now be analyzed from various perspectives. Some indicators track real-time fund movements between assets, such as large liquidity shifts from stablecoins to major assets like Bitcoin. Others focus on monitoring cross-chain fund flows within specific ecosystems such as Ethereum, Solana, or Base. Certain metrics emphasize money movements within crypto exchanges, while some analyses track large transfers between wallets owned by major investors or institutions—often serving as early signals of potential market movements.
In addition, money flow can also be viewed within the context of the broader crypto market cycle. In this framework, money flow refers to the movement of capital starting from fiat entering Bitcoin, then flowing into large-cap, mid-cap, and low-cap assets, before eventually returning to Bitcoin or exiting back into fiat at the peak of market euphoria. This cycle can repeat on a smaller scale during bullish trends, forming a money flow pattern that reflects the shifting risk appetite of investors throughout different phases of the crypto market.
This diversity of approaches makes money flow more than just a number on a technical chart. It serves as a map of capital movements that reveals the pulse of the market across multiple dimensions — between assets, networks, and even wallets of major players. A price rally without strong money flow support from these various perspectives often signals a fragile trend. Conversely, price movements accompanied by significant capital accumulation across ecosystems indicate stronger investor confidence and a more sustainable long-term trend.
Why Money Flow Matters in Crypto Price Movements?
The crypto market is known for its sharp and volatile price swings. In such an environment, relying solely on candlestick charts is not enough. Money flow adds an extra layer of analysis, helping traders determine whether a price movement is truly backed by significant capital or merely driven by short-term hype.
For example, a token’s price may suddenly surge without any clear signs of strong inflows. Such rallies are often fragile and prone to quick reversals. On the other hand, when a price increase is accompanied by positive money flow, the trend tends to be more sustainable, supported by genuine investor confidence. Similarly, a price drop with noticeable outflows reinforces a bearish sentiment. For traders, this indicator acts as a mirror that reflects real market sentiment—beyond what price charts alone can reveal.
How to Use Money Flow Data
For beginners, understanding money flow doesn’t require diving into complex calculations. The basic principle is to observe the direction of capital flow and confirm it with price movements. When the Money Flow Index (MFI) rises above 80 during a sharp price increase, it may indicate that the market is in an overbought condition.
Conversely, if the MFI climbs upward from below 20 while the price is still declining, it could serve as an early signal of a potential rebound. Divergence—when price and MFI move in opposite directions—also provides valuable insights. For instance, if the price reaches a new high but the MFI fails to follow, it suggests weakening momentum and a possible trend reversal ahead.
Tools to Track Money Flow
Several popular platforms provide money flow visualizations, each with its own specialized metrics and focus areas, including:
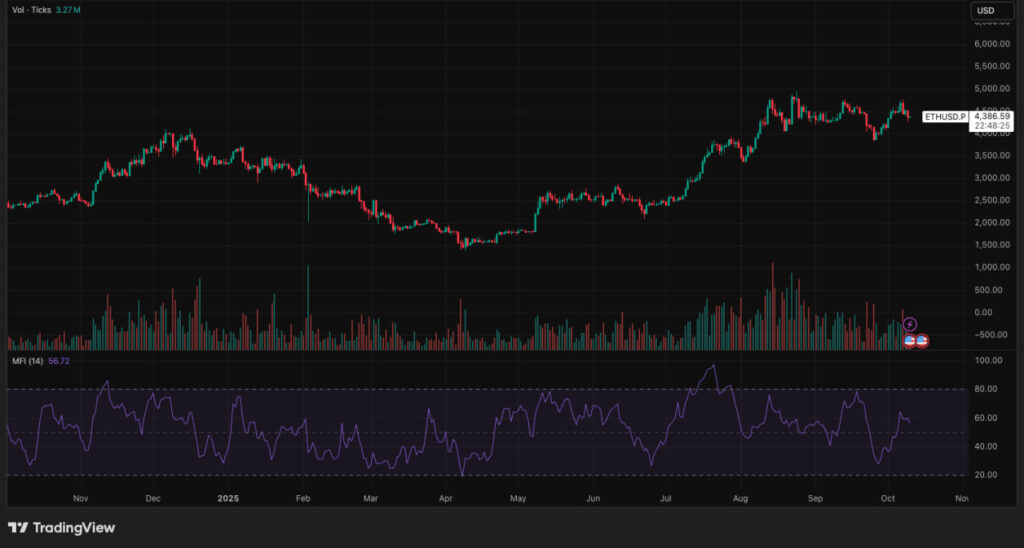
- TradingView provides direct access to the MFI indicator, which can be added to any price chart.
- Cryptometer offers real-time visualizations of liquidity transitions between crypto assets—for example, showing capital movements from stablecoins (like USDT) to BTC, or vice versa.
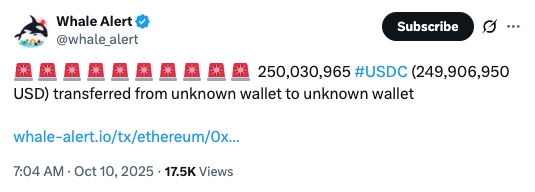
- Whale Alert sends notifications (via Twitter or its dashboard) whenever large transactions occur between wallets, including transfers to or from exchanges.
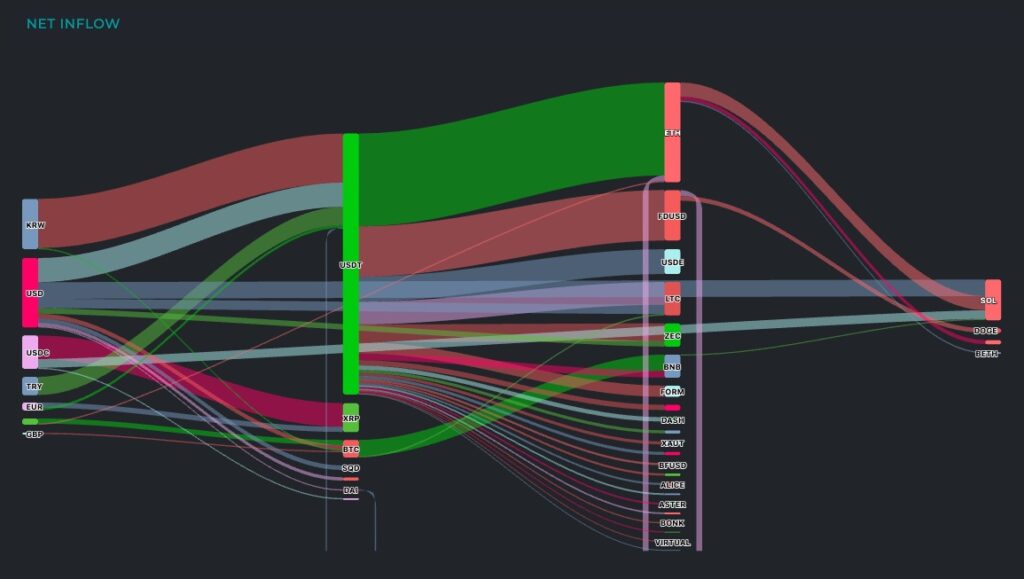
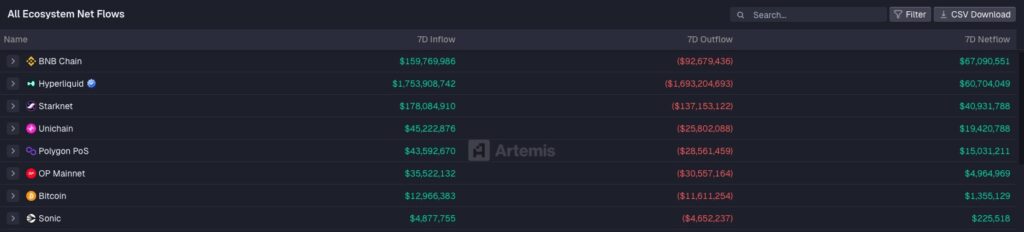
- Artemis tracks money flow across different blockchains, such as inflows and outflows from Ethereum, Base, Solana, and other networks. It also monitors stablecoin flows, showing how much capital moves in or out of these tokens.
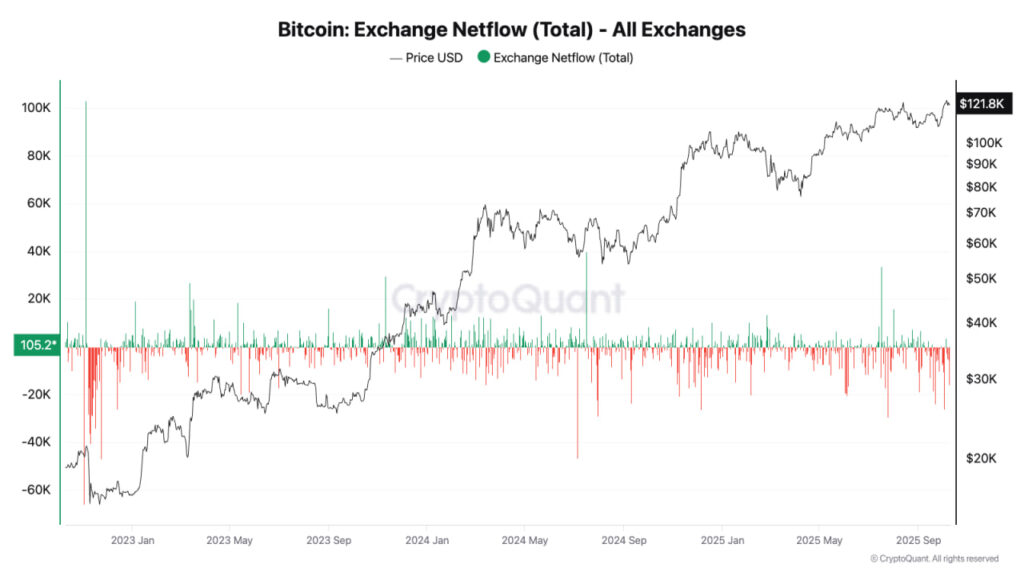
- CryptoQuant and Glassnode provide detailed data on exchange inflows and outflows, helping traders and analysts map large-scale capital movements within the crypto market.
Trading Strategies Using Money Flow
In trading strategies, money flow is often used as a supporting signal. For instance, when the price breaks above a resistance level accompanied by positive money flow, it strengthens the buy signal. Conversely, if the price rises but money flow remains negative, it’s best to stay cautious and avoid entering prematurely.
Many traders also combine the MFI with other indicators such as On-Balance Volume (OBV) and the Relative Strength Index (RSI) to enhance their analysis. When all three indicators align—rising prices, positive MFI, and OBV showing strong accumulation—it often marks a potential entry opportunity. However, as with any form of technical analysis, risks are always present. Maintaining discipline in risk and capital management remains essential to survive and succeed in the ever-changing crypto market.
Start Investing in Crypto with Pintu
After understanding money flow, you can use it as one of your reference indicators when trading assets such as BTC, ETH, SOL, XRP, BNB, and many others on the Pintu app. Everything is available in one secure and easy-to-use platform, designed for both beginners and experienced investors.
Here’s how to buy crypto assets on Pintu:
- Go to the homepage of the Pintu app.
- Open the Market page.
- Search for and select the crypto asset you’ve previously analyzed.
- Enter the amount you wish to purchase, then follow the next steps to complete the transaction.
Conclusion
Money flow can be seen as the heartbeat of the crypto market. It reveals whether price movements are truly supported by real capital or merely driven by temporary euphoria. By understanding this indicator, investors can read market direction more clearly, avoid false trend traps, and make more well-informed decisions. For diligent traders, observing capital flow is not just an addition—it’s a way to feel the market’s pulse more accurately.
Disclaimer: All articles from Pintu Academy are intended for educational purposes only and do not constitute financial advice.
References
- PETER GRATTON, “Money Flow Index (MFI) Definition and Uses”, Investopedia, accessed on August 2025.
- Coinmarketcap, “Money Flow Index (MFI)”, accessed on August 2025.
- CryptoHopper, “Money Flow Index Definition and Use Cases”, accessed on August 2025.
- Fidelity, “Money Flow Index (MFI)”, accessed on August 2025.
- Tyler Corvin, “How to Determine Money Flow”, The Trading Analyst, accessed on August 2025.
Share