Market Analysis 18-25 September: The Fed Raises Interest Rates and Bitcoin at Key Support Level

The Fed raised its interest rate again by 75 bps. With economic conditions still in poor shape, the US is experiencing a growth recession. Coincidentally, Bitcoin has managed to hold on to strong support at $19 and $20 thousand US dollars. In addition, Bitcoin and Ethereum are experiencing increasing selling pressure according to fund rates and inflows to exchanges. Pintu’s trader team has collected various essential data about the crypto market over the past week, which is summarized in this Market Analysis. However, you need to note that all information in this Market Analysis is intended as informational and educational content, not financial advice.
Market Analysis Summary
- 🏦 The Fed raised interest rates by 75bps for the third time. The FOMC explained that inflation is still high and the economy is in a growth recession.
- ✅ Bitcoin managed to hold on to the strong support point of $19-20k. According to the Stochastic oscillator indicator, Bitcoin can continue its downward momentum because we have experienced cross-over twice.
- ⚠️ The inflows of crypto assets to exchange and funding rates suggest that selling pressure is increasing.
Macroeconomy Analysis
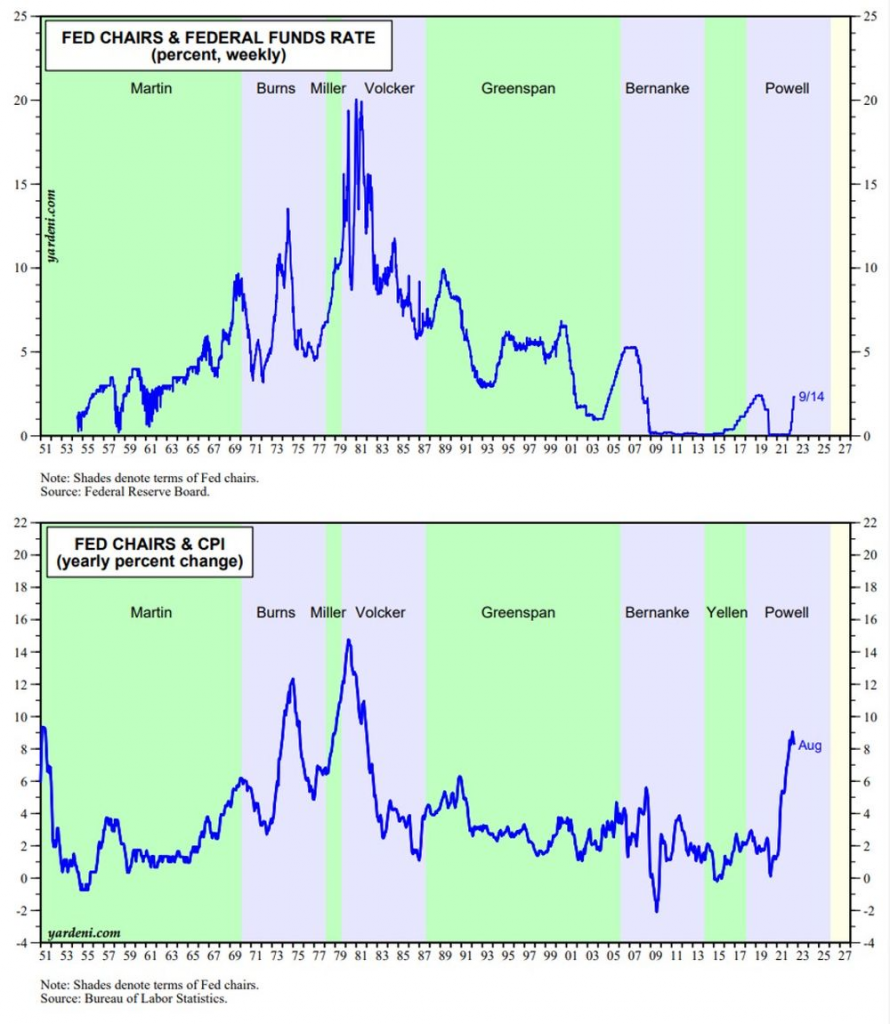
The Fed raised interest rates by 75bps for the third time. The Federal Open Market Committee (FOMC) unanimously decided to raise the target range for the federal funds rate to a range of 3.00% – 3.25%. The FOMC explains that inflation remains high, reflecting an imbalance of supply and demand, higher food prices, and rising energy prices.
CPI data showed an annual increase of 8.3% in August while peaking at 9.1% in June. Even so, this figure is above the market estimate of 8.1%.
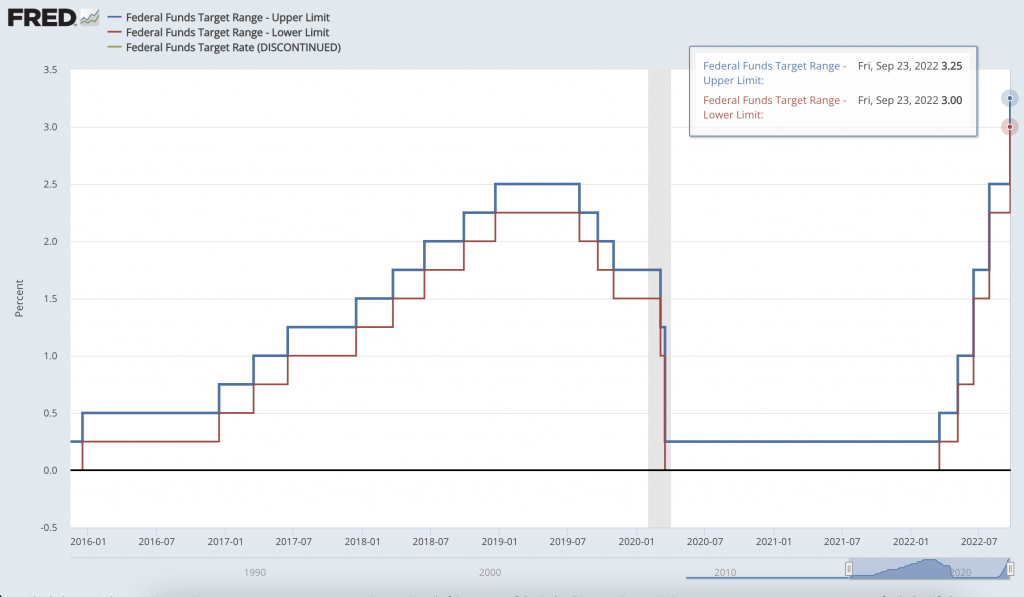
During a press conference on the 21st of September, Powell repeated his hawkish tone, suggesting the only way to bring inflation down is with a recession. He mentioned the words “sick” or “painful” seven times and “restriction” twelve times. The economy is currently in a growth recession. The yield curve spread has been negative for several weeks, signaling a recession.
💡 What is a growth recession?
A growth recession refers to a situation in which the pace of economic growth is too slow and the jobs lost exceed the new jobs created. However, a growth recession does not fulfill all the requirements of a technical recession.
However, the employment sector is still strong. Despite a high interest rate and a slowing economy, the US labor market remains very strong. The August unemployment rate was at 3.7%. Gas prices have also fallen 26% in recent weeks, since peaking at $5. Inflation may be hitting a peak soon. Wednesday marks the fifth FOMC meeting ending with the Fed’s rate hike. The Fed has raised the interest rate by 3% during the current QT (Quantitative tightening). The yield on the 2-year government treasury reached 4% while the 10-year term reached 3.5%.
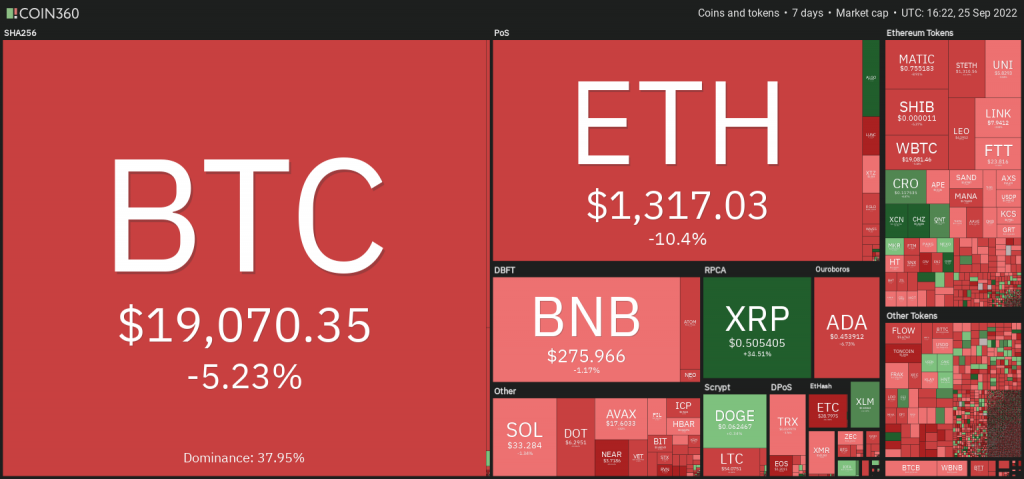
The stock market suffered losses, with the Nasdaq Composite losing 5% WoW (Week on Sunday), DJI losing 4% WoW, and the S&P losing 5% WoW. The Crypto market was also not spared with BTC losing 4% WoW and ETH losing 2.5% WoW before settling at $19,000 and $1,300 respectively at the time of this writing.
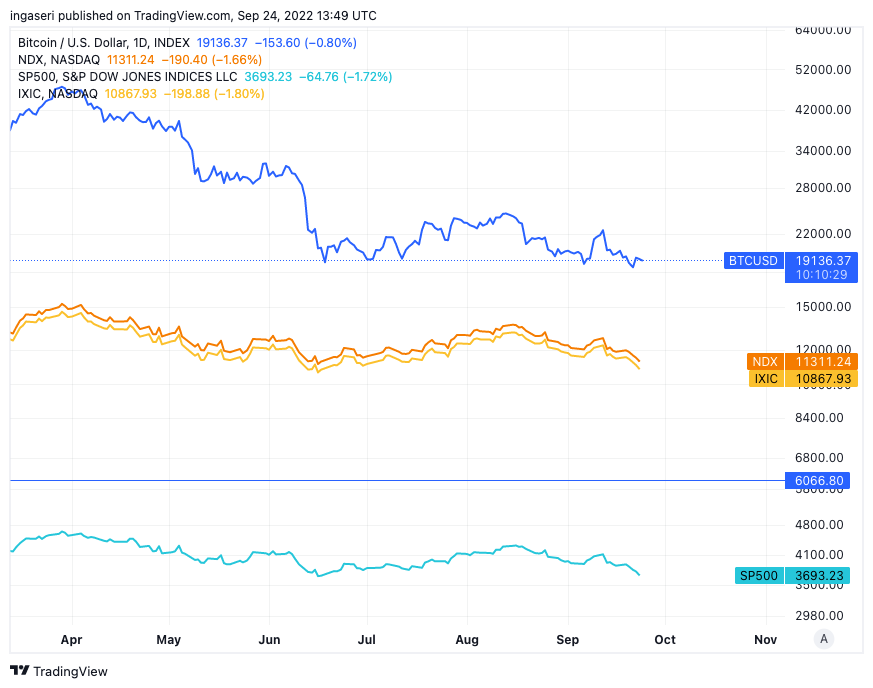
Bitcoin Price Movement 19 – 25 September 2022
Let’s take a look at Bitcoin’s 2-week chart. Note that in the previous bear market (in 2018), we could see that when the stochastic level (bottom chart in the image below) fell below 20, the price of BTC fell. A stochastic Oscillator is a momentum indicator to indicate potential trend reversals. This indicator measures momentum by comparing the closing price with the trading range over a certain period. Stochastic is very useful when trading in volatile and sideways markets.
When the %D line (orange line) crosses above the %K line (green line), it indicates bearish momentum. Notice in 2018, we had the first cross-over (crossed above the green line) at the stochastic level 20 (which represents the oversold level), and the price of BTC fell. When the cross-over happened again, it fell deeper.
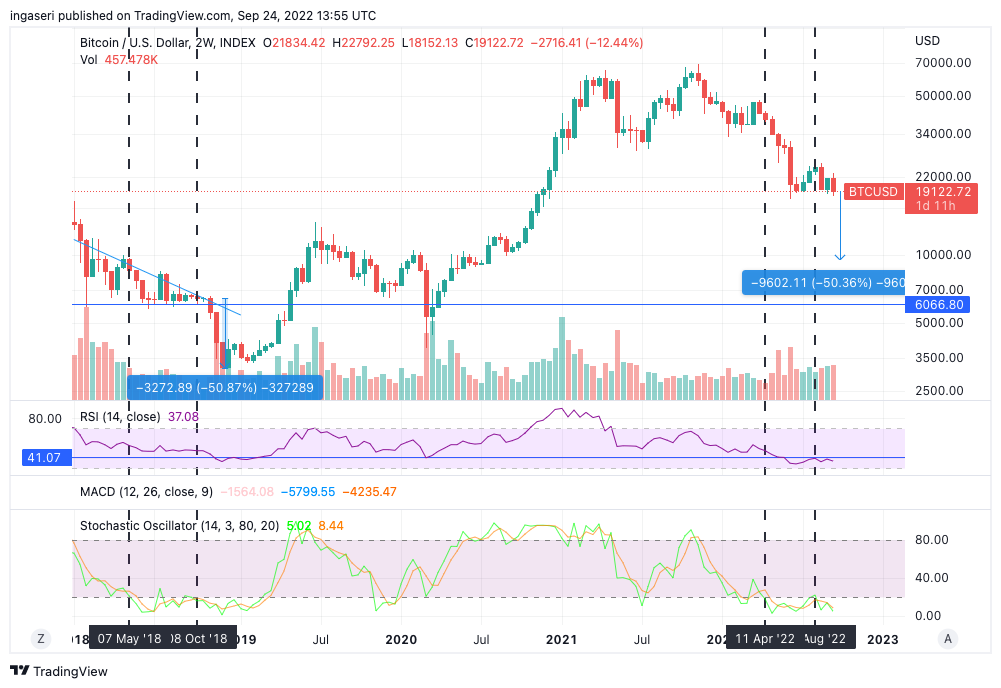
Currently, BTC is facing a similar situation where the first crossover occurred in April this year when the price was falling. Then, we had another cross in August. We hope this is a fake-out and that BTC can maintain its historically strong support point at $19.5-20k. Looks like we will face some volatility in the coming weeks. If we continue the downward momentum, there is likely to be a further decline.
So how do we know BTC can drop to 10K? If we take a look at the monthly chart, notice that we have held on to $19-20K as strong support for the last 4 months. Moreover, this price range previously acted as strong resistance in late 2017 and late 2020.
You want to learn to analyze BTC charts? Start by knowing how to read candlestick price charts and work your way up to technical analysis!
If we close the price below $19K, there is a possibility that the downward momentum will continue. At the moment, we are at the lowest point in the monthly RSI, with fairly strong support. Additionally, there is strong support at $17,500, a drop below this price could lead to a significant decline towards the $12,000 price range.
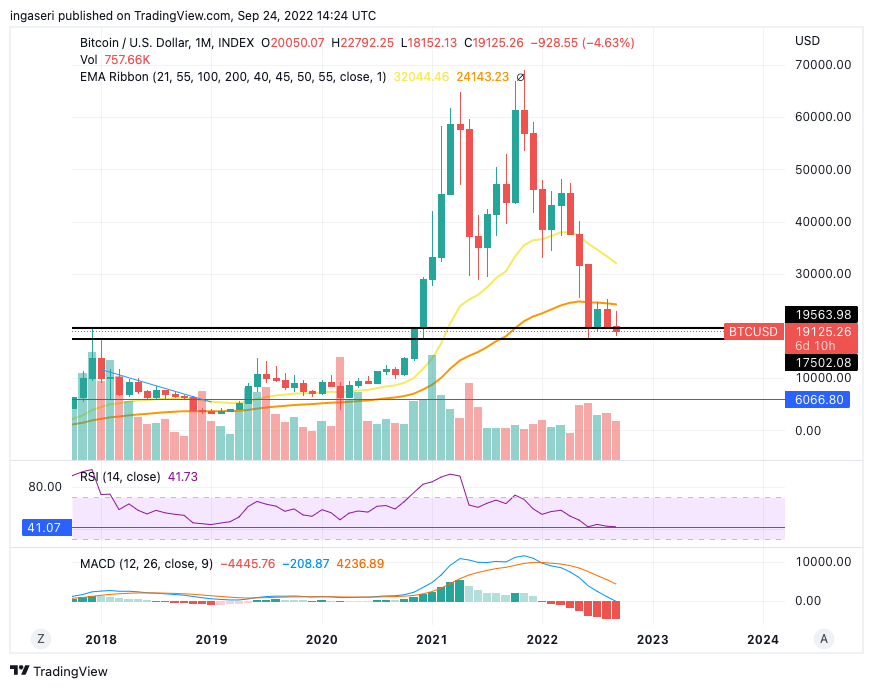
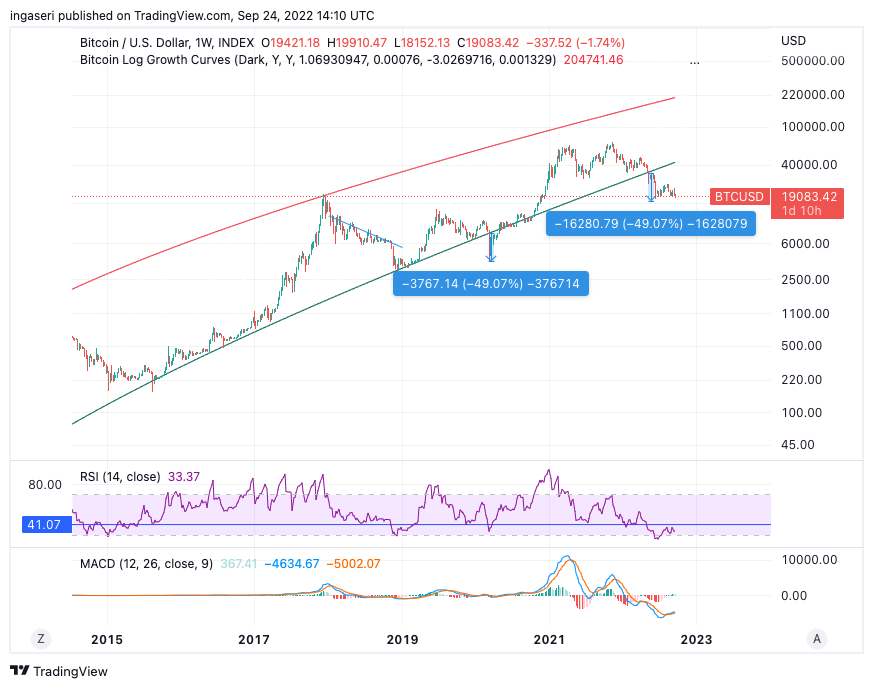
Bitcoin is still outside the log growth curve. In the previous bear market, BTC fell 49% from the bottom of the log growth curve, if we are to see the same number, BTC would hit the $16,000 mark.
On-Chain Analysis
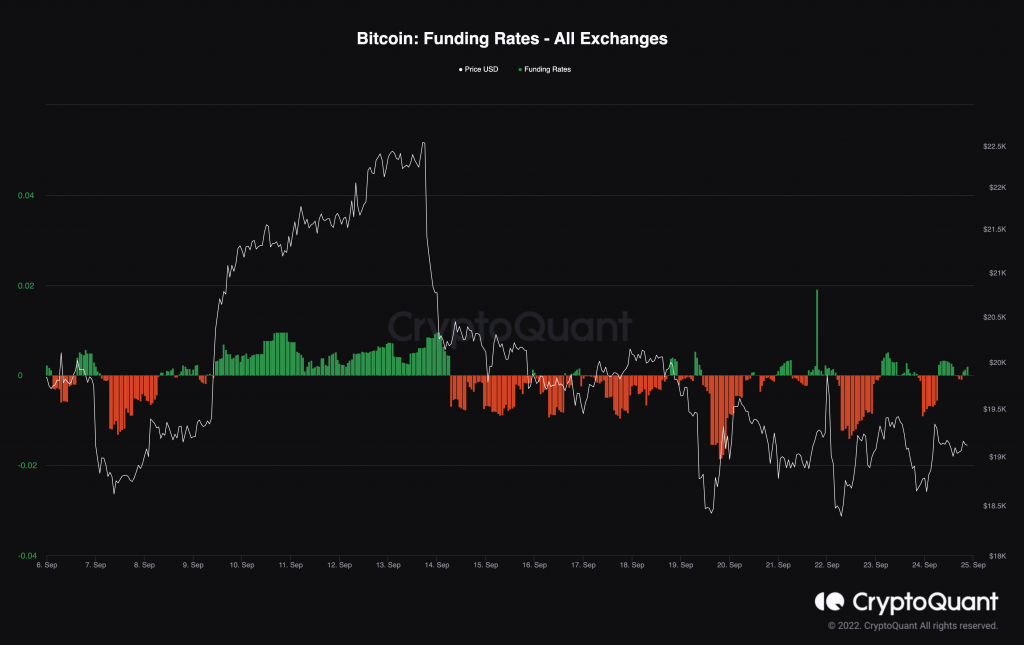
Two datasets provide an overview of Bitcoin and Ethereum selling pressures this week: Inflows to Exchanges and Funding Rates. BTC and ETH inflow into exchanges have been increasing recently, especially ETH, just before The Merge (on September 15). Unusual inflows into the exchange have provided selling pressure. Hourly funding rates are also negative, indicating traders in the derivatives market are mostly short. In addition, as The merge draws near, ETH funding levels are the worst on record. In addition to the two sets of metrics above, whales have increasingly transferred their assets to exchanges, which amplifies selling pressure.
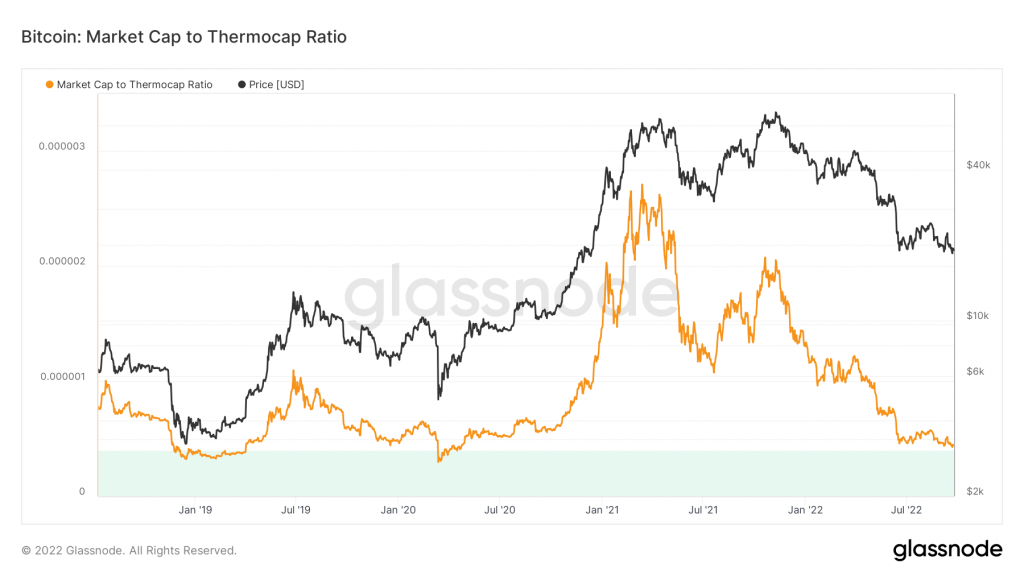
Market to Thermocap Ratio is approaching the green zone (oversold). This ratio is simply defined as Market cap/Thermocap and can be used to assess whether an asset’s current price is trading at a premium relative to the total security issued by the miner. This ratio already takes into account the increase in circulating supply over time.
📊 Exchange Exchange: Increasing exchange reserves indicate increasing selling pressure. Net deposits on the exchange are low compared to the 7-day average. Lower deposits can be interpreted as lower selling pressure.
💻 Miners: Miners sell holdings in a moderate range compared to the one-year average. In addition, the income of miners has decreased significantly compared to the costs they incur. This could indicate that prices are too low as miners want to keep their coins.
🔗 On-Chain: More investors selling at a loss. In the middle of a bear market, it can indicate the bottom of the market. The movement of long-term holders in the last 7 days was lower than average. They have a motive to hold their assets. Furthermore, investors are in the Capitulation phase and face unrealized losses. This indicates a decrease in the motive to realize losses which leads to a decrease in selling pressure.
🏦 Derivatives Market: Traders in long positions are dominant and willing to pay short traders. Selling sentiment is dominant in the derivatives market. More sell orders are filled by takers. When open interest declines, it indicates investors are closing futures positions and a possible trend reversal is occurring. So, it can trigger a possible long/short-squeeze caused by a sudden price movement.
📉 Stochastic: Indicates oversold conditions where the current price is approaching the bottom of the last 2 weeks and a trend reversal may occur.
Altcoin News
- 🕠 Vitalik Buterin Hopes Dogecoin Moves to Proof of Stake. At the Messari conference, Vitalik Buterin explained that he hopes Zcash and Dogecoin can move to a proof-of-stake system. He also explained that as the development of PoS technology progresses, its advantages will be increasingly felt. With the success of The Merge, Ethereum developers demonstrated that a move from PoW to PoS is possible.
- ⚽ FIFA Releases 2022 World Cup NFT collection. FIFA has just released a special World Cup edition NFT collection platform called FIFA+ Collect. The platform launched with 532,980 NFT collections containing moments from all the previous World Cups for $4.99 US dollars. This NFT platform is the result of a collaboration between the Algorand blockchain (ALGO) and FIFA.
More News from the Crypto World in the Last Week
- 🧠 US Government Releases Crypto Guidelines. On September 16, the White House released its Policy Guidelines on the crypto industry in the US. This document is divided into 7 sections focusing on protecting users and enforcement of “Unlawful Practices”. Although the US government sees great potential in the crypto industry, it is also very concerned about the risks. This document also explains the importance of CBDC (Central Bank Digital Currency).
- 🚨 CFTC Charges a DAO and its Two Founders. The Commodity Futures Trading Commission sued a DAO named Ooki DAO and its two founders, Tom Bean and Kyle Kistner. The CFTC initially charged Tom Bean and Kyle Kistner with “illegally offering leveraged and margined retail commodity transactions in digital assets.” However, the CFTC apparently extended that claim to the DAO for the same reason. This charge could set a bad precedent regarding the legality of DAOs.
- ☠️ Wintermute $160 Million US Dollar Hack. Wintermute, a crypto market-making company, recently suffered a $160 million US Dollar hack. The hackers stole the private keys (passwords for digital wallets) by brute-forcing them with large computing power. In addition, the compromised private keys were allegedly generated from the Vanity program which turned out to have security weaknesses.
- 🚓 Interpol is looking for Do Kwon. Do Kwon, founder of Terraform Labs behind the crypto LUNA, has just been added to Interpol’s (International Police) red notice list. A Red Notice is a list issued to fugitives who are wanted either for prosecution or for serving a sentence. This registration is the aftermath of the South Korean court’s decision to arrest Do Kwon.
Cryptocurrencies Market Price Over the Past Week
Cryptocurrencies With the Best Performance
- XRP +5,45%
- ALGO +5,18%
- LINK +2,5%
- CHZ +2,36%
Cryptocurrencies With the Worst Performance
- LUNC -7,45%
- DOGE -5,25%
- SNX -4,85%
References
- Kate Irwin, Ethereum’s Vitalik Buterin ‘Very Hopeful’ Dogecoin Moves to Proof of Stake, Decrypt, accessed on 26 September 2022.
- YYCTrader, FIFA Releases Genesis NFTs on Eve of World Cup, The Defiant, accessed on 26 September 2022.
- FACT SHEET: White House Releases First-Ever Comprehensive Framework for Responsible Development of Digital Assets, White House, accessed on 26 September 2022.
- Guillermo Jimenez dan Jason Nelson, CFTC Sues a DAO, Raising Legal Questions for DeFi Founders and Users, Decrypt, accessed on 26 September 2022.
- Derek Andersen, Well-known vulnerability in private keys likely exploited in $160M Wintermute hack, Coin Telegraph, accessed on 26 September 2022.
- Sangmi Cha, Interpol Issues Red Notice for Terra’s Do Kwon, South Korea Says, Bloomberg, accessed on 26 September 2022.
Share