The transparency of crypto assets such as Bitcoin is one of the benefits that make them appealing to investors. Because it means that anyone can monitor the movement of Bitcoin supply and demand and the activity on the Bitcoin network, which will affect the price. This is why to be able to maximize profits from investing in crypto assets, it is not enough to just use technical and fundamental analysis. You also need to understand on-chain analysis. What is on-chain analysis and how to use the method to maximize profit? Read more in this article.
Article Summary
📉 On-chain analysis is an analytical technique that involves reading a collection of data from a crypto asset’s ledger.
💰 Information on supply and demand volume, market psychology, patterns of spending, and miner hashing can all be seen in a completely free crypto asset market to help investors make informed decisions.
👩💻 On-chain analysis is usually carried out by professional traders because information such as inflow and outflow volume can only be observed through paid portals.
What is on-chain analysis?
Crypto assets are the first asset class where all investor activity can be monitored via a crypto asset ledger. Through this data, we can see the supply and demand of the coin or token, market psychology, and also activities related to the network such as miner activities and so on.
On-chain analysis is a vital strategy that helps you to separate the speculative value of a crypto asset from its utility value. How does on-chain analysis work? On-chain analysis gathers all information inside of the blockchain such as user adoption, miners’ activity, and whether the current price is appropriate or not based on the fundamentals.
On-chain analysis is an immutable analysis of records from the Bitcoin ledger. Things that are observed in on-chain analysis include supply and demand dynamics, psychology and human decisions, and spending patterns, HODLing, and miners’ hashing in a truly free market.
blockquote>
How to Use On-Chain Analysis in Crypto Trading?
When using on-chain analysis, below are the three things you need to observe.
Which participant from the Bitcoin network that you want to observe? (Whale investors, crypto exchanges, miners, speculators, etc.)
What are the driving factors and incentives (profit and loss, revenue mined, accumulated sats, etc.)?
How are their decisions within the blockchain (fees paid, transaction volume, difficulty adjustment, wallet balance, coin dormancy, etc.)?
To read on-chain analysis you can use reputable websites like Glassnode or Messari.
There are hundreds of metrics that we can read about in on-chain analysis but here are examples of some of the metrics we can use to read the market situation. As long as the blockchain is public, you can read the on-chain analysis such as on-chain data Bitcoin and on-chain data Ethereum.
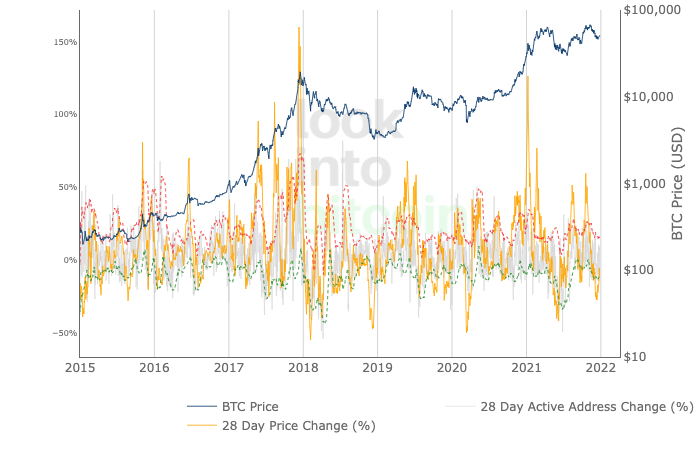
Active Address vs Transaction Amount
By knowing how many active addresses are with the number of transactions, it can be concluded that if the number of active addresses increases and the number of transactions also increases, this condition allows for an increase in prices.
How to read: If the number of addresses increases represented by the orange line and has crossed the red line, this determines the market in the short term is too hot and will cool (the price decreases for a while) but if the orange line crosses the red line as well as the green line, then this usually indicates a market crash or the end of a bull market trend.
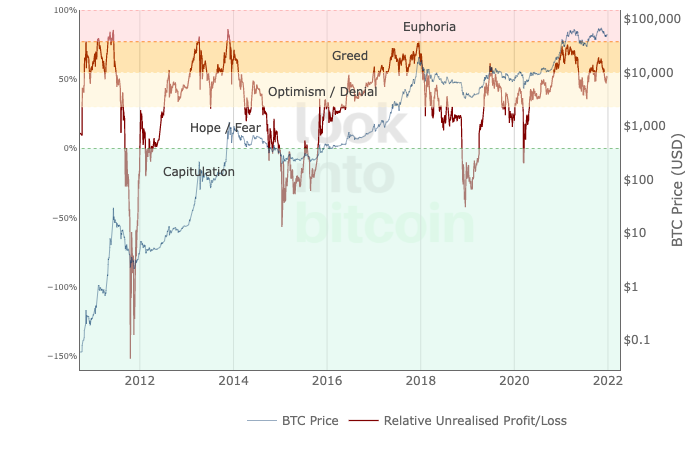
Unrealized Profit/Loss
Unrealized profit/loss is a metric that looks at the profit and loss of bitcoin investors. The way to calculate unrealized profit/loss is to subtract the realized value price from the market price. By looking at the UPL you can see the psychological sentiment of the market. If the market is experiencing an upward trend (bull) then we read this indicator like the following:
Capitulation > Hope> Optimism > Greed > Euphoria
However, if the market is experiencing a downward trend (bear), then the way to read this indicator is the other way around.
Euphoria> Greed> Denial> Fear> Capitulation
How to read: Capitulation is the right moment to buy while Euphoria is the right moment to sell. UPL is also good for determining the change of market trend from bull to bear or vice versa.
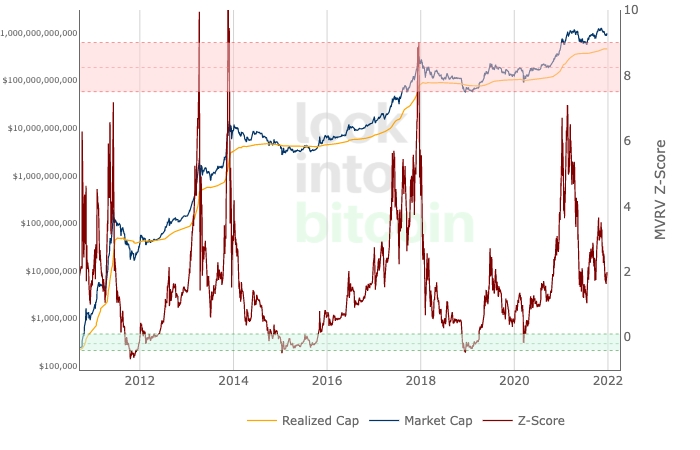
MVRV (Market Value and Realized Value)
What is MRVT Ratio? This metric looks at today’s price divided by realized price. Realized value take the price of each Bitcoin when it was last transferred, i.e. the last time it was sent from one wallet to another. Then all these prices are added up and the average is taken. Then that average price is multiplied by the total number of coins in circulation. Through this metric, we can see a more accurate measure of the value of Bitcoin in the long term where the market value moves based on market sentiment at that time.
A ratio above 7 indicates overvaluation (high price) and a ratio below 1 indicates undervaluation or low price. With this metric, we can see that if the Z score (red line) enters the pink area, it means the market is entering the highest price in a bull market, and if the Z score enters the green area, it means the market enters the lowest price in a bear market.
How to read: If the area has entered the green area or below 1 it is a good time to buy bitcoin assets. If the z score enters the pink area it means you can start selling for profit.
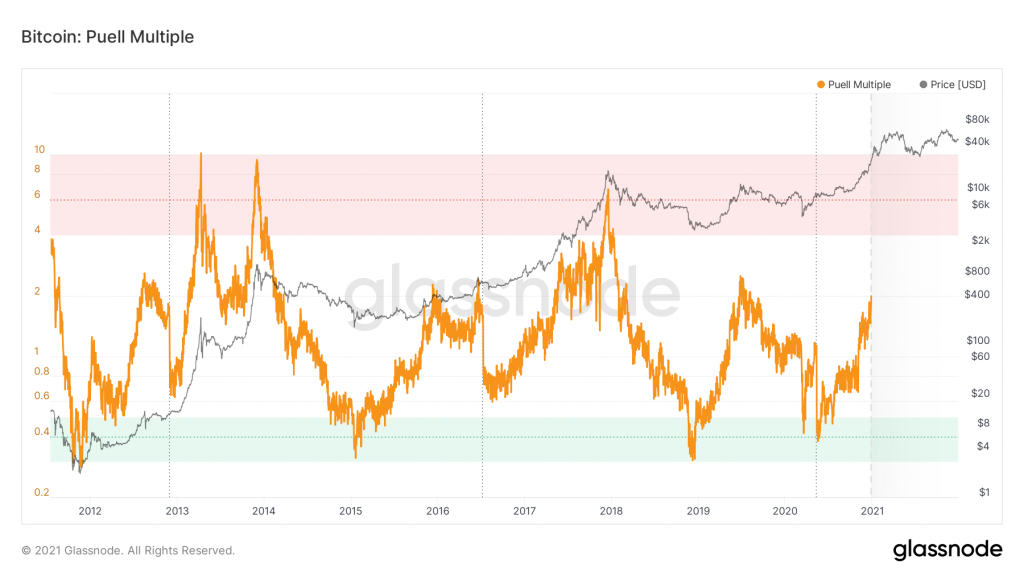
Puell Multiple
There are times when the value of bitcoins mined and entering the ecosystem is excessively high or excessively low in comparison to their historical value. Understanding this time period is extremely advantageous to bitcoin investors. How do you calculate Puell Multiple? Puell Multiple looks at the comparison between the total value of bitcoins issued each day divided by 365 Moving Averages or 1 year.
How to read: If Puell Multiple enters the green zone, it means that the valuation value is too low and if Puell Multiple enters the red zone, it means that the valuation value is too high.
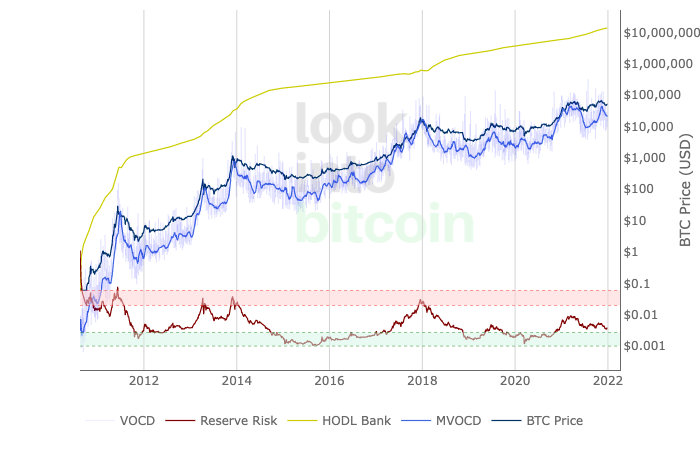
Reserve Risk
If the price is low but reserve risk shows a low number, then this is a profitable time to invest. But if the price is high and reserve risk shows a high number, then this is not the right time to invest.
How to read: By looking at Reserve Risk, we can see the confidence and sentiment of investors, if prices are low and confidence is high (green zone) then this is the right time to invest. But if confidence is low (red zone) but prices are high, this is not the right time to invest.
Summary
There are various indicators and metrics that you can analyze in on-chain analysis. This analysis must also be accompanied by an understanding of technical analysis. On-chain analysis is very helpful for long-term investors who want to buy low and sell high. By looking at the data in on-chain we can see a more comprehensive view of market behavior and psychology compared to looking at price action alone.
This content is intended to enrich the reader’s information. Always do some independent research and use cold cash before investing. All activities of buying and selling crypto assets are reader’s responsibility.
Many people are interested in trading crypto assets because of their extreme volatility. However, before you begin trading, it’s important to understand that there are a variety of crypto trading techniques and styles that you can choose, depending on your circumstances and scenario. Which one is right for you? Find out more in this article. […]