Ripple (XRP) Price Drop – Is it a Time Out or the End of the Rise?

Jakarta, Pintu News – After peaking in the $2.25 zone, the price of Ripple has corrected and is now in a consolidation phase, with challenges around the $2.20 level.
Ripple (XRP) Price Correction
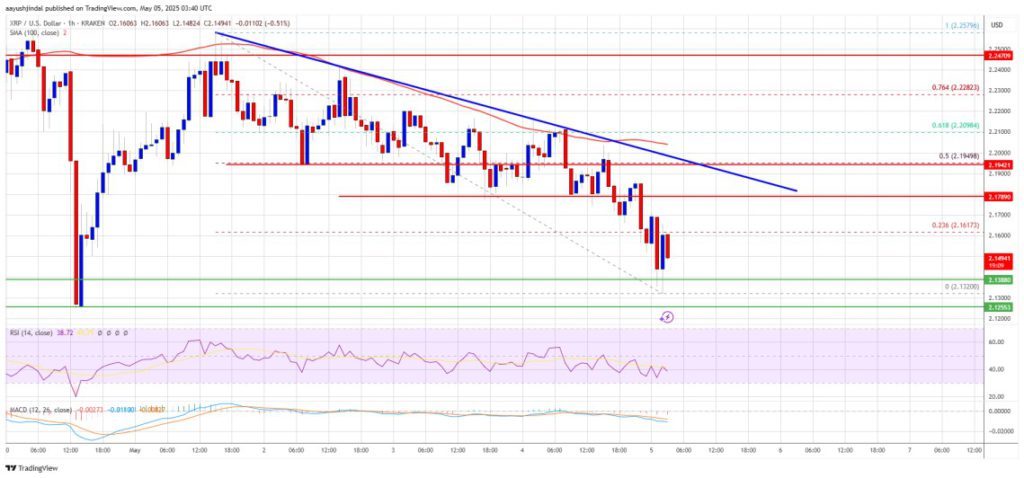
Ripple (XRP) price failed to maintain its position above $2.25 and followed in the footsteps of declines like Bitcoin and Ethereum . It dropped below the $2.220 and $2.20 support levels. In fact, the price briefly touched the $2.1320 zone, recording a low of $2.132 before starting to consolidate its losses. Currently, the price is moving near the 23.6% Fibonacci retracement level of the last drop from the $2.2579 high to $2.1320 low.
Also Read: BONK Freefalls 8% in 24 Hours: Check out the Price Levels that Can Prevent Further Declines!
Current Technical Conditions
On the hourly chart of Ripple (XRP) against the US Dollar (USD), a new bearish trend line is forming with resistance near $2.1950. The price is now below $2.20 and the 100-hour simple moving average. If the price rises, the first resistance it may face is at $2.1780. The next major resistance is $2.20, which coincides with the 50% Fibonacci retracement level of the same drop.
Potential Upcoming Price Movements
If Ripple (XRP) manages to break the $2,220 resistance, there is a possibility that the price will move towards $2,250. Further upside could push the price towards $2,320 or even $2,350 in the short term. The next big resistance for buyers might be $2.50. However, if Ripple (XRP) fails to break the $2.20 resistance zone, the price may see another drop.
Risk of Further Decline
Initial support on the downside is near $2.1380, with the next major support at $2.1320. In the event of a downward break and close below the $2.1320 level, prices could continue to drop towards the $2.080 support. The next major support lies in the $2,050 zone. The hourly MACD indicator for Ripple (XRP)/USD is now showing acceleration in the bearish zone, and the hourly Relative Strength Index (RSI) is below the 50 level.
Conclusion
The current price dynamics of Ripple (XRP) shows a correction and consolidation phase after the previous rise. Investors and market watchers should pay attention to key resistance and support levels in anticipation of further price movements. The market performance of other cryptocurrencies such as Bitcoin (BTC) and Ethereum (ETH) may also provide some clues about the overall market direction.
Also Read: Ethereum Hangs Above $1,770: Can It Reach $2,030 Next?
That’s the latest information about crypto. Follow us on Google News for the latest crypto and blockchain technology updates. Enjoy an easy and secure crypto trading experience by downloading Pintu crypto app via Google Play Store or App Store now.
Experience web trading with advanced trading tools such as pro charting, various order types, and portfolio tracker only at Pintu Pro. Pintu Pro Futures is also available, where you can buy bitcoin leverage, trade btc futures, eth futures and sol futures easily from your desktop!
*Disclaimer
This content aims to enrich readers’ information. Pintu collects this information from various relevant sources and is not influenced by outside parties. Note that an asset’s past performance does not determine its projected future performance. Crypto trading activities are subject to high risk and volatility, always do your own research and use cold hard cash before investing. All activities of buying andselling Bitcoin and other crypto asset investments are the responsibility of the reader.
Reference
- NewsBTC. XRP Price Momentum Stalls at $2.20. Accessed on May 5, 2025
- Featured Image: U Today