XRP Rebounds from Key Support — Is a Move to $3.40 Coming Next?
Jakarta, Pintu News – The price of XRP is currently showing mixed signals. On the one hand, the short-term support level is still holding quite strong. However, on the other hand, the long-term chart is starting to show warning signs.
One of the technical signals that emerged was a bearish divergence, indicating a potential weakening of the uptrend.
It should be noted, this is not a short-term signal and does not mean that XRP will plummet today or tomorrow. However, it does suggest that the bullish momentum could start to weaken in the coming weeks or even months.
This signal has been around for some time and hasn’t gone away, so it remains an important risk factor for XRP holders.
Daily Chart: Holding Support… for a While
On the daily chart (Aug 7), XRP is currently bouncing off the Fibonacci support level around $2.90. The area between $2.90 to $3.00 seems to be a strong support zone that is resisting selling pressure.
Read also: Ripple Drops Below $3 — Analyst Warns XRP Could Fall Even Further
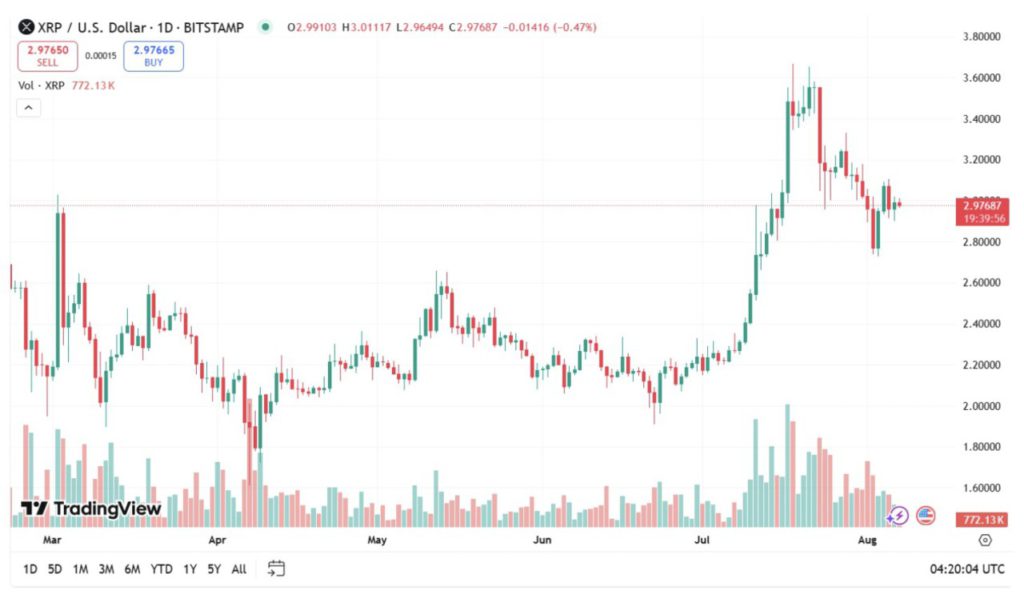
As long as prices remain above this range, there is a chance for a further short-term bounce.
However, if XRP closes back below $2.90, there is a possibility of the price dropping further towards the $2.75 area.
Below that level, there is another important support zone in the range of $2.55 to $2.62, which has the potential to be a barrier to a deeper correction.
Resistance Levels to Watch Out For
In the short term, XRP faces resistance around $3.10, with stronger resistance between $3.10 and $3.20.
If buyers manage to break this zone, the next resistance target is near $3.40.
For now, XRP still seems to be moving in a limited range, with support levels still holding but strong resistance blocking further gains.
Price Pattern Still Looks Familiar
Interestingly, the current price movement pattern of XRP looks very similar to the formation that appeared earlier this year. While there are small day-to-day movements, not many significant changes have occurred in the past few days.
This means that the overall price structure still remains the same, and so far has not shown any signs of a strong bullish recovery.
Read also: Can Solana (SOL) Rise? These Three Indicators Give Important Signals!
Altcoin Season is Yet to Be Seen
If you look at the Bitcoin dominance chart, there is no clear signal that the altcoin season is about to begin. Bitcoin’s dominance is still holding above the support level between 60.5% to 61%.
As long as these levels are maintained, altcoins like XRP will most likely continue to follow Bitcoin’s direction, without scoring significant gains on their own.
Conversely, if Bitcoin’s dominance begins to decline or break below these support levels, the chances of a stronger rally in the altcoin market-including XRP-will increase.
That’s the latest information about crypto. Follow us on Google News to get the latest information about the world of crypto and blockchain technology. Check today‘ s bitcoin price, today’s solana price, pepe coin and other crypto asset prices through Pintu Market.
Enjoy an easy and secure crypto trading experience by downloading Pintu crypto app via Google Play Store or App Store now. Also, get a web trading experience with various advanced trading tools such as pro charting, various types of order types, and portfolio tracker only at Pintu Pro.
*Disclaimer
This content aims to enrich readers’ information. Pintu collects this information from various relevant sources and is not influenced by outside parties. Note that an asset’s past performance does not determine its projected future performance. Trading crypto carries high risk and volatility, always do your own research and use cold hard cash before investing. All activities of buying and selling bitcoin and other crypto asset investments are the responsibility of the reader.
Reference:
- Coinpedia. XRP Price Bounce: Support at $2.90 Holding Strong as Bulls Eye $3.40. Accessed on August 7, 2025