Is XRP on the Brink of Collapse? Bulls and Bears Clash at the Crucial $2.06 Level
Jakarta, Pintu News – The price of XRP has fallen nearly 24.5% in the past month, dropping to a low of $2.06 after breaking out of a head and shoulders pattern. This correction has reached its target, indicating that the downward phase may be over.
Now, with buying interest slowly returning and the $2.06 level becoming a strong support point, XRP is at a turning point – where early signs of recovery are beginning to emerge although technical risks are still elevated.
Head and Shoulders Pattern Completed, Buyers Start Building Foundations at $2.06
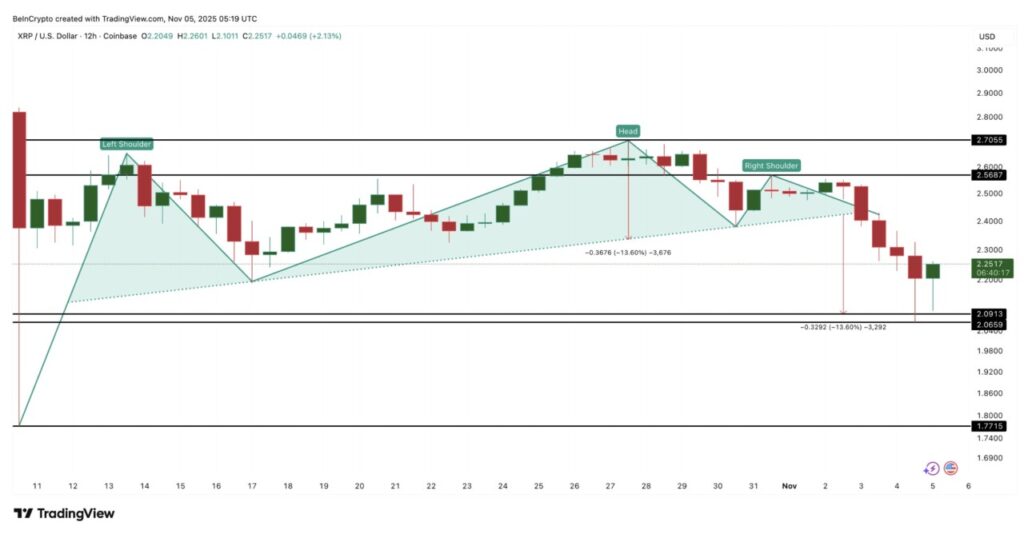
The 12-hour chart (5/11) of XRP shows a clear break from the head and shoulders pattern, a common technical pattern signaling a downward reversal, characterized by three peaks forming before the price reverses downwards.
Read also: Franklin Templeton Ready to Launch XRP ETF This Month After Latest S-1 Filing!
The break of theneckline on November 3 pushed the price of XRP down to $2.06 – almost touching the technical target at $2.09 with precision.
The completion of this pattern usually marks the end of a short-term correction. And now, the data shows that buyers are starting to re-enter the market.
According to data from Glassnode, the change in XRP’s net position on exchanges – which reflects whether investors are moving tokens into or out of exchanges – has been sharply negative since October 30. This indicates that more XRP is being pulled out of exchanges.
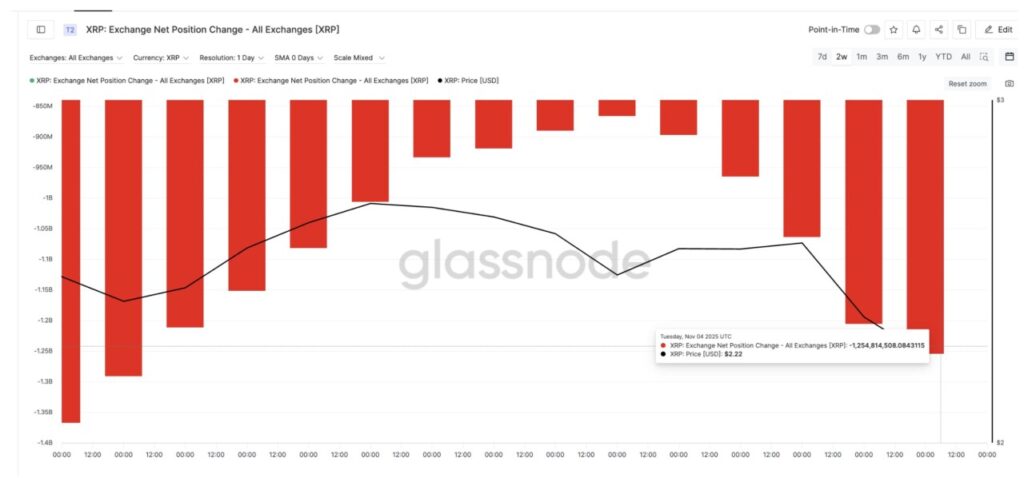
These withdrawals are generally interpreted as accumulations, not sales. Outbound volume increased from 866 million XRP on October 30 to 1.25 billion XRP on November 4, just as the market correction occurred – up almost 50% in just a few days. This suggests that large investors may have taken advantage of the price drop to add to positions.
The combination of the completion of the bearish pattern and increased outflows from exchanges signals that the $2.06 area could be the foundation of XRP’s price going forward. This zone is now the main concern of traders as the battle between bulls and bears heats up.
Pressure from Derivatives and Bearish Signals Threaten XRP Price Recovery
In the derivatives market, XRP prices are still facing bearish pressure. Data from Coinglass shows that there are approximately $262 million of short positions with leverage in the range of $2.31 to $2.63, while long positions amount to only $33 million.
This situation opens up the opportunity for a short squeeze, but it also shows that most traders are still betting on a price increase.
Read also: Experts Share 3 Smart Strategies for Entering the Altcoin Market During November’s Market Jitters
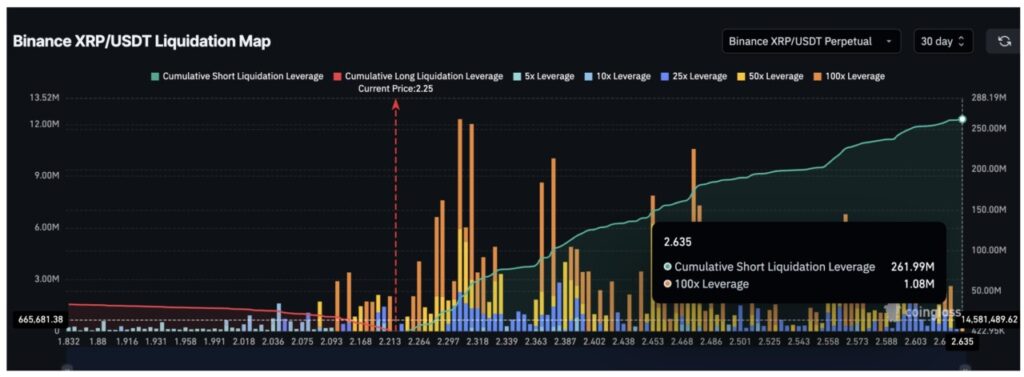
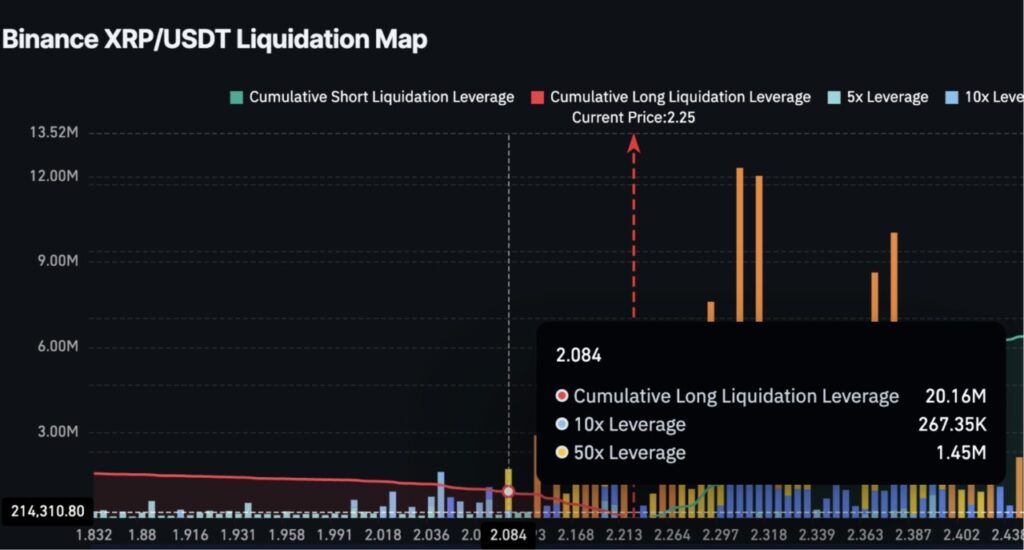
Some aggressive long positions are also in vulnerable areas, especially around $2.08, as seen on Binance’s liquidation map. If XRP prices drop even slightly, these positions could be forced to close, adding to the short-term downward pressure before a potential short squeeze occurs.
From a longer-term point of view, the daily chart adds reasons to be cautious. The 50-day Exponential Moving Average (EMA) is starting to approach the 200-day EMA. If the 50-day EMA breaks below the 200-day EMA, it forms a death cross pattern – a bearish signal that often signals potential prolonged weakness.
This pattern also aligns with the falling wedge formation on the XRP chart – a technical structure that usually precedes an upside move, but could still result in a further decline before reversing.
However, the lower trendline of this wedge only has two touch points, which makes it a weak support area. If the $2.06 level is broken, the price of XRP could potentially drop back to $1.91 before attempting to recover.
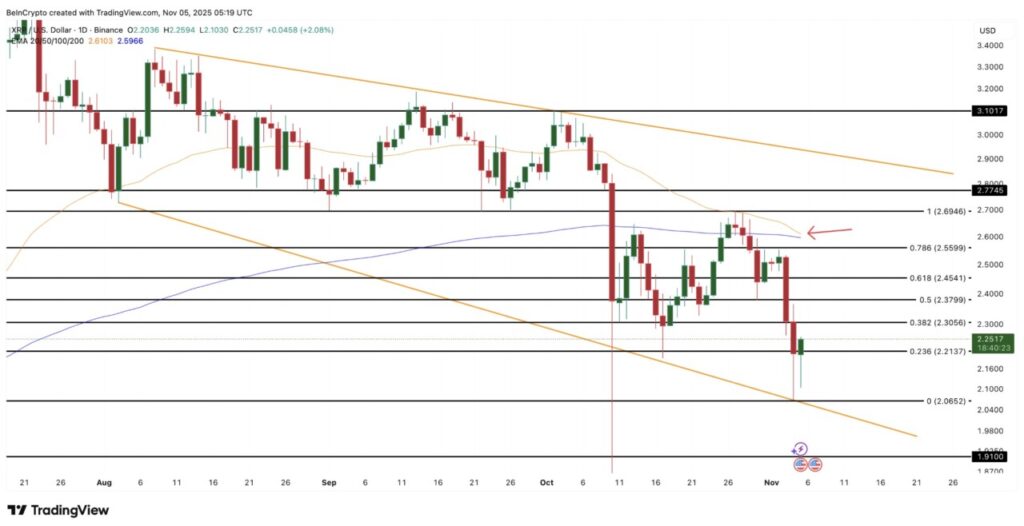
Adding to the technical perspective, analysts from B2BinPay provide a similar view. They view XRP’s current price structure as a consolidation phase within a larger uptrend, rather than a complete reversal:
“XRP is consolidating near the $2.25-$2.30 support area within a falling wedge pattern that sits within a broader ascending channel. The narrowing range and shrinking volume indicate volatility compression – usually a quiet phase before the next big price move. A strong close above $2.55-$2.70 could end the correction phase and pave the way towards $3.20-$3.40,” the analysts said.
For buyers, the main challenge remains at the top. The price chart shows that a break above $2.45 and $2.55 would turn short-term sentiment bullish again. This could pave the way towards $2.77 to $3.10 – possibly even higher, according to analysts’ projections. However, consolidation and bearish pressure need to end first.
That’s the latest information about crypto. Follow us on Google News to get the latest crypto news about crypto projects and blockchain technology. Also, learn crypto from scratch with complete discussion through Pintu Academy and stay up-to-date with the latest crypto market such as bitcoin price today, xrp coin price today, dogecoin and other crypto asset prices through Pintu Market.
Enjoy an easy and secure crypto trading experience by downloading Pintu crypto app via Google Play Store or App Store now. Also, get a web trading experience with various advanced trading tools such as pro charting, various types of order types, and portfolio tracker only at Pintu Pro.
*Disclaimer
This content aims to enrich readers’ information. Pintu collects this information from various relevant sources and is not influenced by outside parties. Note that an asset’s past performance does not determine its projected future performance. Crypto trading activities have high risk and volatility, always do your own research and use cold cash before investing. All activities of buying and selling bitcoin and other crypto asset investments are the responsibility of the reader.
Reference:
- BeInCrypto. XRP Price: Death Crossover Rebound Test. Accessed on November 6, 2025